STANDING BY OUR LOCAL COMMUNITIES - H1 2020 INTERIM RESULTS - MCCOLL'S CORPORATE WEBSITE
←
→
Page content transcription
If your browser does not render page correctly, please read the page content below
Standing by
  our local
communities

       H1 2020 Interim Results
Important notice

This presentation has been prepared by McColl’s           2000 (Financial Promotion) Order 2005 (the              looking statements due to the inherent uncertainty
Retail Group plc (the “company”) in connection            “Order”) or are high net worth companies,               therein. Forward-looking statements speak only as
with the publication of the company’s interim             unincorporated associations or partnerships or          of the date such statements and, except as
results for the 26 weeks ended 24 May 2020.               trustees of high value trusts as described in Article   required by the Financial Conduct Authority, the
                                                          49(2) of the Order and investment personnel of          London Stock Exchange or applicable law, the
This presentation does not constitute an invitation,
                                                          any of the foregoing (each within the meaning of        company undertakes no obligation to update or
offer to sell or any solicitation of any offer to buy
                                                          the Order); and (C) otherwise to persons to             revise publicly any forward-looking statements,
or subscribe for any securities in the company or
                                                          whom, or at which, it may otherwise be lawfully         whether as a result of new information, future
any of its subsidiaries or associated companies or
                                                          made, supplied or directed (each a “Relevant            events or otherwise.
its or their affiliates (the “group”).
                                                          Person”). No other person should act or rely on
                                                                                                                  This presentation is not for distribution, directly or
No reliance may be placed for any purpose                 this presentation and by accepting this
                                                                                                                  indirectly, in whole or in part, in or into the
whatsoever on the completeness or accuracy of             presentation you represent, warrant and agree
                                                                                                                  United States of America, Canada, the Republic of
the information or opinions contained in this             that you are a Relevant Person.
                                                                                                                  South Africa, Australia, Japan or any jurisdiction
presentation and no member of the group or any
                                                          This presentation may include statements,               where it would be unlawful to do so. The
of their respective officers, directors, employees,
                                                          estimates, opinions and projections with respect to     distribution of this presentation or any
representatives, agents or advisers take any
                                                          anticipated future performance of the group             information contained in it may be restricted by
responsibility for, or accepts any liability in respect
                                                          (“forward-looking statements”) which reflect            law in certain jurisdictions, and any person into
of, the accuracy or completeness of such
                                                          various assumptions concerning anticipated results      whose possession any document containing this
information.
                                                          taken from the group’s current business plan or         presentation or any part of it should inform
This presentation is directed at and is only being        from public sources which may or may not prove          themselves about, and observe, any such
distributed (A) in member states of the European          to be correct. Such forward-looking statements          restrictions.
Economic Area to persons who are “qualified               reflect current expectations based on the current
investors” within the meaning of Article 2(1)e of         business plan and various other assumptions and
the Prospectus Directive (Directive 2003/71/EC, as        involve significant risks and uncertainties and
amended); (B) in the United Kingdom to persons            should not be read as guarantees of future
who have professional experience in matters               performance or results and will not necessarily be
relating to investments and who fall within the           accurate indications of whether or not such results
definition of “investment professionals” in Article       will be achieved. As a result, recipients of this
19(5) of the Financial Services and Markets Act           presentation, should not rely on such forward-

H1 2020 INTERIM RESULTS                                                                                                                                                    2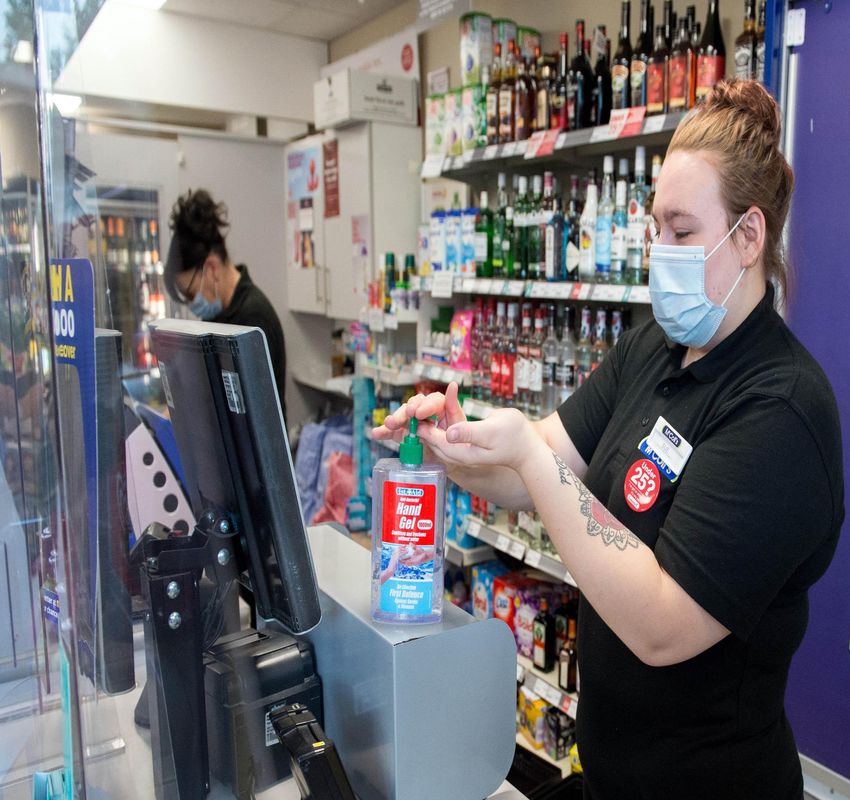
Agenda

• Introduction
• Trading through the COVID-19 crisis
• Financial review
• Strategic review
• Summary

       Interim results for 26 week period ended 24 May 2020

H1 2020 INTERIM RESULTS                                       3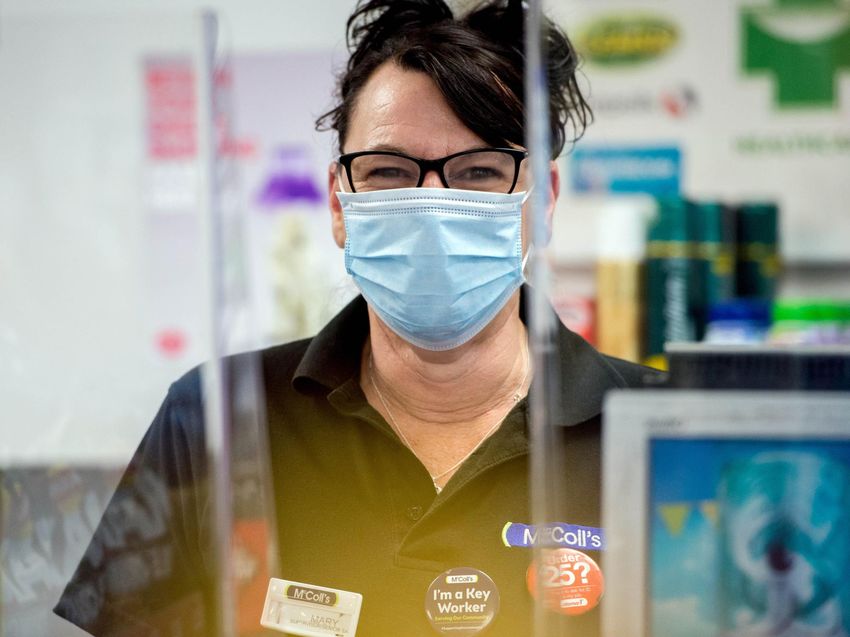
Leadership team to deliver

  Jonathan Miller              Giles David          Richard Crampton               Karen Bird

  Chief Executive            Chief Financial        Chief Commercial            Colleague &
      Officer                    Officer                  Officer             Operations Director

  Joined Group in 1991;        Two decades of        Extensive commercial       HR, Operations and
in-depth understanding of    experience in senior   experience at the Co-op   Change experience – 27
    convenience retail          finance roles           and Sainsbury’s           years at Tesco

Appointed CFO in 2004,       Joined Group and the     Joined Sept 2019;           Member of the
   and CEO in 2016           Board on 1 June 2020   appointed to the Board     Executive Committee
                                                       on 1 June 2020
                                                                                                     4
   H1 2020 INTERIM RESULTS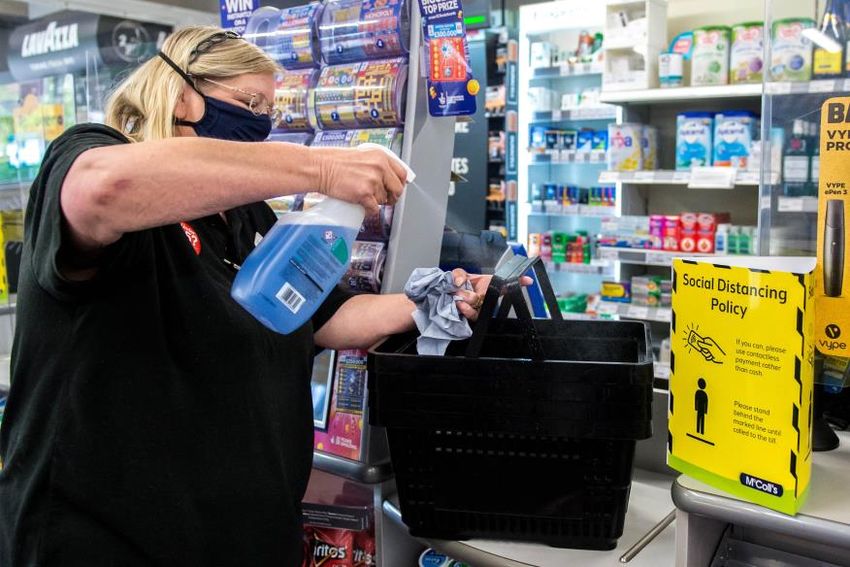
Standing by our local communities

• Business traded throughout the COVID-19
  crisis – serving our neighbourhoods in times of
  need

• Acted quickly to support colleagues, customers
  and key workers

• Strong LFL growth driven by shift to Grocery,
  BWS (beers, wine and spirits) and take home
  (multipacks)

• Profits maintained and leverage improved

• Progress on strategic initiatives - well
  positioned for the future

H1 2020 INTERIM RESULTS                             5
Financial headlines

 Revenue (£m)
                                                                               H1 20                                                                                             604.8
 £604.8                                                                         H1 19                                                                                               611.1
 Decline y-o-y reflects store closures

 LFL growth (1)
                                                                               H1 20                                                                                               8.3%

 +8.3%                                                                          H1 19                       1.0%
 Strong demand in Q2

 Gross margin
                                                                               H1 20                                                                                  24.9%
 24.9%                                                                          H1 19                                                                                   25.4%
 COVID-19 related mix impact

 Adjusted EBITDA (2) (3) (£m)
                                                                               H1 20                                                                                              13.1
 £13.1                                                                          H1 19                                                                                              13.0
 +1.0% vs H1 2019

 Net debt (3) (£m)
                                                                               H1 20                                                                                           82.0
 £82.0                                                                          H1 19                                                                                                89.7
 Improved by 8.6%
                                         (1)   LFL sales reflect sales from stores that have traded throughout the current and prior financial periods, and include VAT but exclude sales of fuel,
                                               lottery, mobile phone top up and travel tickets. Before impact of adjusting items and property gains/losses.
                                         (2)   After adjusting items
                                         (3)   Pre IFRS16 basis. See reconciliation in Appendix.

H1 2020 INTERIM RESULTS                                                                                                                                                                              6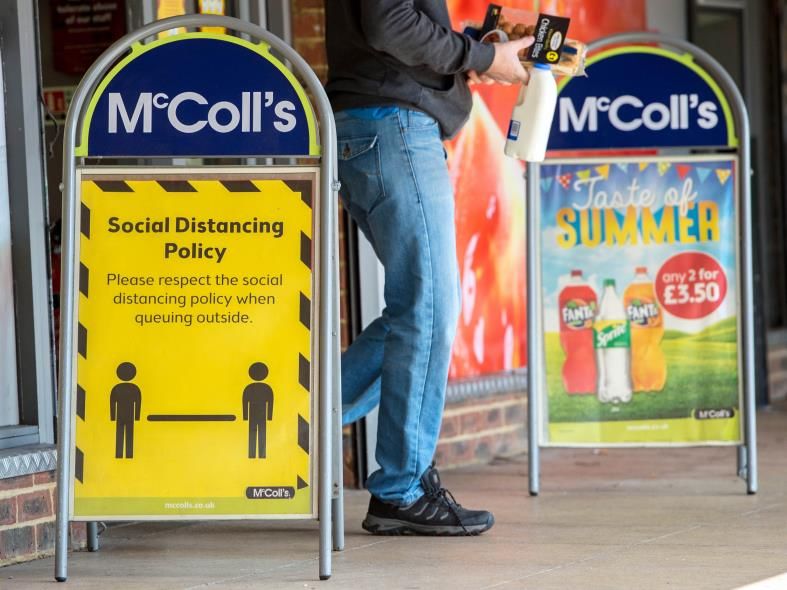
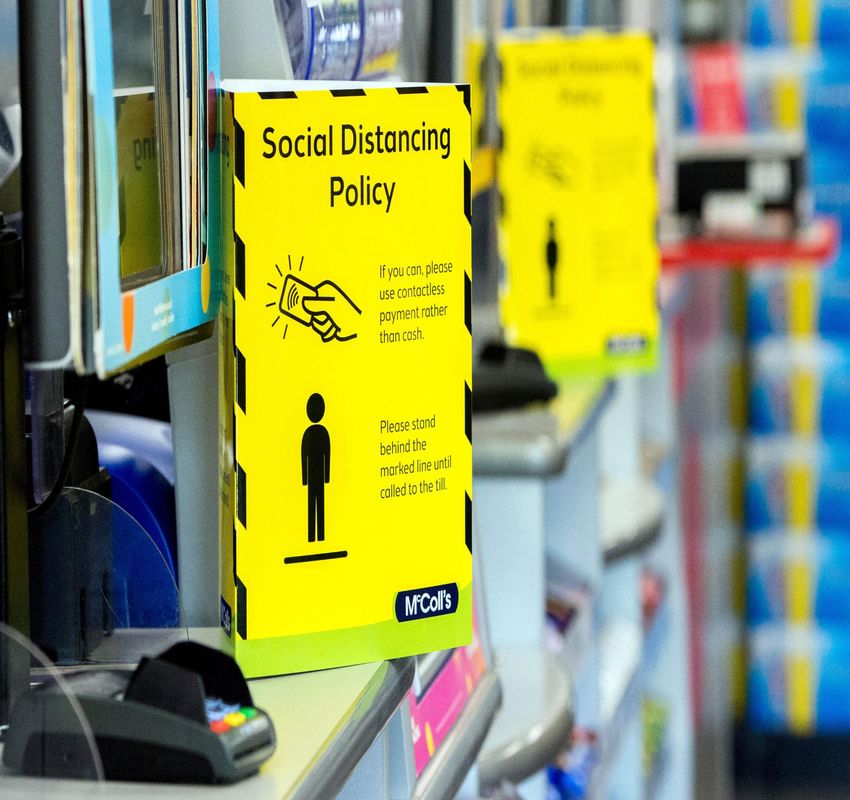
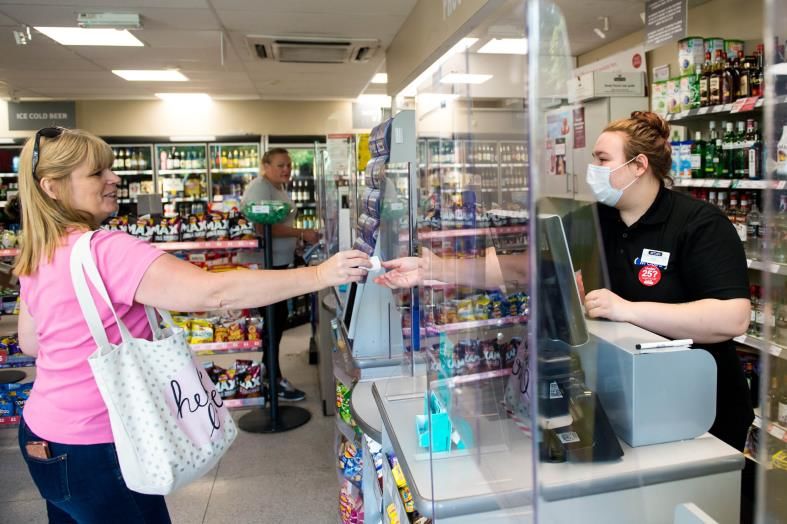
Trading
through the
COVID-19
crisis
Safeguarding customers and colleagues

• Majority of stores continued to trade
  through crisis

• Proactive response with policies in place to
  protect our colleagues

• Social distancing measures adopted to keep
  customers safe

• Additional personal protective equipment
  deployed

• Managed store opening times

• Temporarily withdrew scratch cards from
  sale

H1 2020 INTERIM RESULTS
                                                 8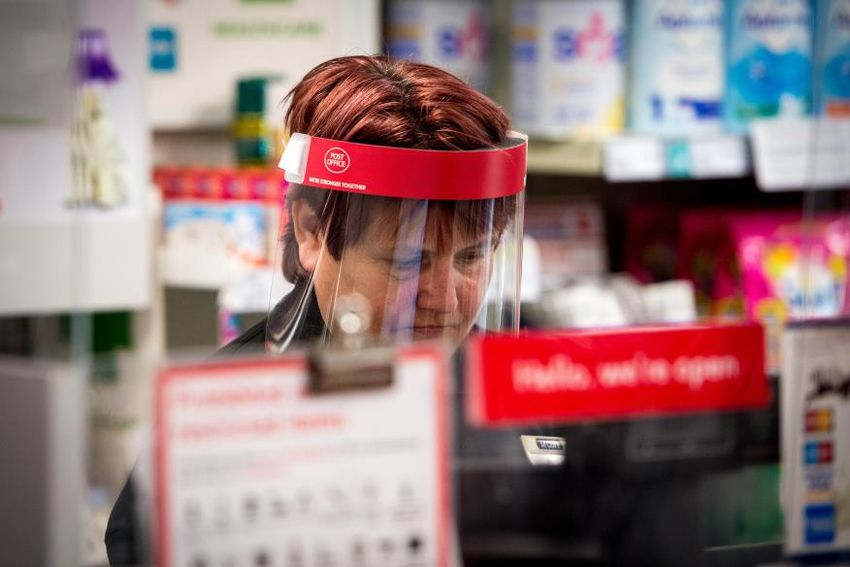
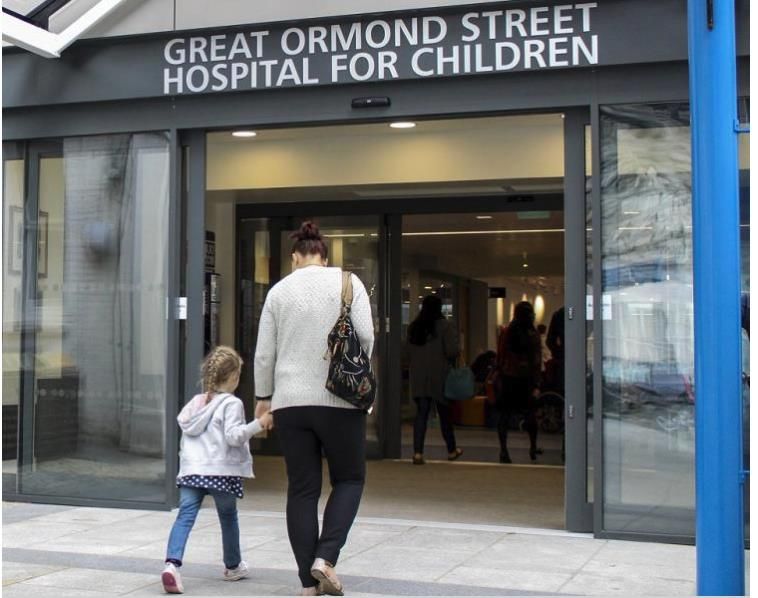
Actively serving our communities

• Selectively invested in price in key product areas

• Managed product availability to respond to
  demand

• Free food delivered to NHS Great Ormond St

• Over 30,000 free coffees for emergency
  services, key workers and delivery drivers

• Joined school voucher scheme

• Big Issue sold in stores

H1 2020 INTERIM RESULTS                                9
Market backdrop:
Strong shift to convenience

          Customers migrating to                                  Main shop and evening meals
          Convenience and Online                                     moved to Convenience
          % of shoppers using as main channel                     % of shoppers stated main shopping mission

                                                           Top up shop                                          66%
                     11%                                                                                  49%
  Convenience
                   7%
                                                          Main/big shop              10%
                                                                           2%
                    10%
        Online
                   7%                                                           7%
                                                          Evening Meal    0%

                  3%                                                            7%
  Frozen Food                                               Other items
                 2%                                                                    15%

                                                             Food to go         7%
                            22%                                                            16%
 Food discount
                           21%
                                                        Health & Beauty   1%
                                                                                6%
                                            52%
 Supers/Hypers
                                                  60%                     1%
                                                              Non food     2%

                          Apr-20   Apr-19                                              Apr-20    Apr-19

  Source: IGD 2020, total market                               Source: IGD 2020, convenience market

H1 2020 INTERIM RESULTS                                                                                           10
Market backdrop:
Change in shape of demand
Ambient grocery and BWS Convenience customers buying
largest gainers bigger packs
£2.40
Total Value Growth Year to 30 May £m
Ambient 1,100
BWS (Beers, Wines & Spirits) 728
£2.20
Price per unit
Frozen 363
Produce 271
Household 262
£2.00
Fresh Meat 256
Chilled 186
Health & Beauty 174
£1.80
Petcare 13
Fresh Fish 7
Bakery -20
2019 2020
Other non-food -168
Source: IRI 2020, total market Source: Nielsen 2020, convenience market
H1 2020 INTERIM RESULTS 11Market outperformance
LFL growth accelerated ahead of market
Strong increase in demand 30% Convenience McColl's
• H1 LFLs of +8.0%, outperformed
20%
the market in Q2 by >4 percentage
LFL sales
points 10%
• Reflects stronger sales in
0%
neighbourhood locations
Source: Nielsen 2020
Fewer trips with larger baskets
Consumer behaviour has changed
+31% -17% +27%
• Customers shopping locally – less
often but bigger basket
Basket Transaction Items
size Count per basket
H1 2020 INTERIM RESULTS Source: Company data for Q2 FY20 12Changed shape of trade
LFL change % in key categories in H1 2020
• Strong uplift in Grocery and
BWS (beer, wine, spirits)
Groceries - fruit & veg
• Shift away from impulse BWS (beer, wine, spirits)
purchases (confectionery, soft Groceries - non food
drinks) to take home
(multipacks) Grocery - chilled
Groceries - frozen
• Increase in promotional
Tobacco
participation
News
Crisps and snacks
Soft drinks
Confectionery
Food to go
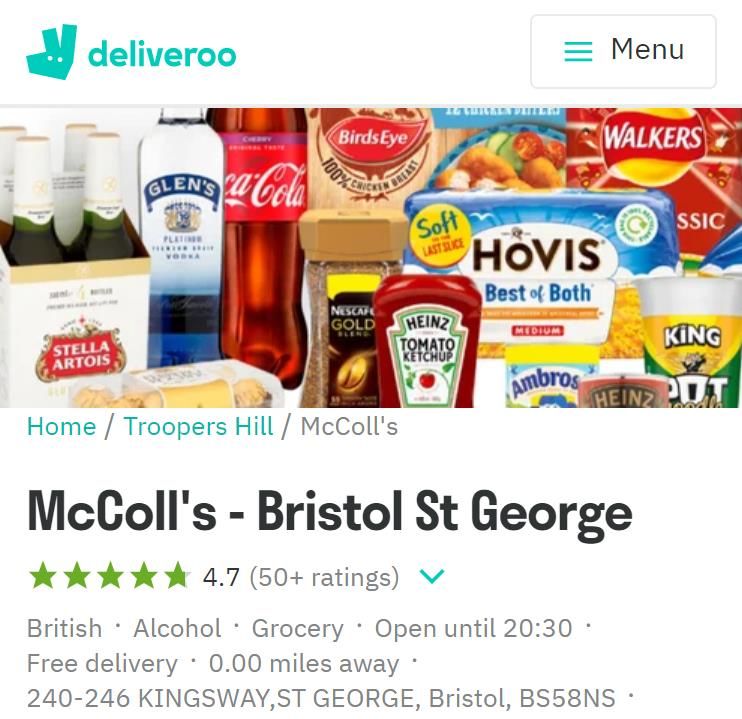
H1 2020 INTERIM RESULTS 13Accelerated roll-out of delivery service
• Strong demand for local delivery
• 120 stores implemented; more in
pipeline
• 300-400 SKUs to choose from
• Incremental revenue opportunity
• Continuing to explore additional
options
• Home News Delivery grown by
25%
• Now supplying over 100,000
accounts
H1 2020 INTERIM RESULTS 14Financial Review
Summary income statement

 £m                                                   H1 20                     H1 20
                                                                  IFRS16
                                                       post                       pre        H1 19
                                                                  impact
                                                     IFRS16                    IFRS16
Revenue                                              604.8                     604.8         611.1
                            1
Like-for-like sales (LFL)                                                       8.3%         1.0%            Accelerated growth post COVID-19

Gross profit                                         150.7                      150.7        155.0

Gross profit margin                                 24.9%                      24.9%        25.4%            Sales mix change

                                   2
Adjusted administrative expenses                    (144.3)        (3.6)      (147.9)       (153.8)

Adj. administrative expenses/revenue                23.9%                      24.5%        25.2%            Store optimisation impact; living wage costs

Other operating income & property-related
                                                       2.0          0.2          2.2          3.4            Lower ATM usage and property-related income
profits
Adjusted operating profit                              8.4         (3.4)         5.0          4.6

Depreciation & Amortisation                           19.4        (11.5)         7.9          8.6
Property related items and
                                                       0.2                       0.2         (0.2)
share based payments
Adjusted EBITDA                                       28.0        (14.9)         13.1         13.0

Adjusted EBITDA margin                               4.6%                       2.2%         2.1%

                                            (1) LFL sales reflect sales from stores that have traded throughout the current and prior financial
                                                periods, and sales include VAT but exclude sales of fuel, lottery and mobile phone top-up
H1 2020 INTERIM RESULTS                     (2) Before impact of adjusting items of £1.1m                                                                   16
Revenue bridge
Revenue bridge (£m) Store closures to slow in H2 2020
-25.8
+45.6 78
-26.1 65
42
611.1 604.8
H1 2019 Product LFL Services LFL Store H1 2020 H1 2019 H2 2019 H1 2020 H2 2020
Revenue optimisation Revenue
• Strong product LFL revenue growth driven by • Current store numbers 1,379
uplift in Grocery and BWS
• Current trajectory of store closures to slow in
• Services LFL revenues lower due to Q3 due to COVID-19
contraction in Post Office footfall and
temporary withdrawal of scratch cards
• Further store optimisation of at least 250
• 65 stores closed during H1 2020; 120 closed stores planned over medium term
in FY19
H1 2020 INTERIM RESULTS 17Changing revenue mix impacting margin
H1 2019 H1 2020
24%
28%
41%
46%
30%
31%
Confectionery/Soft drinks/Snacks/News
Switch away from higher-margin impulse confectionery and snacks towards take home (multipacks)
H1 2020 INTERIM RESULTS 18EBITDA bridge (£m)
-1.0
+3.3
-3.2
+1.4
-2.1 +1.7
13.0 People: -£0.9m 13.1
Cards/ATM: -£0.7m
Cleaning/PPE: -£0.5m
Product LFL growth offset by wage inflation and COVID-19 costs; business rates relief welcome
H1 2020 INTERIM RESULTS 19Net debt position improved
FY19 Net Debt Adj. EBITDA Exceptionals Working Capital Tax Net interest Capex Other H120 Net Debt
-82.0
-94.1
+1.1
-4.0
+10.0 -6.3
-1.4 -0.4
+13.1
Net debt1 position improved by £12m since year-end
(1) Net debt for H1 2020 excludes the IFRS 16 impact of lease liabilities of £202.2m 20
H1 2020 INTERIM RESULTSSummary cash flow
Cash flow (£m)
H1 20 H1 19
Adjusted EBITDA1 13.1 13.0
Cash impact of exceptional items (1.4) (1.3)
Tax received/(paid) 1.1 (1.4)
Faster stock turn and deferral of VAT
Change in working capital 10.0 4.4 payments due to COVID-19
Other 0.1 0.2
Operating cash flow 22.9 14.9
Capital expenditure (6.3) (7.5) Disciplined investment
Net interest paid (4.0) (4.0)
Lease financing (0.6) (1.0)
Sale and leaseback 0.0 6.5
Free Cash Flow 12.0 8.9
Net debt (£m)
H1 20 H1 19
Closing net debt (pre IFRS 16) (82.0) (89.7)
Net debt / Adjusted EBITDA1 2.5x 2.8x Leverage ratio improving
(1) Before adjusting items and excluding property gains and losses
H1 2020 INTERIM RESULTS 21Financial priorities
• Deleveraging remains key priority Net Debt (pre IFRS 16)
£m
– Funding to May 2022
Term loan (72.5)
RCF drawdown (£100m facility) (77.5)
– Working capital improvements
Other borrowings & lease liabilities (2.8)
Gross debt (152.8)
– Disciplined capex investment
Cash at bank and in hand 70.8
– Head office disposal to complete in Net debt (82.0)
Autumn 2020
• Review store optimisation programme Optimal number of future sites targeted
1379
– Focus on non-profitable sites 1100
– Targeting optimal store estate of
1,100 sites
Current sites Target
H1 2020 INTERIM RESULTS 22Strategic Review
Strategic change programme

                       Your Favourite Neighbourhood Shop

     Strong customer                 Easy to                      Improving                Great place
               offer                run stores                    our stores                to work
                            – Full understanding of        – Accelerated store       – Market leading
 – Segmented estate that
                              cost to serve e2e              optimisation              customer service
    meets the need of the
    communities we serve    – Neutralising external        – Refined refresh and     – Training and tools to do
                              cost inflation                 acquisition models        the job
 – Products, pricing and
    services                – Embracing new                – Mission based layouts   – Listening and
                              technology                                               responding
 – Continual category                                      – New maintenance and
    review programme        – Early trial stores to test     energy strategy         – Career development,
                              and learn                                                diversity and inclusion

H1 2020 INTERIM RESULTS                                                                                           24
Progress against strategic
change programme
• Grocery and BWS sales mix up 4 percentage points
Strong • Food-based stores showing strongest sales uplifts
customer • Selective price investment
• Deliveroo service launched in 120 sites
offer • Investment in insight driving customer agenda
• Active stock management programme delivering W/C improvements
Easy to • Reorganising field teams to improve customer focus and operating costs
run stores • First phase of operating model review completed
• 65 sites exited in H1 focusing the business on the most profitable sites
Improving • New sites and refurbishments de-emphasised during COVID-19 phase
• New space and range format team created
our stores • New maintenance and energy strategy deployed
Great place • Pandemic has accelerated cultural change
• Empowered front line colleagues
to work • Colleagues supporting local communities
• Committed investment in learning and development
H1 2020 INTERIM RESULTS 25Summary
Well positioned for the future

• Supported our local communities through the crisis

• Trading over COVID-19 period has validated the strategy

• Re-focused our priorities to respond to changing consumer behaviours and
  environment

• Made good progress against key strategic initiatives

• Maintained profit and improved net debt

• Well positioned to leverage accelerated trends in consumer behaviour and growth
  of the convenience sector

                                                                                    27
H1 2020 INTERIM RESULTS
Appendix
IFRS16 reconciliation
EBITDA

    Adjusted EBITDA excluding property-related items                                                              H1 20                    H1 19
    & share based payments                                                                                        £ 000                    £ 0001

    Operating profit before adjusting items                                                                           8,399                    4,553

    Depreciation and amortisation2                                                                                  19,458                     8,630

    Losses/(profits) arising on property-related items                                                                   74                     (156)

    Share based payments                                                                                                 90                         -

    Total Adjusted EBITDA                                                                                           28,021                    13,027

    IFRS 16 impact (net rent payable)                                                                             (14,886)                          -

    Pre IFRS 16 Adjusted EBITDA                                                                                     13,135                    13,027

     Notes:
     The Group has adopted IFRS 16 effective 25 November 2019 using the modified retrospective approach option. Under this option the comparative
     information is not restated.
     For the 26-week period ended 24 May 2020 depreciation charge is £11.5m higher as a result of adopting IFRS 16.

H1 2020 INTERIM RESULTS                                                                                                                                 29
IFRS16 reconciliation
Net Debt
As at As at As at
H1 20 H1 19 FY 19
£ 000 £ 000 £ 000
Cash at bank and in hand 70,793 36,906 36,999
Term Loan and revolving facility available until May 2022 (150,000) (124,980) (129,500)
Less: unamortised issue costs 1,809 1,218 962
(148,191) (123,762) (128,538)
Other borrowings (2,545) - -
Lease liabilities (204,322) (2,840) (2,580)
Net debt (284,265) (89,696) (94,119)
Lease liabilities - IFRS 16 impact 202,221 - -
Net debt pre IFRS 16 (82,044) (89,696) (94,119)
Notes:
The Group has adopted IFRS 16 effective 25 November 2019 using the modified retrospective approach option. Under this option the comparative
information is not restated.
H1 2020 INTERIM RESULTS 30Contacts McColl’s Retail Group plc Jonathan Miller - Chief Executive Giles David - Chief Financial Officer Tej Randhawa - Head of Investor Relations and Corporate Affairs Investor Relations: investor.relations@mccolls.co.uk H1 2020 INTERIM RESULTS 31
You can also read