Level 3 Lockdown impact on shopping patterns - COVID-19 Impact on CPG & Retail in ZA - Trade ...
←
→
Page content transcription
If your browser does not render page correctly, please read the page content below

COVID-19 Impact on CPG & Retail in ZA

Level 3 Lockdown impact on
shopping patterns

July 2020
Today’s Discussion

• COVID – 19 update

• Latest category performance

• Liquor performance since the re-opening

• Price changes during Lockdown

• IRI and BCG global update

                                            © 2020 Information Resources Inc. (IRI). Confidential and Proprietary.   2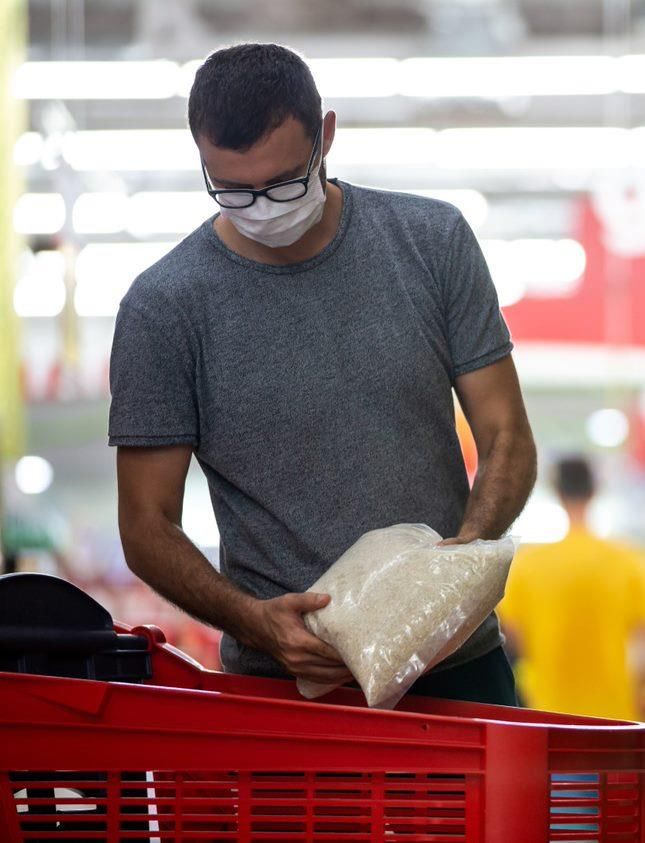
Grocery sales are slowing and Liquor had its fair share
•   The easing of lockdown restrictions to Level 3 and the re-opening of Liquor has negatively
    impacted Grocery growth over the last few weeks
•   Growth over the total lockdown period has slowed from 7% to 6%. IRI expects this trend will
    continue as consumers become increasingly cash strapped
•   For the first time since the start of lockdown, we’re seeing declines in the latest week for Flour, Ice
    Cream, Spices and Seasonings, Condiments and Snacks, indicating consumers are eating out of
    home again. Google searches for recipes and baking are also on the decline
•   Soap and Sanitizers continue to be at the top of consumer shopping lists and Vitamins have
    gained importance, as consumers opt for preventative remedies during the winter season
•   Hair Care declines at -7% in the last week with the re-opening of hair salons. This is down from a
    +22% growth four weeks ago
•   After an initial two week Liquor stock-up, Liquor sales have slowed recently with the share of
    spend dropping below a year ago levels (5% in the latest week vs 6% average over June last
    year). Brandy, Gin and Wine were clear winners in the first two week stock-up
•   Despite numerous reports of steep inflation across Grocery, formal retail inflation over April and
    May 2020 was 5.8% (observed across 320 top selling products). Cooking Oil, Hot Porridge,
    Condiments, Pet Food and Canned Veg recorded the highest inflation of observed categories
•   Traditional sales forecasting models need to be adapted and updated regularly to accurately take
    into account the COVID-19 effect and changing consumption patterns. IRI has developed a
    machine learning based algorithm that re-evaluates the assessment of each factor and enables
    more accurate estimations of probable changes in the COVID-19 wear-out effect on sales
    patterns, as well as the potential effect of a second wave

                                                                                                              © 2020 Information Resources Inc. (IRI). Confidential and Proprietary.   3
COVID Update

               © 2020 Information Resources Inc. (IRI). Confidential and Proprietary.   4
SA COVID-19 cases continue to increase by >40% per week. Global cases are above 10 million

#                                        Cases                                                      Deaths
1           USA                                                  2 727 996                                                                             130 123

2          Brazil                          1 408 485                                                                  59 656

3         Russia               654 405                                                         9 536

4           India            586 956                                                              17 417

5            UK          312 654                                                                               43 730

6          Spain         296 351                                                                        28 355

7           Peru        285 213                                                                9 677

8          Chile        279 393                                                              5 688

9           Italy       240 578                                                                            34 767
                                          10 609 665 globally                                                             514 452 globally
//
                                           +42% vs. last week                                                             +26% vs. previous update
17   South Africa     151 209                                                               2 657

                                                                                    © 2020 Information Resources Inc. (IRI). Confidential and Proprietary.       5
               https://www.worldometers.info/coronavirus/#countries 1st July 2020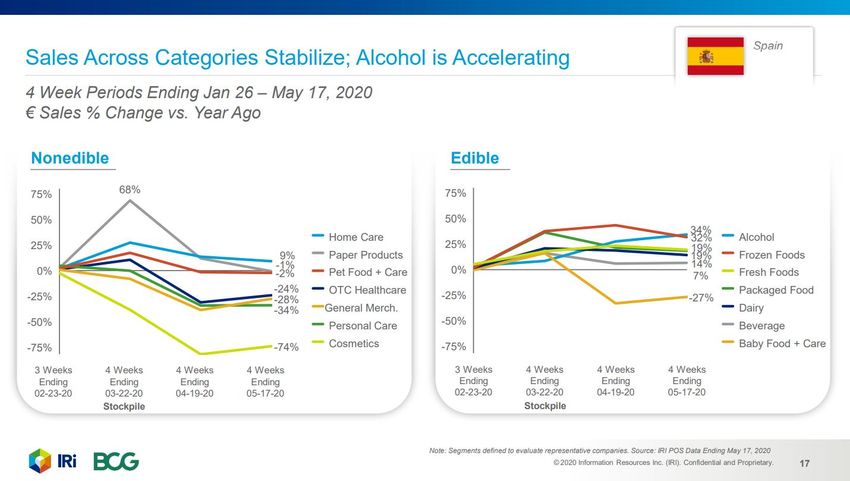
The Western Cape remains the epicenter for SA COVID-19 cases, however transmission is
increasing sharply in both Gauteng and Eastern Cape

        Source (29th May 2020):
        https://sacoronavirus.co.za/2020/06/30/update-on-covid-19-30th-june-2020/                                     © 2020 Information Resources Inc. (IRI). Confidential and Proprietary.   6
        https://www.news24.com/news24/southafrica/investigations/graphics-gauteng-now-recording-more-covid-19-cases-a-day-than-the-western-cape-has-at-any-point-20200627
SA COVID-19 Timeline

                                                                Apr 2                        Apr 15                                                          June 1                      June 22
                                                                                                                                   May 19                                                 100k
                                                                Global                       Global                                                        Alcohol sale
                                                                cases:                                    May 1                  Announce                                                positive
                                             Mar 23                                          cases:                                                        unbanned
     Jan 11                                                      1m                           2m         Move to                  ment that                                               cases
                                             21-day                                                                 May 14        schools
      China                        Mar 11 lockdown                                                       Level 4
   reports first                                                                                                   All online       will
                                    WHO announced                                                       Lockdown                                    May 24         June 3
      death                                                                                                          retail      reopen on
                                  declares            Mar 27                                                         sales                         Announce     LD level 4&3
                                                                                   Apr 10                                         1st June          ment SA
                                 Coronavirus        First death                                                    open (excl                                    declared
                                 outbreak a          in South                     Lockdown                                                         will move unconstitutional
                                                                                                                    Liquor &
                                 Pandemic              Africa                     extended                                                         to Level 3
                                                                                                                   Tobacco)
  Jan              Feb    Mar                                             Apr                          May                                                    June
 2020              2020   2020                                           2020                          2020                                                   2020
                                                                                Lockdown Level 5                            LD Level 4                                               LD Level 3

               Jan 30                               Mar 26
                WHO                               Start of SA
              declares      Mar 5                                                                                                                         May 28
                                                  lockdown                   Apr 7
           global health First South                                                                                                                     US reaches
                                                                         Boris Johnson
             emergency     African                                                                                                                        100 000
                                                                          admitted to
                             tests                                                                                                                         deaths
                                                                            hospital                  Apr 27   May 8                   May 20                                June 11                June 27
  Dec 31                 positive for
                                                                                                      Global   Global                  Global                                 Global                 Global
China alerts             Coronavirus Mar 15                                                                    cases:
                                                                                                      cases:                           cases:                                 cases:                 cases:
WHO to many                           Ramaphosa     Mar 26                                             3m       4m                      5m                                     7.5m                   10m
 unusual                               declares a   Global
pneumonia                               National    cases:
 cases in                               State of     500k
  Wuhan                                 Disaster                                                                                                              Current Data Week

                                                                                                                          © 2020 Information Resources Inc. (IRI). Confidential and Proprietary.     7
The easing of lockdown to level 3 has broadened the scope for economic recovery,
however concerns around high case numbers could lead to another hard lockdown

                                                                                                  https://businesstech.co.za/news/gov
                                                                                                  ernment/411531/6-lockdown-
                                                                                                  changes-announced-for-south-
                                                                                                  africa/
                                                                                                  https://www.businessinsider.co.za/w
                                                                                                  hat-the-original-hard-lockdown-now-
                                                                                                  called-level-5-looked-like-2020-7

                                                     © 2020 Information Resources Inc. (IRI). Confidential and Proprietary.    8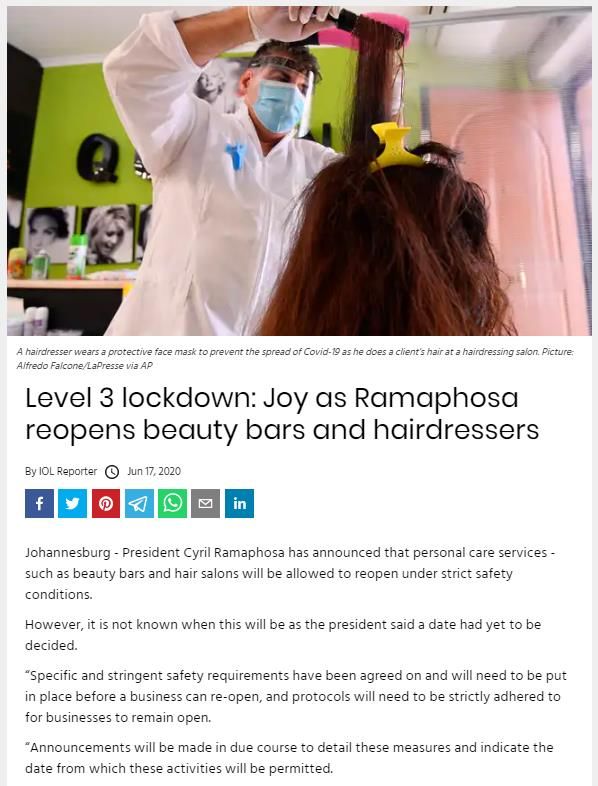
Latest Category
Performance

                  © 2020 Information Resources Inc. (IRI). Confidential and Proprietary.   9
Easing of restrictions has resulted in consumers spending more time at Retail, Transit Stations and
Parks versus April

How have visits & length of stay at different places changed compared to baseline?                                                                           Percentage
                                                                                                                                                             Point Change
South Africa lockdown vs. baseline period (5 wks to Feb 6th)                                                                                                 versus Apr 3rd
                                                                                                                                                             Release

    Retail & Recreation                                Grocery & Pharmacy                                     Transit Stations

          -36%               +43pp
                                                                   -20%               +40pp
                                                                                                                        -52%                       +28pp

            Parks                                              Workplaces                                           Residential
          -23%               +22pp
                                                                   -36%               +13pp
                                                                                                                       +19%                           -5pp

         Google COVID-19 Community Mobility Report for South Africa, 23rd June 2020           © 2020 Information Resources Inc. (IRI). Confidential and Proprietary.   10
         https://www.gstatic.com/covid19/mobility/2020-06-23_ZA_Mobility_Report_en-GB.pdf
Total Sales decline –11% in the last week compared to YA. Following the growth trends in previous
weeks, this indicates that shoppers may be cash-strapped after stockpiling in early June
Total Edible & Non-Edible Groceries (incl. Liquor))
Weekly Actual Value sales
Lockdown growth vs. YA: +6%
22/03/2020 29/03/2020 05/04/2020 12/04/2020 19/04/2020 26/04/2020 03/05/2020 10/05/2020 17/05/2020 24/05/2020 31/05/2020 07/06/2020 14/06/2020 21/06/2020 28/06/2020
Last Yr This Yr
Panic Lockdown
Lockdown Level 5 Lockdown Level 4
Buying Level 3
Liquor Included Liquor Excluded Liquor Included
© 2020 Information Resources Inc. (IRI). Confidential and Proprietary. 11As consumers spend more on Liquor, slowing growth and declines are evident across
almost all categories in the last week
March April May June Jun 7th Jun14th Jun21st Jun28th
Baking Ingredients Baking Ingredients
Ice Cream Ice Cream
Wheat Flour Wheat Flour % Value
Edible Groceries
Yoghurt Yoghurt
Biscuits Biscuits
growth vs. YA
Frozen Veg/Potato Frozen Veg/Potato
Spices & Seasoning Spices & Seasoning
Scale:
Condiments & Sauces Condiments & Sauces
>100
Cheese Cheese
Dry Pasta Dry Pasta 70 to 100
Snacks Snacks
50 to 70
Sugars & Sweetners Sugars & Sweetners
Spreads Spreads
30 to 50
Cereals Cereals 11 to 30
Oil Oil
0 to 10
Canned Food Canned Food
Confectionery Confectionery -10 to 0
Soup & Stock Soup & Stock -30 to -10
Fresh Meat Fresh Meat
-30 to -50
Bread Bread
Frozen Meats Frozen Meats < -50
Rice Rice
Maize Maize
© 2020 Information Resources Inc. (IRI). Confidential and Proprietary.
© 2020 12 Inc. (IRI).
Information Resources
Confidential and Proprietary.Shoppers continue to buy Soaps and Sanitisers and are stocking up on Vitamins and
winter medications, following the cold spells in recent weeks
March April May June Jun 7th Jun14th Jun21st Jun28th
Soaps & Sanitiser Soaps & Sanitiser
% Value growth vs.
Household Cleaning Household Cleaning YA
Non-Edibles
Wipes Wipes
Scale:
Personal Care Personal Care
Toilet Paper Toilet Paper >100
70 to 100
Oral Care Oral Care
50 to 70
Vitamins Vitamins
30 to 50
Medicinal Medicinal
11 to 30
Pet Pet
0 to 10
-10 to 0
-30 to -10
-30 to -50
March April May June Jun 7th Jun14th Jun21st Jun28th
Beverages
< -50
Milk Milk
Coffee & Tea Coffee & Tea
Juice Juice
CSDs & Water CSDs & Water
© 2020 Information Resources Inc. (IRI). Confidential and Proprietary. 13Staple Foods, Soap & Sanitiser and Vitamins are the top growth categories in the
last week
Top Value Growth Categories vs. Year Ago by Week
Latest 9 weeks of Lockdown
May 3rd May 10th May 17th May 24th May 31st Jun 7th Jun14th Jun21st Jun28th
Baking Ingredients Soaps & Sanitiser Baking Ingredients Baking Ingredients Baking Ingredients Spirits Spirits Soaps & Sanitiser Vitamins
Soaps & Sanitiser Wheat Flour Ice Cream Ice Cream Ice Cream Wine Wine Baking Ingredients Baking Ingredients
Ice Cream Sugars & Sweetners Sugars & Sweetners Wheat Flour Soaps & Sanitiser FABs Soaps & Sanitiser Household Cleaning Soaps & Sanitiser
Spices & Seasoning Rice Wheat Flour Soaps & Sanitiser Wheat Flour Ice Cream Household Cleaning Dry Pasta Biscuits
Sugars & Sweetners Baking Ingredients Soaps & Sanitiser Sugars & Sweetners Yoghurt Beer Coffee & Tea Wheat Flour Cheese
Cheese Spices & Seasoning Spices & Seasoning Biscuits Biscuits Soaps & Sanitiser Wheat Flour Frozen Veg/Potato Dry Pasta
Yoghurt Oil Oil Yoghurt Frozen Veg/Potato Yoghurt Yoghurt Spices & Seasoning Oil
Biscuits Soup & Stock Spreads Snacks Spices & Seasoning Wheat Flour Dry Pasta Cheese Medicinal
Condiments & Sauces Yoghurt Dry Pasta Spices & Seasoning Condiments & Sauces Baking Ingredients Oil Spreads Sugars & Sweetners
Spreads Dry Pasta Condiments & Sauces Confectionery Cheese Sugars & Sweetners Frozen Meats Frozen Meats Spreads
Non-Edible Baking/Indulgent Edible Groceries Liquor
© 2020 Information Resources Inc. (IRI). Confidential and Proprietary. 14Hair related searches reveal a split in South Africans – those who are eager to
return to a salon vs those who continue to groom from home
Hair Related Query Search
Search Terms – Interest over Time 1. Hair salon lockdown
South Africa 2. When can hair salons open
3. Herbalife hair products
Recipes Baking Hair
4. Rice water for 4c hair
120 5. Hair cutting scissors
100
Recipe Related Query Search
1. Pineapple beer recipes
80 2. Wrap dough recipes
3. No knead bread recipes
4. Moonshine recipes
60
5. Evaporated milk recipes
40
Baking Related Query Search
1. How to whiten your teeth
20
2. Pancakes without baking powder
3. What is shortening in baking
0 4. Easy banana bread recipe
2020/05/07
2020/05/09
2020/05/11
2020/05/13
2020/05/15
2020/05/17
2020/05/19
2020/05/21
2020/05/23
2020/05/25
2020/05/27
2020/05/29
2020/05/31
2020/06/02
2020/06/04
2020/06/06
2020/06/08
2020/06/10
2020/06/12
2020/06/14
2020/06/16
2020/06/18
2020/06/20
2020/06/22
2020/06/24
2020/06/26
2020/06/28
5. Egg substitute for baking
© 2020 Information Resources Inc. (IRI). Confidential and Proprietary. 15The beauty industry has been hard hit during lockdown, however it should see a
slow recovery now that services are allowed to resume
Hair Care growth has slowed to -7% in the
latest week (down from 22% 4 weeks ago)
https://www.businessinsider.co.za/the-rules-for-haircuts-massages-and-tattoos-which-are-legal-again-2020-6 © 2020 Information Resources Inc. (IRI). Confidential and Proprietary. 16
https://www.iol.co.za/news/politics/level-3-lockdown-joy-as-ramaphosa-reopens-beauty-bars-and-hairdressers-49516850Liquor Performance since
the Re-Opening
© 2020 Information Resources Inc. (IRI). Confidential and Proprietary. 17All Liquor categories saw declines over the latest week, after an initial 2 weeks of
stock-up
Liquor Value Growth vs. YA
Total Liquor Beer Wine Spirits FABs
120
100
80
60
40
20
0
-20
-40
-60
07/06/2020 14/06/2020 21/06/2020 28/06/2020
© 2020 Information Resources Inc. (IRI). Confidential and Proprietary. 18Shoppers have shifted sales back into Dry Grocery, however not to the same extent as before.
Currently at 5% share of spend
Value share of Total Spend Liquor
8 8 9 6 6 6 7 5 5
10 10 10
10 8 9 10 8
8 9 10 9 GM / Other
8 8 10
34 35
33 33 32 33 34 35 35 36 Fresh / Frozen /
34 34
Perishable
9 8
9 9 10 10 8 8 8 8 7 Non-Edible
7
Groceries
41 41 40 42 43 42 41 40 41 44 Dry Groceries
39 39
4 wks to 4 wks to 07/06/2020 14/06/2020 21/06/2020 28/06/2020 4 wks to 4 wks to 07/06/2020 14/06/2020 21/06/2020 28/06/2020
28/06/2019 28/06/2020 28/06/2019 28/06/2020
LSM 1-6 LSM 7-10
© 2020 Information Resources Inc. (IRI). Confidential and Proprietary. 19Demand for alcohol was low over the last two weeks after consumers stocked up, with the exception of
Gin which continues to grow
% Value growth vs.
YA
Jun 7th Jun14th Jun21st Jun28th
Rum >100
70 to 100
Gin Only Gin is seeing continued
Other Spirits 50 to 70
growth in the last week,
Whisky 30 to 50
Liquor
while Beer, FAB's and other
Brandy 11 to 30
spirits are showing strong
Vodka 0 to 10
Wine
declines vs YA -10 to 0
Beer -30 to -10
FABs -30 to -50
Spirits < -50
© 2020 Information Resources Inc. (IRI). Confidential and Proprietary. 20LSM 1- 6 spent more on Wine over the last 4 weeks vs YA, while LSM 7-10 apportioned more spend on
both Wine and Spirits
Value share of Liquor Spend
13% 11% 13% 9% 10% 13%
17% 16% 18% 14% 15% 17%
Fabs
41% 44% 46% 43% 42%
44% 43% Spirits
42% 42% 40% 44% 42%
16% 17% Beer
22% 18% 20% 20%
26% 27% 24% 24% 26%
28%
27% 29% 29% 26% Wine
24% 24%
16% 14% 18% 17% 16%
13%
4 wks to 4 wks to 07/06/2020 14/06/2020 21/06/2020 28/06/2020 4 wks to 4 wks to 07/06/2020 14/06/2020 21/06/2020 28/06/2020
28/06/2019 28/06/2020 28/06/2019 28/06/2020
LSM 1-6 LSM 7-10
© 2020 Information Resources Inc. (IRI). Confidential and Proprietary. 21Price Changes during
Lockdown
© 2020 Information Resources Inc. (IRI). Confidential and Proprietary. 22IRI investigated 32 South African CPG categories and observed an average market
inflation of 5.8% (April – May 2020 vs LY)
Inflation during All but 3 of the
lockdown was categories
+1% higher vs investigated
the pre-lockdown were seeing
period inflation
Latest CPI, as The top 10
reported by products per
StatsSa (April category are inflating
2020), is at 3% at an average of
5.7% vs LY
Liquor excluded (no sales in April and May)
Sample of South African monthly and weekly data sources and CPG categories
© 2020 Information Resources Inc. (IRI). Confidential and Proprietary. 23Top categories seeing inflation vary across food categories, with numerous factors
within each category driving the inflation
Cooking Oils Inflation is a complex concept, influenced by numerous factors which cannot
be attributed to a single key driver
Hot Porridge Reasons for perceived price increases vary by category and by retailer.
Possible contributing factors include:
Condiments
• Increasing raw material costs
• Weather sensitive categories
Pet Food • Promotional calendar changes
• Pack size shifts
• Consumers up-trading or down-trading within a category
Canned Veg • Supply and demand
© 2020 Information Resources Inc. (IRI). Confidential and Proprietary. 24Steps to Maintaining Price Discipline in a Recession
How do
Should price What is the manufacturers
be cut? path forward? and retailers
partner together?
• Unnecessary price cuts can • Focus on total value, whether • Quantify the value gains and
have disastrous effects during a recession or expansion potential losses for
both partners from
• Broad price cuts will lower • Shopper needs may change, but unnecessary price cuts
margins and erode price equity price will not become the sole
in the short term driver of decisions • Investigate non-price financial
incentives
• When the recovery comes, • Tailor the value equation by
manufacturers that took price knowing what products are not • Pair the financial benefits with a
cuts may see their brands truly price sensitive, and the positive impact on the most
relegated to second tier status tradeoffs shoppers will make valuable shoppers
among those that are
https://www.iriworldwide.com/IRI/media/Library/IRI-TL-Recession-Series-Part-2-Maintaining-Pricing-Discipline-
© 2020 Information Resources Inc. (IRI). Confidential and Proprietary. 25
5-7-2020.pdfSA Grocery sales have increased by ~7% during lockdown, consumer behavior has changed
rapidly as we head into uncertain times. Demand forecasting will therefore be impacted
Evolving IRI Demand Forecasting Solutions for COVID-19
Traditional sales forecasting models need to be adapted and updated regularly to accurately take into account the
COVID-19 effect and changing consumption patterns. IRI has developed a Machine Learning based algorithm that re-
evaluates the assessment of each factor and enables more accurate estimations of probable changes in COVID-19 wear
out effect on sales patterns, as well as the potential effect of a second wave
Two potential short-term consumption scenarios would lead to key Model outcome and basic scenario
differences in implications for Food & Beverage brands and retailers
weekly_Incidents Value Forecasting
4 000 If COVID-19 outburst stops here:
Thousands
1 Virus Effectively Contained 2 Two Virus Spikes in 2020
3 500 • Category will eventually decline by -13.6% in rest
3 000 of 2020 vs 2019
2 500 • Total 2020 vs 2019 will be negative by -1.7%
CPG Consumption –
Monthly YoY Growth 2 000
(Conceptual)
1 500
1 000
Scenario 1: Infection and death rates Scenario 2: Covid-19 incidence rates 500
slow significantly from July through slow before another virus breakout in 0
Sept and remain low through 2020 Q4 as illness rates spike again
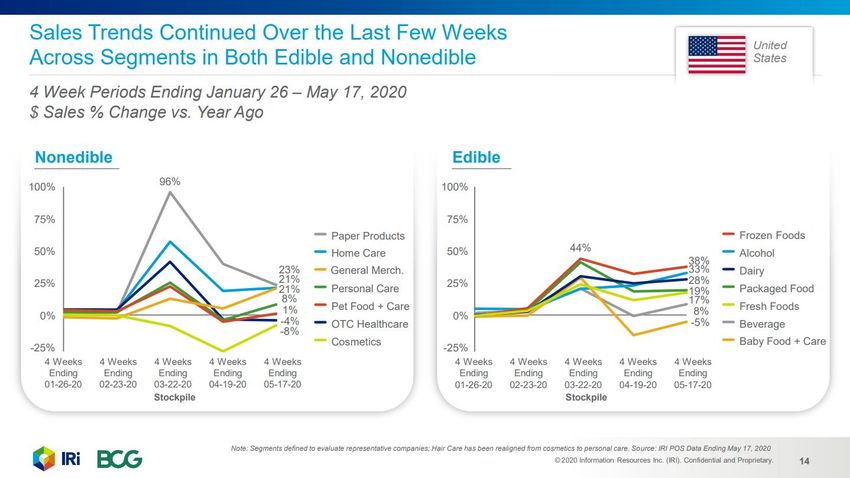
Contact us for more information © 2020 Information Resources Inc. (IRI). Confidential and Proprietary. 26COVID-19 Category Impacts Growths from around the Globe Global data up to 05 June 2020
IRI and BCG Share the Latest Global Purchase Trends Amid COVID-19

IRI is continuing to collaborate with our partners at the Boston Consulting Group (BCG) to analyze the latest
consumer purchase trends in Italy, France, Germany, Netherlands, New Zealand, Spain, U.K. and U.S. We just
updated the report, “Consumer Spending Tracker: COVID-19 Impact,” to capture the most recent insights.
Key highlights from the research include:
• As more countries in Europe and the United States begin to loosen COVID-19 restrictions, consumer spend patterns remain mostly
  unchanged – this is reflected in consumer purchases in France, Germany, Greece, Italy, Netherlands, New Zealand, Spain, UK and the U.S.
• In most geographies, sales remain elevated for edible categories, while demand for nonedible products vary across countries, e.g., growth for
  paper products remains high in the U.S., but less so elsewhere, while Beauty is strong in Netherlands and New Zealand, but declining in
  other countries.
• E-commerce continues to show strong growth over the last year in the U.S., Italy, France and Spain. After share shifted more to e-commerce
  in the initial stages of the pandemic, it has remained at a steady elevated level.
• In the U.S., consumers continue to make larger more pantry stocking trips than a year ago. At the same time, consumers have relaxed trip
  frequency slightly, starting to return to small trips vs. prior weeks of the pandemic.
• Loosened restrictions in some areas are having very marginal impact. New Zealand exhibits a softer growth level of ~10% (vs. 20%) following
  wider reopening measures. Meanwhile, U.S. states that reopened earlier have marginally softer trends in non-beverage edible categories
  than the rest of the U.S.

                                                                                               © 2020 Information Resources Inc. (IRI). Confidential and Proprietary.   28
© 2020 Information Resources Inc. (IRI). Confidential and Proprietary. 29
17
29© 2020 Information Resources Inc. (IRI). Confidential and Proprietary. 30
1830© 2020 Information Resources Inc. (IRI). Confidential and Proprietary. 31
1931© 2020 Information Resources Inc. (IRI). Confidential and Proprietary. 32
2032© 2020 Information Resources Inc. (IRI). Confidential and Proprietary. 33
2133© 2020 Information Resources Inc. (IRI). Confidential and Proprietary. 34
2334© 2020 Information Resources Inc. (IRI). Confidential and Proprietary. 35
2435© 2020 Information Resources Inc. (IRI). Confidential and Proprietary. 36
2536Insights and Strategic
Guidance for Better Decisions
IRI’s Online Resources Include Real-Time
Updates and Weekly Reports Which Track
the Impact of the Virus on CPG and Retail
The IRI COVID-19 Info Portal
Includes COVID-19 impact analyses, dashboards
and the latest thought leadership on supply chain,
consumer behavior, channel shifts for the U.S.
AND international markets
The COVID-19 Dashboard and
The IRI CPG Demand Index™
Accessible through the insights portal
and tracks the daily impact of COVID-19.
This includes the new IRI CPG Demand
Index™, top selling and out of stock
categories across countries, and
consumer sentiment on social media.
© 2020 Information Resources Inc. (IRI). Confidential and Proprietary. 37CONTACT US IRI South Africa
Level 1, Block D, Aintree Park
FOR MORE Doncaster Road, Kenilworth
Cape Town, 7708
INFORMATION +27 21 700 7420
Follow IRI on Twitter: @IRIworldwide
© 2020 Information Resources Inc. (IRI).
© 2020 Information Resources Inc. (IRI). Confidential
Confidential and
and Proprietary.
Proprietary. 38 38You can also read