NAVIGATING THE TRANSFORMATION - The Value of the Commissary Shopper May 17, 2018 Presented by Paul Lainis

Page created by Tracy Vaughn
 
CONTINUE READING
NAVIGATING THE TRANSFORMATION - The Value of the Commissary Shopper May 17, 2018 Presented by Paul Lainis
The Value of the Commissary Shopper

NAVIGATING THE
TRANSFORMATION

May 17, 2018
Presented by Paul Lainis
EVP, Consumer & Shopper Marketing
NAVIGATING THE TRANSFORMATION - The Value of the Commissary Shopper May 17, 2018 Presented by Paul Lainis
Executive Summary

       • Economy is solid; CPG is struggling

       • Competitive landscape is undergoing a
         massive evolution

       • To win, move quickly and deliberately

                                  © 2018 Information Resources Inc. (IRI). Confidential and Proprietary.   2
NAVIGATING THE TRANSFORMATION - The Value of the Commissary Shopper May 17, 2018 Presented by Paul Lainis
The U.S. Economy Is on a Positive Trajectory

                                                                          Retail Sales
    Economic             Inflation
    Growth
                        2.2%
                        Sep. 2017

    3.0%                                                                       +4.4%
                                                                                  Sep. 2017
     Q3 2017

                                                                 Unemployment Rate

    Avg. Price
    per Gallon                                                                                4.1%
                                                                                              Oct. 2017
    of Gas
                           Population
     $2.60                 326.2M Nov. 2017                       8.9%
        Oct. 2017
                                                                   Oct. 2017
                           0.7%      Annual Growth                                    Underemployed

                                                                                                    Source: U.S. Census Bureau.

                                                     © 2018 Information Resources Inc. (IRI). Confidential and Proprietary.       3
NAVIGATING THE TRANSFORMATION - The Value of the Commissary Shopper May 17, 2018 Presented by Paul Lainis
Projections for the Remainder of the Year are Strong

              Economic              Inflation
              Growth
                                    2.8%
                                    CY 2018P

              5.2%
              CY 2018P

                                    Unemployment Rate
                    Retail Sales

                                                         3.8%
                         +4.8%                            CY 2018P

                         CY 2018P

                                                                                                           Source: Moody’s

                                               © 2018 Information Resources Inc. (IRI). Confidential and Proprietary.    4
NAVIGATING THE TRANSFORMATION - The Value of the Commissary Shopper May 17, 2018 Presented by Paul Lainis
Still, Industry Growth Has Been Lackluster, Particularly During the Past
 Year
Total CPG—Dollar and Unit Sales Trend
CY 2013 – CY 2016

                                                                                         +0.8%

                                                                         $755.2                               $760.9
           Dollar Sales ($B)

                                                                                                                                                                Price/Unit
                                                                                                                                                                 Growth
                                                                        2016                                    2017
                                                                                                                                                                 +1.0%
                                                                                          -0.2%
           Unit Sales (B)

                                                                          238.1                                237.6

                                                                         2016                                   2017

 Source: IRI CSIA, All Outlets, CY 2013 – CY 2016, 52 weeks ending Nov. 05, 2017 vs. YA, NBD aligned.

                                                                                                        © 2018 Information Resources Inc. (IRI). Confidential and Proprietary.   5
NAVIGATING THE TRANSFORMATION - The Value of the Commissary Shopper May 17, 2018 Presented by Paul Lainis
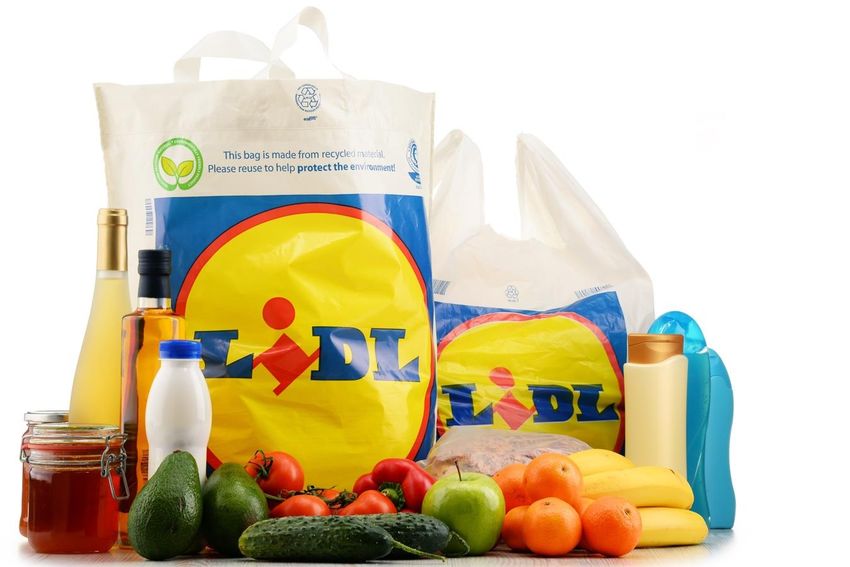
CPG Industry Growth Is Weak; Price Is Driving Dollar Growth

           Monthly Dollar Sales Change                                                Monthly Unit Sales Change
                   Total CPG*                                                                Total CPG*

                                      4.2%
                                                                                                                     3.2%
                                                          3.5%                                                                                  2.9%
             2.9%

                                               2.0%
                    1.8%
                              1.7%
   1.5%                                                                             1.2%
                                                              0.9%                                                                0.9%
                                                                                                          0.5%
                                                                                              0.1%

      0.0%                                                              0.0%
                       -0.2%                          -0.2%
                                         -0.4%                                                                                                         -0.5%
                                                                             -1.0%                  -1.1%

                                                                                                                                           -2.2%
                                                                                                                          -2.4%

    Jan.               Feb.                  Mar.         Apr.               Jan.                   Feb.                     Mar.               Apr.

                    2016       2017          2018                                             2016           2017            2018

                                                                     Source: IRI Market Advantage™, Jan.–April. 2018 and same periods prior two years; MULO-C
                                                                                                                 Total CPG does not include random weight data

                                                                              © 2018 Information Resources Inc. (IRI). Confidential and Proprietary.     6
NAVIGATING THE TRANSFORMATION - The Value of the Commissary Shopper May 17, 2018 Presented by Paul Lainis
DeCA’s Pricing Power Also Limited To Cover Unit Declines

            Monthly Dollar Sales Change                                                     Monthly Unit Sales Change
                    Total CPG*                                                                     Total CPG*

                    -3.5%           -3.5%
                                                                                                                          -4.4%
                                                     -4.2%                                          -4.9%

                        -5.4%           -5.3%-5.3%                                                        -6.1%                                  -6.3%
  -6.1%                                                        -6.1%          -7.2%
                            -6.6%                        -6.8%                                                                         -7.6%
                                                                                                                                -8.6%                 -8.5% -8.5%

            -8.4%                                                                                               -9.9%
                                                                                   -10.2%
      -9.5%

     Jan.              Feb.                 Mar.        Apr.                       Jan.                   Feb.                     Mar.               Apr.
                                                                                         -12.7%

                    2016        2017        2018                                                    2016           2017            2018

                                                             Source: IRI Market Advantage™, Jan.–April. 2018 and same periods prior two years; DeCA ConUS (ex AK/HI
                                                                                                                     Total CPG does not include random weight data)

                                                                                    © 2018 Information Resources Inc. (IRI). Confidential and Proprietary.    7
NAVIGATING THE TRANSFORMATION - The Value of the Commissary Shopper May 17, 2018 Presented by Paul Lainis
DeCA Captures 21% of Shoppers’ Spending; Share Is Down >1 Point
Versus Year Ago

             Share of Shopper Wallet                              Point Change vs. Year Ago
                 by Channel, 2018

                                                          -1.4
              18%            21%
                                                                                                            0.1

       13%
                                                                                                                  0.3

                             27%
              21%                                                                                                         0.6

                                                                                                                    0.4

                           Military   Grocery   Walmart    Club         All Other

                                                                                    Source: IRI CSIA, Data Ending Apr 22, 2018, NBD aligned

                                                          © 2018 Information Resources Inc. (IRI). Confidential and Proprietary.   8
NAVIGATING THE TRANSFORMATION - The Value of the Commissary Shopper May 17, 2018 Presented by Paul Lainis
Shoppers have steadily increased trips to Club and Dollar, while
decreasing trips to Drug and Mass

                                                      Total CPG—Trips by Channel
                                                              Retailer Trips per Shopper

                                                                                                                                       % Chg.
               Channels                          Retailer Trips per Shopper                      % Chg. vs. YA
                                                                                                                                 (CY 2017 – CY 2014)

   Grocery                                                                      54.7                    0.8%                                 -2.3%

   Club                                           12.4                                                  1.5%                                 2.4%

   Drug                                          11.0                                                   -2.9%                               -15.4%

   Mass/Supercenter                             8.7                                                     -3.0%                               -12.0%

   Dollar                                         13.5                                                  2.0%                                 0.8%

   Health/Vitamin                         3.1                                                           1.8%                                 -0.1%

   Military                                            16.9                                             -0.7%                               -11.9%

Notes: Walmart not included in grocery or mass/super.
Source: IRI CSIA, All Outlets, CY 2014 – CY 2017, 52 weeks ending Apr. 22, 2018 vs. YA

                                                                                         © 2018 Information Resources Inc. (IRI). Confidential and Proprietary.   9
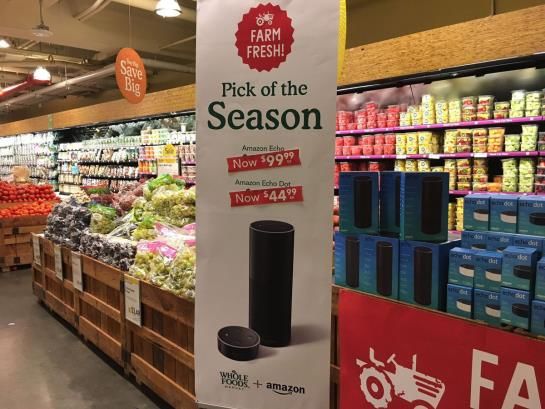
NAVIGATING THE TRANSFORMATION - The Value of the Commissary Shopper May 17, 2018 Presented by Paul Lainis
BIG SHIFTS UNDERWAY
IN THE RETAIL
MARKETPLACE

                      © 2018 Information Resources Inc. (IRI). Confidential and Proprietary.   10
The U.S. Online Grocery Market is on Track to Reach $34.7B
by 2022…

          Grocery E-Commerce Market $M                                     Grocery E-Commerce Market Share %

                                          $34,705
                                                                                                                     2.0%

                     $15,136                                                                 1.0%

                              2017       2022                                                        2017        2022

        • During the next five years, grocery e-commerce is expected to grow to $34.7B.
        • This represents CAGR growth of 18.1 percent when compared to CAGR of 3.6 percent for the overall CPG market
          during the same period.

Source: IGD Retail Analysis—Grocery E-commerce in the USA.

                                                                            © 2018 Information Resources Inc. (IRI). Confidential and Proprietary.   11
Driven by A Number of Factors
                                   Rapid Rollout of Store Pickup
                                   • Stores as convenient collection points
                                        –Kroger—ClickList at 650 Kroger locations; testing home delivery in
                                         Cincinnati (The Grocery Runners)
                                        –Walmart—optimizing more than 4,000 stores for e-commerce pickup; more
                                         than 1,000 stores added already, with 300-400 more planned yearly for the
                                         next five years
                                   Meal Delivery Services
                                   • Meal kit delivery services are growing at a rapid pace.
                                   • Pure play, such as Blue Apron, Hello Fresh and Plated
                                   • Grocers entering a new sector: Walmart and Kroger are testing a curb-side
                                     pickup service from eMeals

                                  Third Party Partnerships
                                  • Instacart—with Whole Foods, Wegmans and Aldi
                                  • Postmates—with 7-Eleven
                                  • Shipt—with Costco, Target, Kroger, Publix and Meijer
                                  • Uber—with Walmart

Source: IGD Retail Analysis—Grocery E-commerce in the USA; Wall Street Journal.

                                                                                  © 2018 Information Resources Inc. (IRI). Confidential and Proprietary.   12
How Important is Online Ordering?
55% of Millennials and 45% of Gen X’ers Say They
Intend to Purchase Groceries Online in the Coming Year

                         Likelihood of Purchasing Groceries Online in the Coming Year
                                              % of Respondents

                                18%                  20%
         31%                                                                     34%
                                                                                                                     46%
                                27%
                                                     35%
         29%
                                                                                 31%
                                27%                                                                                  21%
         20%                                         27%                                                             12%
                                            55%                    45%           17%

         21%                    28%                                                                                  22%
                                                     18%                         18%

       Total U.S.            Millennials           Gen Xers                   Boomers                              Seniors

           Very likely           Somewhat likely           Not very likely                        Not at all likely

                                                                                                                   Source: Consumer Connect™, Q4 2017

                                                                 © 2018 Information Resources Inc. (IRI). Confidential and Proprietary.     13
Many, Especially Younger Shoppers, Feel Shopping Online Saves Money
and Offers Convenience
Gen X’ers and Millennials also cited reduced impulse buying and ease of finding needed items.

                                  Online Shopping Value Perceptions by Generation (Top 2 Boxes)

       Online order/in-store                                                                                              55%
     pickup (click-and-collect)                                                                                     52%
      allows me convenience
                                                                                     36%
    without the added shipping
                 fee                                            25%

                                                                         30%
    Buying online allows me to                                    26%
    find lower-priced food and
                                                       18%
         beverage options
                                               11%

                                   Millennials       Gen Xers               Boomers                     Seniors

                                                                                                               Source: Consumer Connect™, Q4 2017

                                                             © 2018 Information Resources Inc. (IRI). Confidential and Proprietary.     14
© 2018 Information Resources Inc. (IRI). Confidential and Proprietary.   15
Accelerating Innovation in Order and Delivery Options…

            Albertsons announces new Digital Marketplace providing for consumer-direct ordering and shipping
            Albertsons Companies 03/20/2018
            Albertsons Companies and Instacart to bring same-day grocery delivery to 1,800-plus stores
            Progressive Grocer 11/28/2017

            Amazon and Whole Foods Market announce the introduction of free two-hour delivery through Prime Now
            Amazon Company Release 2/8/2018

            Prime Now delivery makes Whole Foods competitive on price with Kroger in Cincinnati
            Fooddive.com 3/29/2018

            Walmart plans to expand its popular Online Grocery Delivery option to more than 40% of U.S. households
            Walmart Release 3/14/2018

            Kroger Announces 1,000th ClickList Store and Introduces Seamless Digital Shopping Experience
            Kroger Company Release 12/18/2017

                                                                 …These are Just a few Examples.

                                                                 © 2018 Information Resources Inc. (IRI). Confidential and Proprietary.   16
The Brick-and-Mortar World Is Being Heavily Impacted by Market Entries
and Acquisitions

         Southeastern Grocers         Dollar General plans to                                       Sam’s Club announces
         files for bankruptcy,        open 900 new stores,                                          closing of 63
         announces closing of 94      remodel 1,000 existing sites                                  warehouses across the
         stores SEG Release           and relocate 100 stores                                       US. Walmart Release
         03/15/2018                   Chain Store Age 12/7/2017                                     1/11/2018

                                      The Kroger Co. agrees to                                      Bodega Latina Corp will
         Albertsons Companies
                                      sell its 700+ store c-store                                   acquire Fiesta Mart’s 63
         announces a merger
                                      business                                                      Hispanic-themed stores.
         agreement with Rite Aid.
                                      Progressive Grocer                                            Progressive Grocer
         Albertsons Release 2/20/18
                                      2/05/2018                                                     3/26/2018

                                                  © 2018 Information Resources Inc. (IRI). Confidential and Proprietary.   17
Activity by Three Major Players Is Really Turning Heads

            Lidl                     Amazon-Whole Foods                                        Aldi

                   Value and Private Brands at the core of retail changes
                     Polar ends of the value spectrum outperforming
                                middle-of-the-road peers*

                                                                                                                         *Source: Deloitte

                                                    © 2018 Information Resources Inc. (IRI). Confidential and Proprietary.      18
Lidl’s U.S. Entry Is Resonating with Some Customers, But Not with All

                                            Initially some good news…
                                            •     20% are shifting much more of their
                                                  shopping over to Lidl stores
                                            •     Half said their experience was better
                                                  than expected
                                            •     58% said they definitely will visit Lidl
                                                  again in the future

                                            But sales are soft…
                                            •     16% said Lidl was worse than expected
                                            •     Repurchase intent dropped by more
                                                  than half (from 44% to 21%)
                                                  from fall opening to March, 2018

                                           © 2018 Information Resources Inc. (IRI). Confidential and Proprietary.   19
Lidl’s Market Entry has had Mixed Results

Shoppers are the big winners…
                                                       Pricing Impacts of Lidl Store Openings
• Competition has intensified
• Prices have fallen                            Aldi
                                            Food Lion
                                                               Kroger
                                                                               Grocery
The U.S. Market Has Challenged Lidl                                           Channel
                                                                              All Outlets

• Aggressive expectations have not been met                                                        Publix
                                                                                                        Walmart
• Future rollout plans have been tempered
                                              -15.0%                  -10.0%                       -5.0%                          0.0%

Recommendations for Competitors
                                                                                                                * IRI POS Price comparison
                                                                                **UNC Lidl Price Survey, stores within 1.7 miles of Lidl store

• Personalization is key!
• Focus on variety, freshness and quality

                                                © 2018 Information Resources Inc. (IRI). Confidential and Proprietary.             20
ALDI Growing Quickly by Offering Value
With 1,600 Stores Today and Adding 900 More by 2022
Aldi Could be the Third-Largest Grocery Chain

                                                                                                    Selection of

      93%                   61%                       FRESH
                                                      PRODUCE
                                                                                                    Store Brand
                                                                                                    products &
       said that            good/affordable
       pricing/value        price is what they
                                                      (77%) was the                                 Unique
       drove them                                     top product                                   products offered are
                            liked about ALDI
       to ALDI                                        purchased                                     liked at ALDI over
                                                                                                    other retailers

                   Half Said Their experience Was Better Than Expected
                     1/3 Shifting Much More of Their Shopping to Aldi

                                                         © 2018 Information Resources Inc. (IRI). Confidential and Proprietary.   21
Aldi’s Expansion Quietly Continues, and Shoppers are Very Aware
                                                         Aldi’s prices are lower than
   Shoppers will be the big winners here as well!        many competitors’
                                                                                                                     Ralphs
  • 60% to 70% of markets experienced price                                                                      Vons
                                                                                                              Meijer
    declines when Aldi opened                                                                            Food Lion

  • Impacts are small, but broad                                                                         Albertsons
                                                                                                     Publix

  • Savings opportunities abound                                        Walmart
                                                                                         Kroger

                                                          -5%        0%         5%         10%        15%         20%        25%
                                                                Price per Volume Comparison, Edibles Categories, IRI Consumer Network

  What to do?

  • Know your own customers—identify and
    meet their needs
  • Clean up your own house
  • Focus on strengths
  • Monitor and respond
                                                                                       (Nancy Luna, Orange County Register/SCNG)

                                                    © 2018 Information Resources Inc. (IRI). Confidential and Proprietary.        22
Amazon Announces Their Purchase
of Whole Foods in June 2017

           In February 2005,
   Amazon launched Amazon Prime,
  an all-you-can-eat express shipping
   membership program for about a
            million products.
    Our vision was that fast delivery
  should be an everyday experience—
       rather than an occasional
    indulgence, and many skeptics
        thought we were crazy.
           — amazon.com website

                                        © 2018 Information Resources Inc. (IRI). Confidential and Proprietary.   23
Whole Foods Shoppers Expect Better Price and Delivery Options
Expected Shopping Benefits of Merger

                           Better prices                         59%

                   Better sales/coupons           38%

               Amazon Prime discounts             38%

Whole Foods' brands sold and shipped at
                                             32%
             Amazon.com

                 Amazon Prime delivery      29%

           More frequent sales/coupons     29%

        Whole Foods selling products on
                                           27%
                Amazon.com                                                                 Only 18% of WF shoppers are
         More Amazon Prime-only offers     26%
                                                                                           aware of Amazon/WF benefits
                                                                                                                                        Whole Foods Amazon Study, March 2018
                                                        Q4. In which of the following ways, if any, do you expect to benefit as a shopper to Amazon's purchase of Whole Foods?

                                                                              © 2018 Information Resources Inc. (IRI). Confidential and Proprietary.              24
Benefitting From a Number of Key Attitudinal Shifts

                                                                               Less Retailer
                             Brand Agnostic                                       Loyalty
                               Consumers                                       For most food
                              moving toward                                     categories,
                             whatever meets                                   less than 1/3 of
                               their needs                                  shoppers are loyal                    Less Channel
        Less Brand                            “People around                to a specific chain                       Loyalty
            Trust                                the world
                                                                                                                  Shopping more
    42% of Americans                          wouldn’t care if
                                                                                                                channels today than
      find brands and                                 74%                                                           3 years ago
      companies less                             of brands                                                        9.3 vs 8.2
    truthful today than                        disappeared.”                                                     channels            in 2014
        20 years ago                          -Havas Meaningful Brands
                                                 Global Study 2017
                                                                                                                  in 2017
      -McCann, Truth About
         America 2017

                                                                                                               Daymon Worldwide, 2017–2018 Global TrendWheel

                                                                         © 2018 Information Resources Inc. (IRI). Confidential and Proprietary.    25
Understanding Key Drivers of Behaviors Is Critical

                                                               .
       Transparent &                    Always On                         Personal                                 Value Is King
          Simple                   • 77% of Americans own a        • Want brands that align                  • 45% of grocery shoppers
    • 94% of consumers say           smart phone                     with their belief systems                 say they are visiting
      they would be loyal          • Any time, any place -         • Only 49% of consumer                      value-oriented stores
      to a brand that offers         convenience as the new          say their main grocery                    more often
      complete transparency          loyalty.                        store connects with them                • 70% of consumers say
    • 54% of consumers look        • They research, explore          in a relevant way.                        technology has made it
      for food/beverages with a      compare and share.            • 69% of engaged U.S.                       easier than ever to take
      short list of recognizable                                     shoppers want to be able                  their business
                                   • 70% of consumers trust
      ingredients                                                    to give feedback to help                  elsewhere.
                                     online suggestions more
                                     than brand statements.          improve the experience.

                                                                           © 2018 Information Resources Inc. (IRI). Confidential and Proprietary.   26
RETAILER RESPONSE

                    © 2018 Information Resources Inc. (IRI). Confidential and Proprietary.   27
LESSON #1: Move Into the Fast Lane

   Enhance capabilities to gain a deep understanding
    of key customers and work to meet those needs
    better and faster!

   Tap into critical touchpoints along the shopper
    journey to strengthen brand equity and enhance
    brand image.                                                        Create
   Form retailer-supplier collaborative relationships to             Experiences!
    optimize campaigns throughout flight.

   Measure — in real time! — the impact of all
    interactions along the shopper journey and track
    consumer behavior change.

                                                  © 2018 Information Resources Inc. (IRI). Confidential and Proprietary.   28
LESSON #2: Winning Is All About Personalization

The kaleidoscope of
demographic changes and
income bifurcation and
technology in the US is
driving the atomization of
American lives, how they
plan and consume.

              Atomization of Personalization

                                          © 2018 Information Resources Inc. (IRI). Confidential and Proprietary.   29
Personalize the Experience for Each Shopper and Across the Entire
Shopper Journey

         Know What Key and Target Shoppers Seek

         Engage Shoppers When, Where and How it Matters
         Most to Them

         Deliver Against Needs and Wants at the Right Time,
         through the Right Channel and at the Right Price

                                          © 2018 Information Resources Inc. (IRI). Confidential and Proprietary.   30
Invest in Specialty Departments and Programs to Minimize Trips to Quick/
Limited Service and Specialty Shops and Enhance Military Community Feel

                                          © 2018 Information Resources Inc. (IRI). Confidential and Proprietary.   31
Identify Priority Stores to Target Expansion of Ethnic/International Foods

                                       Select Dallas Stores                    ASIAN HH INDEX              HISPANIC HH INDEX

                                                    Store #1                           223                         129

                                                    Store #2                           265                         123

                                                    Store #3                           261                         131

      15%
   of Stores in this Dallas RMA have
    an above average concentration
                                                    Store #4

                                                    Store #5
                                                                                       141                         116

        of Hispanic & Asian HHs
                                                                                       119                         222

                                                              © 2018 Information Resources Inc. (IRI). Confidential and Proprietary.   32
LESSON #3: Embrace Social Media

                                  MILLENNIALS

      1                     $240B
      3
                               by
                             2022
                                    © 2018 Information Resources Inc. (IRI). Confidential and Proprietary.   33
Create 1:1 Relationships Through Personalized Campaigns Leveraging
Digital Platforms

   STARBUCKS       CVS PHARMACY APP     WALMART APP                                     KROGER APP
MOBILE COMMERCE

                                        © 2018 Information Resources Inc. (IRI). Confidential and Proprietary.   34
User-Generated Content Is a Trusted Source of Information

   47%               of millennials trust
                     user-generated content

                     Source: http://www.adweek.com/brand-marketing/infographic-how-millennials-and-baby-boomers-consume-user-generated-content-175307/

                                                            © 2018 Information Resources Inc. (IRI). Confidential and Proprietary.         35
User-Generated Content Is a Trusted Source of Information

           47% trust content
            vs.
                created by brands
           25%

                     Source: http://www.adweek.com/brand-marketing/infographic-how-millennials-and-baby-boomers-consume-user-generated-content-175307/

                                                            © 2018 Information Resources Inc. (IRI). Confidential and Proprietary.         36
Tap Into Instagram to Drive Imagery Through Pictures

  of millennials rate Instagram
   as their preferred platform
                      Source: http://www.adweek.com/brand-marketing/infographic-how-millennials-and-baby-boomers-consume-user-generated-content-175307/

                                                             © 2018 Information Resources Inc. (IRI). Confidential and Proprietary.         37
Competitive Landscape Is Changing: To Win, Move Quickly And
Deliberately

         • Get into the fast lane

         • Personalize the shopper experience

         • Embrace social media

                                        © 2018 Information Resources Inc. (IRI). Confidential and Proprietary.   38
QUESTIONS
 & NEXT STEPS

Paul Lainis                    Christine Roussey
Executive Vice President       Principal, Retail Client Solutions
Consumer & Shopper Marketing   Military
Paul.Lainis@IRIworldwide.com   Christine.Roussey@IRIworldwide.com

                                     © 2018 Information Resources Inc. (IRI). Confidential and Proprietary.   39
THANK
            YOU!

For More Information, Contact Us…
           IRI Global Headquarters
150 North Clinton Street, Chicago, IL 60661-1416
             IRI@IRIworldwide.com
                +1 312.726.1221
     Follow us on Twitter: @IRIworldwide

                               © 2018 Information Resources Inc. (IRI). Confidential and Proprietary.   40
You can also read