August 2017 POWERING THE FUTURE OF THE CONNECTED WORLD - Q3 2017 Investor Presentation - Switch
←
→
Page content transcription
If your browser does not render page correctly, please read the page content below
August 2017

POWERING THE FUTURE OF THE CONNECTED WORLD®
                Investor Presentation
                      Q3 2017
                                        ®
SAFE HARBOR                                                                                                                                       2018
This presentation includes forward-looking statements. All statements contained in this presentation other than statements of historical facts, including
statements regarding future results of operations and financial position of Switch, Inc. and Switch, Ltd. (“Switch,” “we,” “us” or “our”), our business
strategy and plans and our objectives for future operations, are forward-looking statements. The words “anticipate,” believe,” “continue,” “estimate,”
“expect,” “intend,” “may,” “will” and similar expressions are intended to identify forward-looking statements. We have based these forward-looking
statements largely on our current expectations and projections about future events and financial trends that we believe may affect our financial
condition, results of operations, business strategy, short-term and long-term business operations and objectives, and financial needs. These forward-
looking statements are subject to a number of risks, uncertainties and assumptions, including, without limitation, those risks and uncertainties set forth in
the “Risk Factors” section of our most recent Quarterly Report on Form 10-Q filed with the Securities and Exchange Commission for the quarter ended
September 30, 2017.

Although we believe that the expectations reflected in the forward-looking statements are reasonable, we cannot guarantee future results, levels of
activity, performance, achievements or events and circumstances reflected in the forward-looking statements will occur. We are under no duty to
update any of these forward-looking statements after the date of this presentation to conform these statements to actual results or revised
expectations, except as required by law. You should, therefore, not rely on these forward-looking statements as representing our views as of any date
subsequent to the date of this presentation. Moreover, except as required by law, neither we nor any other person assumes responsibility for the
accuracy and completeness of the forward-looking statements contained in this presentation.

This presentation also contains estimates and other statistical data made by independent parties and by us relating to market size and growth and
other data about our industry. This data involves a number of assumptions and limitations, and you are cautioned not to give undue weight to such
estimates. Neither we nor any other person makes any representation as to the accuracy or completeness of such data or undertakes any obligation to
update such data after the date of this presentation. In addition, projections, assumptions and estimates of our future performance and the future
performance of the markets in which we operate are necessarily subject to a high degree of uncertainty and risk.

This presentation contains certain supplemental financial measures that are not calculated pursuant to U.S. generally accepted accounting principles
(“GAAP”). These non-GAAP measures are in addition to, and not a substitute or superior to, measures of financial performance prepared in
accordance with GAAP. A reconciliation of non-GAAP measures to GAAP measures is contained in the appendix to this presentation.

                                                                                                                                                                2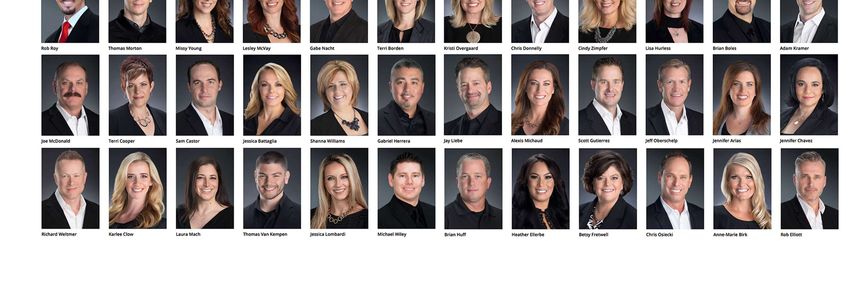
Switch IS A TECHNOLOGY INFRASTRUCTURE COMPANY
POWERING THE SUSTAINABLE GROWTH OF THE CONNECTED WORLD

                                                         3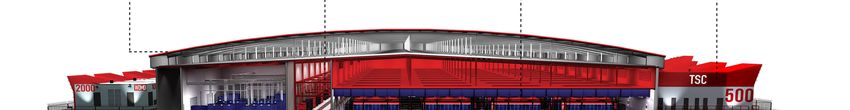
INVESTMENT HIGHLIGHTS
Large and Expanding Market
Purpose-built, Highly Resilient and Power Dense Patented Solutions Driving Low Cost of Ownership
Hyperscale Infrastructure in Strategic Locations
Lowest Churn Rates of Publicly Reporting Data Center Companies
Attractive Financial Profile
Visionary and Experienced Leadership Team
4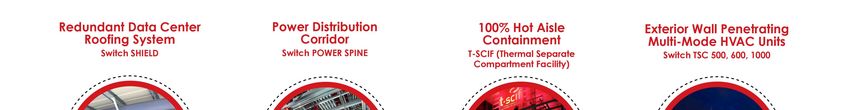
Switch COMPANY SNAPSHOT

                                                     The Four                                     Up to 12 million                                       Up to 1,185
                                                 Switch PRIMESTM                                   Gross square feet (GSF)                         Megawatts of power (MW)
                                             3 Campus Locations Operational
                                                                                                 Current U.S. facilities: 4M GSF                  Current U.S. facilities: 415 MW
                  Facilities                    and 1 Under Development
                                                                                                 Future U.S. facilities: 8M GSF                   Future U.S. facilities: 770 MW

                                                               800+                                             38%                                              0.3%
                                                                                                     Of revenues from top 10                              Revenue Churn (1)
                                                             Customers
                                                                                                      customers Q3’17 YTD                                      Q3’17

            Customer Base

                                                              19.2%                                            42.3%                                           20.3%
                                                                                                      Adjusted EBITDA Growth                            Cash flow yield on
                                                          Revenue Growth
                                                                                                          Q3’16 to Q3’17                                  invested capital
                                                           Q3’16 to Q3’17
                                                                                                                                                  (Last 4 quarters as of Q3’17)(3)
            Financial Profile

1. Churn is defined as a reduction in recurring revenue attributed to customer terminations or non-renewal of expired contracts, as a percentage of revenue at the beginning of the period. Customers that either changed names but are still active
customers or have become part of another active customer are excluded.
2. See Appendix for a reconciliation of Adjusted EBITDA to Net Income.
3. Cash flow yield on invested capital is defined as Adjusted EBITDA less corporate taxes and maintenance capital expenditures, divided by total assets, less cash and equivalents, construction in progress, and non-interest-bearing liabilities.
                                                                                                                                                                                                                                                       5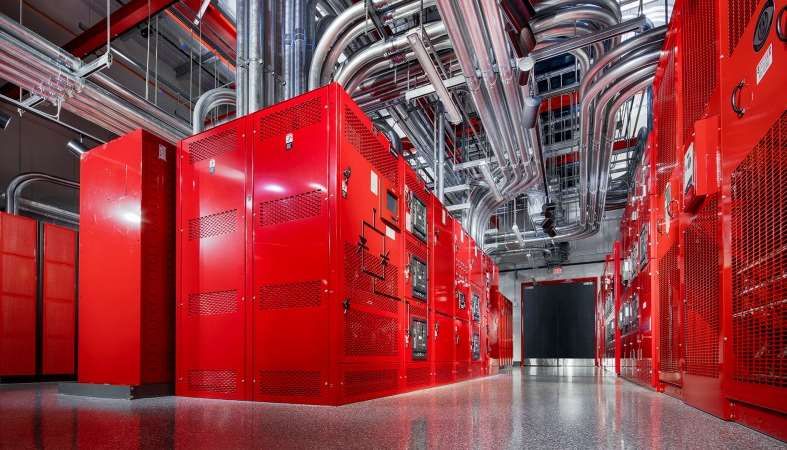
STRATEGICALLY LOCATED PRIME CAMPUSES
The Citadel Campus
(Reno)
Designed to be, upon
completion, world’s largest data The Pyramid Campus
center environment (Grand Rapids)
Designed to be the largest
TAHOE RENO 1 - Up to a 1.3mm datacenter campus
sq. ft. and 130 MW power in the Eastern U.S.
capacity
Over 1,100,000 sq. ft. and 110
TAHOE RENO 1-7 over 5,000,000 MW power capacity
sq. ft. and 520 MW Silicon New York
Valley Tahoe Reno Low natural disaster rating
Stable climate with low-humidity Grand Rapids Ashburn
Tax Renaissance zone
Low tax environment
Los Angeles 100% renewable power source
100% renewable power source Las Vegas
Atlanta
The Core Campus The Keep Campus
(Las Vegas) (Atlanta)
2,340,000 sq. ft. and 315 MW
Land acquired
power capacity
Miami Campus data center designs
Stable climate with low-humidity
currently in process
Lowest natural disaster rating
Over 1,100,000 sq. ft. and 110
in Western U.S.
MW power capacity
Low tax environment
Construction began Q4 2017
100% renewable power source
6
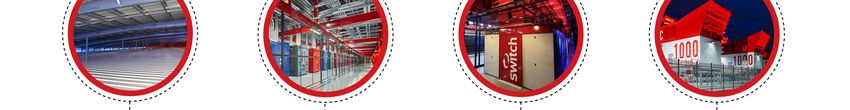
GROWING PORTFOLIO OF HYPERSCALE FACILITIES
                                                                                                                                                                           Utilization % -
                                                                           Year                       Gross Square Feet                      Utilization % -                                                  Power Capacity
                               Campus(1)                                                                                                                                 By Available Data
                                                                         Operational                      (up to)(2)                         By Campus(3)                                                        (up to)(4)
                                                                                                                                                                          Center Space(3)
             The Core Campus
                Current: 8 Facilities(5)                                   2003-2017                          2,000,000                               83%                            94%                              275 MW
                Future: 1 Facility                                           2018                              340,000                                                                                                40 MW

             The Citadel Campus
                Current: TAHOE RENO 1                                           2016                          1,360,000                               15%                            61%                              130 MW
                Future: 7 Facilities                                           2019+                          5,890,000                                                                                               520 MW

             The Pyramid Campus
               Current: Switch PYRAMID                                          2016                   430,000 (Office)
                                                                                                                                                      23%                            46%                               10 MW
                                                                                                    220,000 (Data Center)
                                                                                                                                                                                                                      100 MW
                  Future: 2 Facilities                                         2019+                       940,000

             The Keep Campus
                Future                                                          2019                          1,100,000                               N/A                            N/A                              110 MW

             U.S. Total (Current)                                                                           4,010,000 ft                                                                                             415 MW
             U.S. Total (Future)                                                                            8,270,000 ft                                                                                             770 MW

 1. SUPERNAP International has also deployed two additional data centers in Milan, Italy and Bangkok, Thailand that collectively provide up to 904,200 GSF of space, with up to 100 MW of power available to these facilities. We hold a 50% ownership interest in
 SUPERNAP International
 2. Estimated square footage of all enclosed space at full build out
 3. Utilization numbers are based on available cabinets
 4. Defined as total power delivered to the data center at full build out
 5. Current facilities at The Core Campus include LAS VEGAS 2, LAS VEGAS 4, LAS VEGAS 5, LAS VEGAS 7, LAS VEGAS 8, LAS VEGAS 9, LAS VEGAS 10 and LAS VEGAS 12                                                                                                        7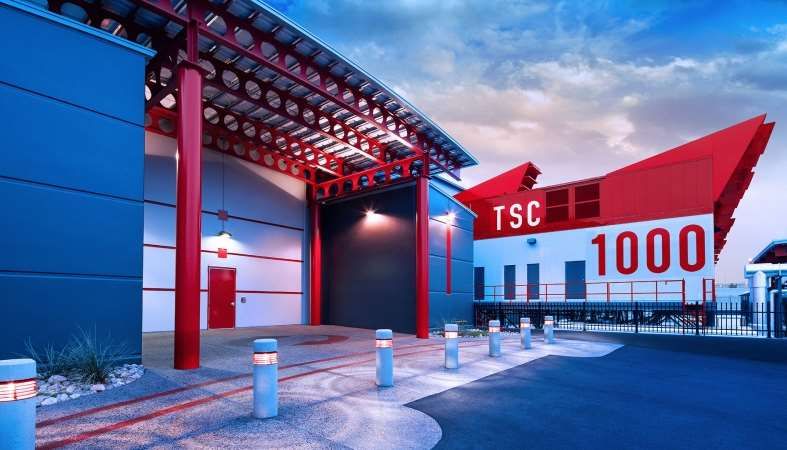
MULTIPLE DRIVERS OF FUTURE PROFITABLE GROWTH

1      Continue to Grow Existing Switch PRIMETM Campus Locations

2      Leverage Our Technology Ecosystem to Drive Interconnection Growth

3      Maintain and Extend Our Technology Leadership

4      Pursue Strategic Partnerships

6                                                                          8
UNDERSCORED BY GROWTH OF THE CLOUD
…and the Remaining Technology Solutions will be
Enterprises will Continue to Migrate to the Cloud…
the Most Important, Mission Critical Data Sets
This mission-critical data will
require Tier 5® Platinum
Switch believes that over time,
resiliency and
a large portion of technology security
workloads could run in the cloud
Why Switch Wins:
But Cloud has Some Limitations:
Not ideal for critical data storage and computing Tier 5 resiliency with 100% uptime across facilities
Large workloads can be expensive Superior density and useable power capacity
Not compliant with sensitive or regulated data Proprietary designs and Switch CORE lowers customer
®
net costs
Not efficient with analytics and machine learning Powered by 100% renewable energy
algorithms
Reduces customer technology buying power Increased purchasing power of purchasing cooperative
9
LARGE MARKET OPPORTUNITY
                           Large TAM                                                                         Rapid Growth                                                              Under-Penetrated

 Global Data Center Colocation Spending(1)                                                             Global Internet Traffic(2)                                      Installed Data Center Capacity Mix(3)
(US$ billions)                                                                       (zettabytes)

                                                           47                                                                    15                                                    Service Provider Data Centers
                                                                                                                                                                                       Internal Data Centers

                   30                                                                                                                                                             13 %
                                                                                                                                                                                                              28 %

                                                                                                         5
                                                                                                                                                                                  87 %
                                                                                                                                                                                                              72 %

                 2016                                    2020                                         2015                      2020                                              2016                        2019

                  200 billion “smart” devices                                                                                                       3 GB data created
                           By 2020, representing a 68%                                                                           Per person per day, today. Growing by
                                CAGR from 2015(4)                                                                                     38% per year through 2020(5)

1. 451 Research’s Datacenter KnowledgeBase, 2016                                                                           4. Intel, A Guide to the Internet of Things (Infographic)
2. Cisco Visual Networking Index June 2016                                                                                 5. Technavio, Global Data Center Market 2016-2020
3. IDC, Worldwide Datacenter Installation Census and Construction Forecast, 2017-2021, Doc #US41985317, Mar 2017.
Capacity measured in millions of square feet                                                                                                                                                                           10
COMPELLING FINANCIAL MODEL
Customers increasing spend (revenue from customers that were new to Switch in 2012 increased at
Track Record of Organic a 25% CAGR between 2013 and 2016)
Top-Line Growth
Monetizing cross connects
Long term licenses (3 to 5 year contracts) with ability to escalate rates
Predictable and Recurring
Stable monthly recurring revenue per cabinet
Revenue Stream
3-year average annual revenue churn of 1.4%
Patent-protected technology enables just-in-time capex deployment and low cost construction
Capital Efficient Growth Vertical integration creates additional capex savings
Low maintenance capex – 1.6% of revenue in 2016
Begin construction in new markets once an anchor tenant has been identified
Low Capital at Risk
Switch MOD® enables the company to build and open new sectors to meet customer demand
Future Growth and Margin
Driving scale provides efficiencies and margin expansion
Expansion Drivers
11HISTORY OF PROFITABLE, ORGANIC GROWTH (IN $ MILLIONS)
Revenue Adjusted EBITDA(1)
$318 $153
$142 $144
$279
$266
$236 $112 $112
$207 $95
$167
2013A 2014A 2015A 2016A YTD Q3 '16 YTD Q3 '17 2013A 2014A 2015A 2016A YTD Q3 '16 YTD Q3 '17
2016 Adj. EBITDA includes front loaded costs to open Citadel and Pyramid campuses.
1. See Appendix for a reconciliation of Adjusted EBITDA to Net Income. 12800+ CUSTOMERS IN A DIVERSE SET OF INDUSTRIES
Digital Retail &
Cloud, IT, & Finance & Network & Hospitality & Government
Content & Consumer Healthcare
Software Banking Telecom Gaming & Utilities
Media Goods
Select Customers by Industry
13LOWER COST OF OWNERSHIP FOR CUSTOMERS
Data centers Strategically
located
Lower cost of
designed for Switch CORE ®
efficiency Switch PRIMES TM ownership
More power and
more gear per rack
Favorable Tax Policies Aggregates
buying power
customers’
Customers’ gear can
Low cost of power Can significantly lower
run better and last Low risk of natural customers’
longer disaster connectivity costs
No need for redundant
data centers
14PREDICTABLE AND EFFICIENT CAPITAL EXPENDITURES
Switch’s patent-protected technology enables low cost of production and just-in-time
Modularly deployment of power and cooling
Optimized
Design Switch POWER SPINETM allows for increased modularity by ensuring an independent
power supply for each sector
Switch’s critical infrastructure components are purpose-built to satisfy customers’ needs
Scalable and drive efficiency
Production
Model Vertical integration and repeatable design allows for faster deployment and operational
efficiencies
Capital 20%+ cash flow yield on invested capital
Efficient
Growth Switch’s designs result in lower maintenance capex – 1.6% of revenue in 2016
15KEY REVENUE GROWTH AND MARGIN EXPANSION DRIVERS
Growth of Switch PRIMETM Campus Ecosystems
Revenue
Growth Expansion of Sales Channels
Drivers
Monetization of Existing Assets
Stabilized Direct Labor
Margin
Expansion Lower and Stable Power Costs
Drivers
SG&A Growth Will Moderatel Moderate
16FINANCIAL TARGET MODEL (IN $ MILLIONS)
Metric 2015 2016 Long Range Target
Gross Profit as a % of Revenue 47.0% 47.0% 47%
1
SG&A as a % of Revenue 17.0% 30.9% 21%
1
Net Income as a % of Revenue 27.6% 9.9% 20%
2
Adj. EBITDA as a % of Revenue 54.0% 48.1% 51%
Maintenance CapEx as a % of
3.4% 1.4% 2%
Revenue
1 2016 SG&A and Net Income contain one-time payment of $27 million to exit the fully bundled sales system of NV Energy, a Nevada public utility company
2 Please see the Appendix for the annual Adj. EBITDA reconciliation 17OUR DISTINCTIVE COMPETITIVE MOAT
The Switch Difference Barriers to Entry for Competitors Barriers to Exit for Customers
Patent-protected technology Lower total cost of ownership
Ability to Support Density Ability to support increasingly dense gear More gear, shorter cable, lower latency
deployments Optimal temperature extends life of gear
Superior capital efficiency Can increase densities as needs evolve
Modularly Optimized Design
Ability to pre-sell data center space Can increase space in future without issue
Hard-to-replicate operational protocols, physical 100% uptime across all facilities since founding
Tier 5® Platinum Facilities and cyber security Risk sensitive customers such as regulated entities
Can’t retrofit facilities to a Tier 5 standard need resiliency
Significant increase in connectivity costs if leave
Combined Ordering Retail Carrier’s drawn to single deployment to reach very CORE
Ecosystem (Switch CORE®) large customer base
All customers have access to Switch CORE
Larger regulated customers bring partner Abundance of cloud and managed services
Customer & Cloud Ecosystem ecosystems to cross-connect in a secure and providers
resilient environment Unique cross-connect partnerships
Powered by 100% renewable energy – ahead of
Environmental No additional expense to customers to lower carbon
Digital Realty (21%), Equinix (20%), Dupont Fabros
Sustainability footprint
(7%) (1)
18
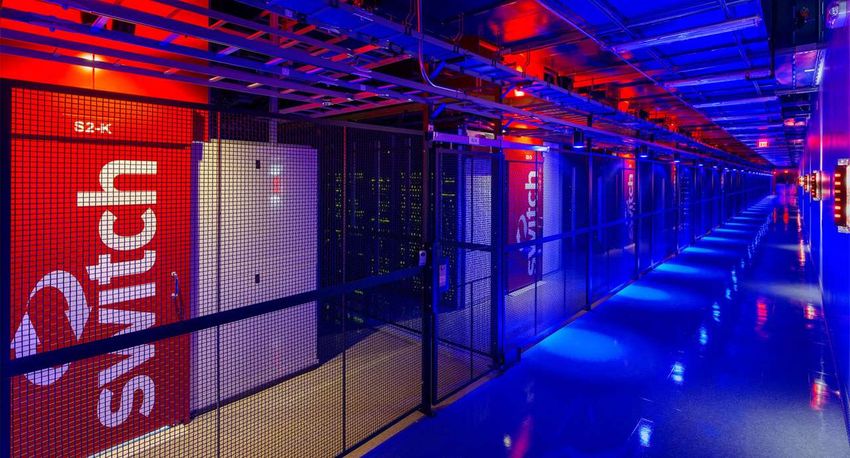
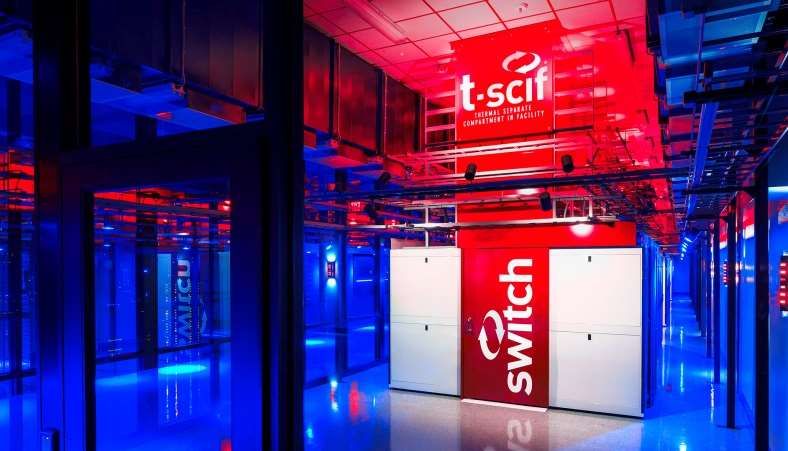
1. Greenpeace Clicking Clean Report 2017INNOVATIVE, PATENT-PROTECTED TECHNOLOGY
™ ™ Switch T-SCIF™ (Thermal Separate Switch TSC™ 500, 600, 100
Compartment Facility)
400+ ISSUED AND PENDING PATENT CLAIMS
19LEADERSHIP TEAM 190+ YEARS AT Switch
20INVESTMENT HIGHLIGHTS
Large and Expanding Market
Purpose-built, Highly Resilient and Power Dense Patented Solutions Driving Low Cost of Ownership
Hyperscale Infrastructure in Strategic Locations
Lowest Churn Rates of Publicly Reporting Data Center Companies
Attractive Financial Profile
Visionary and Experienced Leadership Team
21You can also read