Designing for Visual Data Exploration in Multi-Device Environments
←
→
Page content transcription
If your browser does not render page correctly, please read the page content below
Designing for Visual Data
                  Exploration in Multi-Device
                  Environments
Tom Horak
Interactive Media Lab
Technische Universität Dresden
Dresden, Germany
horakt@acm.org

ABSTRACT
Multi-device environments have an enormous potential to enable more flexible workflows during our
daily work. At the same time, visual data exploration is characterized as a fragmented sensemaking
process requiring a high degree of flexibility. In my thesis, I am aiming to bring these two worlds into
symbiosis, specifically for sensemaking with multivariate data visualizations and graph visualizations.
This involves three main objectives: (i) understanding the devices’ roles in dynamic device ensembles
and their relations to exploration patterns, (ii) identifying mechanisms for adapting visualizations for
different devices while preserving a consistent perception and interaction, and, finally, (iii) supporting
users and developers in designing such distributed visualization interfaces, e.g., through specific
guidelines. As specific contributions, it is planned that (i) and (ii) emerge into a design space, while
(iii) leads to a set of heuristics. So far, I was able to extensively work on the first objective as well as to
touch on the other two.

Permission to make digital or hard copies of part or all of this work for personal or classroom use is granted without fee
provided that copies are not made or distributed for profit or commercial advantage and that copies bear this notice and the
full citation on the first page. Copyrights for third-party components of this work must be honored. For all other uses, contact
the owner/author(s).
CHI’19 Extended Abstracts, May 4–9, 2019, Glasgow, Scotland, UK
© 2019 Copyright held by the owner/author(s).
ACM ISBN 978-1-4503-5971-9/19/05.
https://doi.org/10.1145/3290607.3299086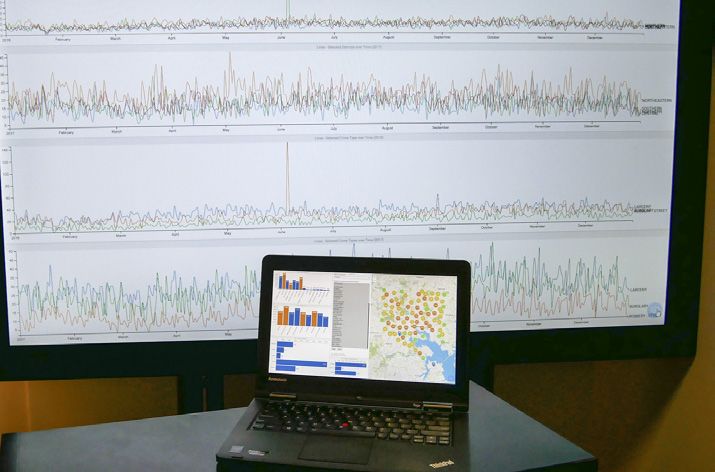
Designing for Visual Data Exploration in Multi-Device Environments                         CHI’19 Extended Abstracts, May 4–9, 2019, Glasgow, Scotland, UK

                                                        CCS CONCEPTS
                                                        • Human-centered computing → Visualization systems and tools; Visual analytics; Interactive
                                                        systems and tools; Ubiquitous and mobile devices;

                                                        KEYWORDS
                                                        Visual data analysis; cross-device interaction; mobile visualization
                                                        ACM Reference Format:
                                                        Tom Horak. 2019. Designing for Visual Data Exploration in Multi-Device Environments. In CHI Conference on
                                                        Human Factors in Computing Systems Extended Abstracts (CHI’19 Extended Abstracts), May 4–9, 2019, Glasgow,
                                                        Scotland, UK . ACM, New York, NY, USA, 6 pages. https://doi.org/10.1145/3290607.3299086

                                                        INTRODUCTION & BACKGROUND
                                                        In recent years, advances in hardware and interface design have spawned a multitude of devices
                                                        that are notably different to traditional desktops. This multitude enables more flexible workflows, as
                                                        users can easily choose a device—or a set of devices—that suits their current needs best. Although
                                                        data analysis and sensemaking are typically characterized by highly flexible workflows, current
                                                        practice rarely exploits the potential of the existing device multiplicity. Utilizing ad-hoc multi-device

                                                                                                                Objective 1
                                                                                    Dynamic               Device Ensembles for           Interactive
                                                                           Device Ensembles                                              Information Visualization
                                                                                                          Exploration Patterns

                                                                                                                Objective 2
                                                                                                            Visualization Consistency
                                                                                                                       across Devices

                                                                                                                                   Objective 3

                                                                                                  Visual Data Exploration
                                                                                                       Design Space & Heuristics
                                                                                        for Interactive Visualizations in Multi-Device Envrionments

                                                        Figure 1: In my thesis, I am aiming to investigate the interplay between dynamic device ensembles
                                                        and interactive information visualization to allow for a more flexible visual data exploration.
Designing for Visual Data Exploration in Multi-Device Environments                         CHI’19 Extended Abstracts, May 4–9, 2019, Glasgow, Scotland, UK

                                                        environments would allow for continuously working on a data exploration while also seamlessly
                                                        switching between different setups (Figure 2) and collaboration settings. For instance, consider a
                                                        data analyst of a business consultant company: the analyst wants to get a first look at updated data
                                                        during her commute (smartphone), then performs a more in-depth exploration in the office (desktop +
                                                        tablet), discusses the insights further with a colleague during a coffee break (tablet + smartphone),
                                                        continues the exploration while waiting at the airport (laptop + mobiles), and pitches the results to
                                                        her management in a meeting room (laptops, mobiles, and large display).
                                                           In such a scenario, multiple challenges arise. First of all, it must be possible to easily incorporate
                                                        multiple devices and exploit their respective strengths in the context of the data exploration. Similarly,
                                                        the used visualization components must be functional on all devices as well as provide a consistency in
                                                        respect to perception and interaction; this allows then users to seamlessly switch between devices while
                                                        continuously performing visualization-specific tasks. Although the vision of such flexible interfaces
                                                        already exists for a couple of years, e.g., as ubiquitous analytics [1] or information visualization beyond
                                                        mouse and keyboard [7], the research area of data exploration in multi-device environments (MDE) is
                                                        still under-explored. Based on cross-device considerations from general human-computer interaction
                                                        (HCI) research as well as the few research projects for visualizations beyond desktops, I aim to better
                                                        explore the underlying principles of interactive visualizations in MDEs.

                                                        RESEARCH OBJECTIVES
                                                        In a nutshell, in my thesis, I aim to answer three questions: (i) how can device combinations be utilized
                                                        for data exploration, (ii) how can visualizations by optimized for diverse devices, and (iii) how can
                                                        we automatize both the distribution and adaptation of visualizations across devices? Based on these
                                                        rather abstract questions, I formulate my research objectives as follows:

                                                                     Objective 1. Exploiting common device roles in multi-device ensembles to
                                                                     stimulate established visual data exploration patterns.
                                                           When considering common device ensembles, it is often possible to consider the devices’ character-
                                                        istics (e.g., personal v. shared, small v. big, mobile v. stationary) and distinguish different roles, such
Figure 2: In modern work environments,
                                                        as overview device, control device, or storage device. In visualization interfaces, specific multi-view
a broad range of different working situa-
                                                        patterns are prevalent, for instance, overview+detail, multiple coordinated views, or control panels.
tions with different device ensemble can
exists [5]. In these ensembles, devices take            The goal here is to identify how the device ensembles can be used to reinforce exploration patterns
on different roles and, hence, offer differ-            and, thus, are able to promote and simplify visual exploration practice. The methodology involves
ent affordances for a data exploration.                 a review of existing research as well as an iterative development of cross-device interface concepts
                                                        involving user elicitation and feedback sessions.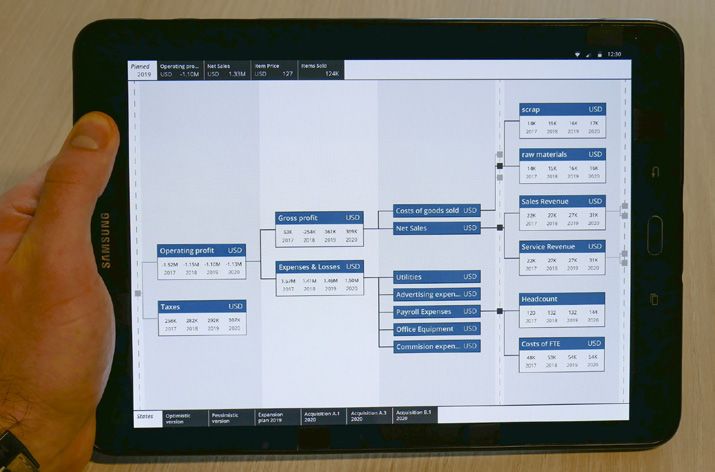
Designing for Visual Data Exploration in Multi-Device Environments CHI’19 Extended Abstracts, May 4–9, 2019, Glasgow, Scotland, UK
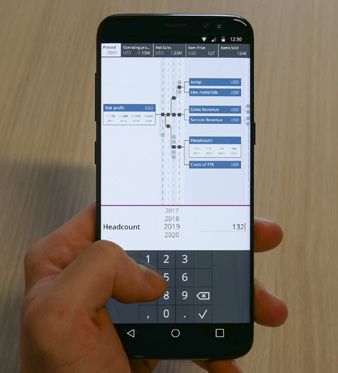
Mobile Devices
Objective 2. Preserving a consistent visualization character across devices.
The highly diverse device characteristics also result in the need to adapt visualizations for a device,
e.g., in respect to its available screen estate, aspect ratio, or input accuracy. However, the adaptation
should still maintain the visualization’s visual perception and interaction style in order to effectively
serve the current analysis goal. For instance, for comparing two bar charts on two different devices,
their appearance must still be similar in order to be able to draw any conclusions. Similarly, when
moving a view to a different device, maintaining the appearance helps the users to reorient themselves
and, thus, reduces the cost of device switches. In contrast to the notion of responsive design, the goal
is to provide a functional instance of the visualization while maintaining its visual identity as well
as interaction mechanisms. Similar to the first objective, the methodology is a mixture of literature
review (here, on scalable visualizations), own design explorations, and user evaluations.
Objective 3. Supporting users and developers in applying interactive visual-
ization interfaces in dynamic device environments.
Large Display + Smartwatch
Based on the first two objectives, the overall goal is to provide guidance to both analysts and
programmers on how to handle and design interactive visualizations in multi-device ensembles.
Specifically, I am planning to provide a set of heuristics, which are able to lead to useful visualization-
to-device mappings in the context of visual data exploration. These heuristics can be used in manifold
ways, e.g., for manually designing one specific setup, for proposing automatic distribution algorithms,
or for fostering future research on the advantages of multi-display environments in general. All in all,
this leads to a conceptual framework consisting of a design space (abstraction of objective 1 and 2),
the heuristics, and a set of example implementations.
COMPLETED AND FUTURE RESEARCH
While the first objective was investigated by looking in two paradigmatic device ensembles, the two
other objectives are currently addressed by on-going research.
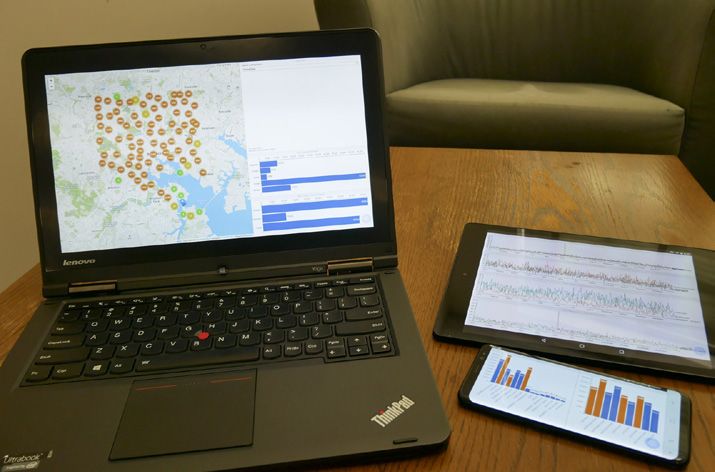
The Roles of Mobile Devices. Besides first general considerations [4], I was able to complete two
full-sized research projects. In Vistiles [6], we focused on the combination of multiple mobile devices,
especially with respect to physical ad-hoc arrangements and how these help users during the explo-
Figure 3: Depending on the device ensem-
ration (Figure 3). We found that mobile devices can form a valid exploration setup on their own as well
ble (see VisTiles [6] and David meets Go-
liath [2]), different device roles can be ap-
as enable a more physical and intuitive exploration style, similar to the way we perform sensemaking
plied, e.g., personal (remote) control, dis- tasks with paper printouts. The second paradigmatic ensemble was explored in When David meets
play extension, mutual synchronization. Goliath [2]. Here, the high-contrast combination of a smartwatch with a large display revealed how a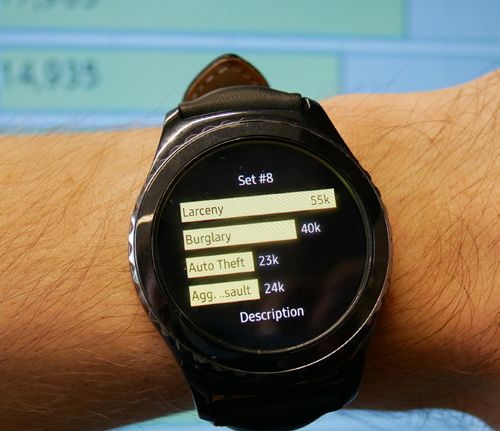
Designing for Visual Data Exploration in Multi-Device Environments                                            CHI’19 Extended Abstracts, May 4–9, 2019, Glasgow, Scotland, UK

Simplified Representations                    Set #1          Set #2       smartwatch can take on the role of a highly personal and unobtrusive toolbox (Figure 3). Specifically,
                                                                           the smartwatch is an always-reachable controller that can mediate the primary interaction happening
                                            Crime Time       Crime Type
                                                                           on the large display. This way, users can save (and carry) selections, access preferred settings, or
                                            9:00 - 15:00     CA, LFA, RS
                                                                           trigger functionalities from both close-proximity and distance—and all without interfering with other
                                                                           users interacting at the same time.
                          Set #1              Set #2
                                             Set #13          Set #9          Recently, we also ran a user elicitation study where participants had to distribute visualizations
                                                                           across a given device setup [5]. Although we did not explicitly ask participants to consider device roles,
                        Crime Time         A
                                             Crime
                                               B  C
                                                    Type
                                                      D  E

                        9:00 - 15:00         CA,Dimension
                                           Axis  LFA, RS
                                                             Encoding      we found that they are actively considering such roles. So far, the user study featured a pre-defined
                                               District       YlGnBu
                                                                           setups; it would be interesting to observe interaction patterns when participants can freely choose from
Flexible Level-of-Details
                    Set #13                   Set #9
                                                                           a multitude of devices. However, this requires a stable interface that allows for a flexible and simple
                                                                           view distribution without requiring too much user effort. By working on the automatic distribution
                    A     B   C

                    Axis Dimension
                                  D    E

                                             Encoding
                                                                           system for Objective 3, the first step towards such an interface was already made.
                       District               YlGnBu

                                                                              Content-aware Scaling of Visualizations. As the considered devices are highly diverse regarding
                                                                           their display size and resolution, visualizations must be adapted in order to maintain readability and
                                                                           functionality. As changing the appearance or interaction style of visualizations can temper the way
                                                                           they are perceived, a certain level of consistency should be guaranteed when displaying them on
                                                                           different devices. In When David meets Goliath [2], for selections, we used simplified representations of
                                                                           the origin, i.e., the chart where these selections were created (Figure 4). In the context of an automated
                                                                           view distribution (see last paragraph), we constrained the scaling of visualizations to a minimal
                                                                           alteration of the aspect ratio.
                                                                              However, as this approach has clear limits, I also started to work on a more comprehensive explo-
                                                                           ration for the scaling. Specifically, I focus on a flexible adaptation of hierarchical graph visualizations
                                                                           through a lane-based approach [3]. By considering lanes for the graph layout, an additional dimension
                                                                           is provided, which allows for reducing details while still maintaining the overall appearance (Figure 4).
                                                                           However, these concepts must still be developed further and tested. Further, I plan to summarize the
                                                                           insights from the aforementioned projects and derive a generalized overview on how to apply these
                                                                           concepts to other visualization techniques.
                                                                              Heuristics for an Automatic View Distribution. As a result of the two previous investigations, I aim
                                                                           to provide a comprehensive design space representing all relevant properties and relationships of
                                                                           visualizations as well as devices. This design space can then be used to derive heuristics describing
                                                                           the specific interplay of the prevalent dimensions and how these inform the design of distributed
Figure 4: When visualizations must be
                                                                           visualization interfaces. Within an upcoming full-paper (conditionally accepted) [5], a first version of
scaled for displaying them on different de-
vices, the goal is to maintain a consistent
                                                                           the design space and heuristics as well as a web-based example implementation for an automatic
appearance [2, 3].                                                         distribution of given views across connected devices were created. For the remaining time of my
                                                                           PhD, the goal is to extend and improve the framework further by incorporating new insights from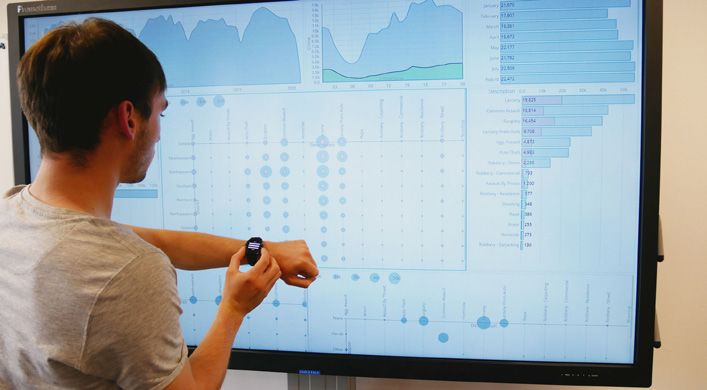
Designing for Visual Data Exploration in Multi-Device Environments                              CHI’19 Extended Abstracts, May 4–9, 2019, Glasgow, Scotland, UK

                                                        Objective 2 as well as properly evaluate it by applying it to other setups and application examples.
                                                        This also involves an ongoing development of the current prototypes.

                                                        ACKNOWLEDGMENTS
                                                        I would like to thank my supervisor Professor Raimund Dachselt for his mentorship to date. This
                                                        work was supported by the DFG grant DA 1319/3-3 (GEMS 2.0).

                                                        REFERENCES
                                                        [1] Niklas Elmqvist and Pourang Irani. 2013. Ubiquitous Analytics: Interacting with Big Data Anywhere, Anytime. IEEE
                                                            Computer 46, 4 (apr 2013), 86–89. https://doi.org/10.1109/mc.2013.147
                                                        [2] Tom Horak, Sriram Karthik Badam, Niklas Elmqvist, and Raimund Dachselt. 2018. When David Meets Goliath: Combining
                                                            Smartwatches with a Large Vertical Display for Visual Data Exploration. In Proceedings of the ACM Conference on Human
                                                            Factors in Computing Systems. ACM, New York, NY, USA, 19:1–19:13. https://doi.org/10.1145/3173574.3173593
                                                        [3] Tom Horak and Raimund Dachselt. 2018. Hierarchical Graphs on Mobile Devices: A Lane-based Approach. In Proceedings
                                                            of the CHI 2018 Workshop on Data Visualization on Mobile Devices (MobileVis ’18). 7.
                                                        [4] Tom Horak, Ulrike Kister, and Raimund Dachselt. 2016. Presenting Business Data: Challenges During Board Meetings in
                                                            Multi-Display Environments. In Proceedings of the ACM Conference on Interactive Surfaces and Spaces (ISS ’16). ACM, New
                                                            York, NY, USA, 319–324. https://doi.org/10.1145/2992154.2996774
                                                        [5] Tom Horak, Andreas Mathisen, Clemens N. Klokmose, Raimund Dachselt, and Niklas Elmqvist. 2019. Vistribute: Distributing
                                                            Interactive Visualizations in Dynamic Multi-Device Setups. In Proceedings of the ACM Conference on Human Factors in
                                                            Computing Systems. ACM, New York, NY, USA. (conditionally accepted).
                                                        [6] Ricardo Langner, Tom Horak, and Raimund Dachselt. 2018. VisTiles: Coordinating and Combining Co-located Mobile
                                                            Devices for Visual Data Exploration. IEEE Transactions on Visualization and Computer Graphics 24, 1 (2018), 626–636.
                                                            https://doi.org/10.1109/tvcg.2017.2744019
                                                        [7] Bongshin Lee, Petra Isenberg, Nathalie Henry Riche, and Sheelagh Carpendale. 2012. Beyond Mouse and Keyboard:
                                                            Expanding Design Considerations for Information Visualization Interactions. IEEE Transactions on Visualization and
                                                            Computer Graphics 18, 12 (Dec. 2012), 2689–2698. https://doi.org/10.1109/tvcg.2012.204

                                                        My complete publication list is available at tom-horak.de/publications.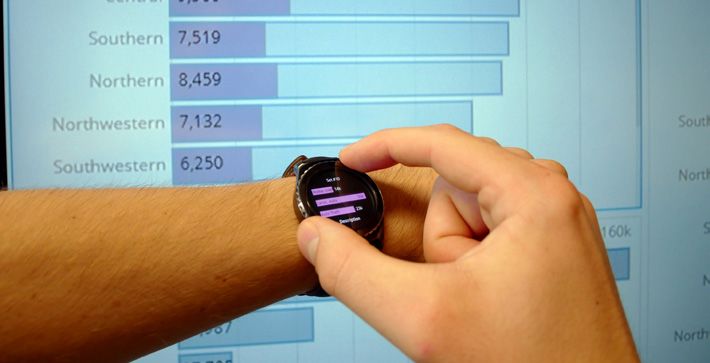


You can also read