Current Patterns on East Season in The Northern Waters of The Sunda Strait - E-Journal UNDIP
←
→
Page content transcription
If your browser does not render page correctly, please read the page content below
Indonesian Journal of Oceanography [February] [2020] Vol 02 No: 01 ISSN:2714-8726

 Current Patterns on East Season in The Northern Waters of The Sunda Strait

 Ridho L Tondang1*, Kunarso1, Jarot Marwoto1, Heryoso Setiyono1, Hariyadi1
 1
 Oceanography Department, Faculty of Fisheries and Marine Science, Diponegoro University
 Prof. Sudarto St, SH Tembalang Phone. / Fax. (024)7474698 Semarang 50275
 Email: kunarsojpr@yahoo.com, jrt.marwoto@gmail.com,
 ridhotondang@student.undip.ac.id

 Abstract

The northern waters of Sunda Strait is the first Indonesian Archipelagic Sea Lanes. (ALKI I) which is an
important and a very crowded shipping lane. The first Indonesias Archipelagic Sea Lanes (ALKI 1) connects the
marine traffic from Africa, West Australia to South China Sea, Japan and the other way around. Indonesia in
determining the archipelagic sea lanes considers several criterias, one of them is the oceanographic condition
which is the ocean currents. The purpose of this research is to examine the characteristic of the ocean current
pattern in the northern waters of Sunda Strait. The stages of this research include the measurement of field data,
field data processing, and hydrodynamics modeling. The research location was determined by purposive
sampling method. The determination of the research location follows the path of bathymethry. The result of field
measurement is processed then used as data validation of current simulation result of hydrodinamic model. The
result of the hydrodynamics model simulation showing the direction of current in northern waters of Sunda
Strait moving back and forth following the tidal periods. The direction of the dominant current in northern
waters of Sunda Strait is to Northeast (flood current) and Southwest (ebb current). The current velocity in
northern waters of Sunda Strait is approximately between 0,0122 m/s and 2,590 m/s. The maximum velocity of
the current belongs to several observation points that located in the seabed. This is to be expected due to the
impact of Indonesia Through Flow.

Keywords: Characteristic of the ocean current pattern, Mounted ADCP Moving Vessel, Hydrodynamics
 modeling, Northern Waters of Sunda Strait

INTRODUCTION
 The Sunda Strait is a strait connecting the islands of Sumatra and Java Island, as well as
connecting between the Java Sea and the Indian Ocean. The Sunda Strait is the Indonesian
Archipelagic Sea Lane 1 (ALKI 1) which is an important and very crowded shipping lane. ALKI 1
connects maritime traffic from Africa, Western Australia to the South China Sea, Japan and vice versa.
Indonesia in determining archipelagic sea lanes consider several criterias, one of them is
oceanographic conditions (Buntoro, 2012).
 Knowledge of the characteristics of ocean currents is indispensable for navigation of shipping,
planning and development of coastal areas and the construction of coastal structures. Tidal currents are
very dominant in the process of circulating sea water in coastal waters. Tidal current is a phenomenon
of ups and downs of sea water along with horizontal movement of water that changes direction along
the rise and fall of sea water (Chatzirodou, 2017). O'Rourke (2010) opines that tidal currents are a
horizontal sea water movement that is influenced by tidal activity. The horizontal motion of sea water
mass caused by the phenomenon of the rise and fall of sea water which is called tidal current. The
tides arise due to the influence of the attraction of celestial bodies (especially the moon and sun)
towards the earth (Hadi, 2010).
 The currents that appear in the waters have different dynamics depending on the factors that
influence them. Thus, the current pattern may differ in different places. The limitations of measuring
instruments for measuring on large areas such as the Sunda Strait become a problem. Based on this
problem, flow modeling becomes an alternative choice to fulfill the information needs for long time
scales and large areas. The model is a picture that can represents the true state of event that actually
happen. Kowalik (2015) uses a high resolution numerical model to explain the uniqueness of tidal
currents occurring in the western waters of Fjord Svalbard. Numerical models are used not only to
present current conditions in the water, but can also describe the tidal, wave, sediment transport and
other conditions (Angeloudis, 2015). Field flow measurements were carried out to obtain the data used

http://ejournal2.undip.ac.id/index.php/ijoice/ Diterima/Received : 29-02-2020
 Disetujui/Accepted : 29-02-2020

Indonesian Journal of Oceanography [February] [2020] Vol 02 No: 01 ISSN:2714-8726

for the validation of current model simulation results, so that the model can be used as a reference to
describe the current conditions in the waters of the North Sunda Strait. The purpose of this study was
to examine the pattern of currents in East Season in the Northern waters of Sunda Strait. Map of
research location can be seen in Figure 1.

 Figure 1. Map of Research Location

METHODOLOGY
 The research materials used in this research are the main data and supporting data. The main
data was used in the form of current and tidal data. Supporting data was used in the form of tidal data
from forecasting result, wind and bathymetry maps. The measurement of field data is done from 27th
to 28th of August 2016. The method which was used in this research is field survey method and
numerical modeling. Field survey method is a method of taking data in the field directly. The method
of numerical modeling is a method that model the water's characteristics such as conditions in the
field, including pattern, velocity and direction of current. The data from field measurement are in the
form of current and tidal data. Purposive sampling method was used to detremine the location of
research, which based on certain consideration. Determining the location of observations based on
conditions can represent the overall condition and effectiveness in data retrieval. The determination of
the location of current observation follows the bathymetry sounding for the effectiveness of the motion
of the ship.

2.1 Tidal
 Tidal data for 29 days are processed using admiralty method to generate tidal component
values. The result of tidal component is used to determine the Formzal (F) number (Supangat and
Susanna, 2003), as follows:
 " $%
 F= # #
 &' $('
 (1)

2.2 Hydrodynamic Modeling
 The 3 dimensional model uses a sigma coordinate transformation approach (DHI Water and
Evirontment, 2012). The following is the continuity of the cartesian:
 )* )- )/
 + + =
 )+ ). )0
 (2)

The horizontal momentum equation for each of the x and y components is as follows:

http://ejournal2.undip.ac.id/index.php/ijoice/ Diterima/Received : 29-02-2020
 Disetujui/Accepted : 29-02-2020
Indonesian Journal of Oceanography [February] [2020] Vol 02 No: 01 ISSN:2714-8726

)* )*' 4-* 4/* )9 : );< = 9 ); ) )*
 + + + = − − − + + : + B
)3 )+ ). )0 ). ;< )+ ;< 0 )+ )0 )0
 (3)
)- )- ' 4-* 4/* )9 : );< = 9 ); ) )
 + + + = − − − + + : + B
)3 ). )+ )0 ). ;< ). ;< 0 ). )0 )0
 (4)

2.3 Model Validation
 The value of the feasibility of the model outcome for the Cost Function formula is "excellent"
for CF values 3
(George et , al., 2010). CF calculation as follows:
 : D EF G&F
 = JK:
 D HI
 (5)
 : D N
 E = JK: J −
 D
 (6)
Information:
N : number of observation data
N : value to n, with n = 1,2,3, ....
D : Observation value
M : model value
 E : standard deviation
D̅ : average observation data

RESULT AND DISCUSSION

3.1 Wind
 Wind rose shows the spread of direction and wind speed in the waters of the Northern Sunda
Strait. Wind direction distribution is divided into 8 sections ie north, northeast, east, southeast, south,
southwest, west, northwest. The direction of the dominant current is from the east with the occurrence
frequency of 28.92% and from the south-east with the occurrence frequency of 25, 30%. The dominant
wind speed is 2-3 m / s with an incident frequency of 32.93%. The frequency of wind distribution in
August is presented in Table 1.

 Figure 2. Wind Rose of the North Shore of the Sunda Strait in August 2016

http://ejournal2.undip.ac.id/index.php/ijoice/ Diterima/Received : 29-02-2020
 Disetujui/Accepted : 29-02-2020
Indonesian Journal of Oceanography [February] [2020] Vol 02 No: 01 ISSN:2714-8726

Table 1. Frequency of Wind Distribution
 0.1 - 0.5 - 1- 1.5 - 2-3 3-4 4-5 >= 5 Tota
No Arah 0.5 1 1.5 2 (m/s (m/s (m/s (m/s l
 (m/s) (m/s) (m/s) (m/s) ) ) ) ) (%)
 1 Utara
 0 0 0 0 0 0.42 0 0 0.40
 (337.5 ̊- 22.5 ̊)
 2 Timur Laut 16.0
 0 0.42 0.42 1.67 5 5.42 3.75 0
 (22.5 ̊-67.5 ̊) 6
 3 Timur 10.4 28.9
 0 0.83 3.33 3.33 6.25 5.83 0
 (67.5 ̊ - 112.5 ̊) 2 2
 4 Tenggara 25.3
 0 1.25 0.42 4.58 9.58 7.08 3.33 0
 (112.5 ̊ -157.5 ̊) 0
 5 Selatan 11.2
 0 0.42 1.67 2.5 4.17 2.5 0.42 0
 (157.5 ̊ - 202.5 ̊) 5
 6 Barat Daya 12.8
 0 0 0.83 3.75 4.58 3.75 0.42 0
 (202.5 ̊ -247 ̊) 5
 7 Barat
 0 0 0.42 0.42 0.42 0 0 0 1.20
 (247.5 ̊ - 292.5 ̊)
 8 Barat Laut
 0 0.42 0 0 0 0 0 0 0.40
 (292.5 ̊ -337.5 ̊)
 32.9 24.5 13.2 96.3
 0 3.21 6.83 15.66 0
 Sub-Total 3 0 5 9
 Calm 0
 Missing 3.61
 Total 100

3.2 Ocean Current
 Scatter Plot Arus
 1.5

 1.2

 0.9

 0.6
 East Velocity (m/s)

 0.3

 0
 -2 -1.6 -1.2 -0.8 -0.4 0 0.4 0.8 1.2 1.6 2
 -0.3

 -0.6

 -0.9

 -1.2

 -1.5
 North Velocity (m/s)

 a) b)
 Fig 3. a) Current Rose; b) Scatter Plot of the North Waters of the Sunda Strait

 The direction of dominant current in the waters of the Northern Sunda Strait is to the Southwest
and Northeast with the occurrence frequency of 30.62% and 25.62%. The dominant current velocity is
0.1-0.5 m / s with an incidence frequency of 63.12%. The scatter plot shows that the current is moving
in a varying direction. The pattern of eliphesis shows that the dominant direction of the current is
influenced by the presence of tides in the study area, the scatter plot describes the distribution of the
number of current directions in each quadrant. The frequency of current distribution is presented in
Table 2.

http://ejournal2.undip.ac.id/index.php/ijoice/ Diterima/Received : 29-02-2020
 Disetujui/Accepted : 29-02-2020

Indonesian Journal of Oceanography [February] [2020] Vol 02 No: 01 ISSN:2714-8726

Table 2. Distribution of Current Frequency
 0.01 - 0.05 - 0.1 - 0.5 - 1- 1.5 - 2-3 >= 3 Tota
No Arah 0.05 0.1 0.5 1 1.5 2 (m/s (m/s l
 (m/s) (m/s) (m/s) (m/s) (m/s) (m/s) ) ) (%)
 Utara 0 0.62 6.87 0 0 0 0 0 7.5
 1
 (337.5 ̊- 22.5 ̊)
 Timur Laut 25.6
 2 0 1.87 17.5 3.12 1.87 0.62 0.62 0
 (22.5 ̊ - 67.5 ̊) 2

 Timur 0 0.62 1.25 0 0 0 0 0 1.87
 3
 (67.5 ̊ - 112.5 ̊)
 Tenggara 0.62 1.87 1.87 0 0 0 0 0 4.37
 4
 (112.5 ̊- 157.5 ̊)
 Selatan 0 2.5 5 1.25 0 0 0 0 8.75
 5
 (157.5 ̊ -202.5 ̊)
 Barat Daya 30.6
 6 0.62 0.62 18.12 5.62 1.87 3.75 0 0
 (202.5 ̊ -247.5 ̊) 2

 Barat 1.87 0.62 9.37 3.12 0 0 0 0 15
 7
 (247.5 ̊ -292.5 ̊)
 Barat Laut 0.62 2.5 3.12 0 0 0 0 0 6.25
 8
 (292.5 ̊ -337.5 ̊)
 Sub-Total 3.75 11.25 63.12 13.12 3.7 4.37 0.62 0 100

 Calm 0
 Total 100

 a) b) c)

 d) e) f)
 Figure 4. Vector Plot Flow a) Station 1; b) Station 4; c) Station 7; d) Station 13; e) Station 18; f)
 Station 24

http://ejournal2.undip.ac.id/index.php/ijoice/ Diterima/Received : 29-02-2020
 Disetujui/Accepted : 29-02-2020
Indonesian Journal of Oceanography [February] [2020] Vol 02 No: 01 ISSN:2714-8726

 The straight line on the plot vector shows the dominant direction of the current of the research
area and the length of the line means the current velocity, the longer the line on the diagram the greater
the velocity of the current. Measurement of ocean currents on the date indicates that the direction of
the current is dominant to the Southwest and Northeast. The highest current velocity is at the bottom
of the waters, shown by 20 stations.

 Figure 5. Graph of Flow of Tides and Residues

 Based on field observation current analysis, graph of residual and elliptical currents is
generated. Figure 5 shows an observed field flow chart having a pattern and magnitude that follows
the tidal current. The type of dominant current generator in the north waters of the Sunda Strait is the
tidal current of 52%.

3.3 Tidal
 The tidal observation for 29 days obtained by tidal constant is shown in Tables 3 and 4.

 Table 3. Tidal Components Station Banten, Sunda Strait
 Component S0 M2 S2 N2 K1 O1 M4 MS4 K2 P1
 A (cm) 59 27 12 5 12 6 1 0 3 4
 Phase (o) 249 66 144 178 355 168 43 66 178

 Table 4. Value of Harmonic Constant Tidal Station Banten
 F (Formhzal) 0.442
 HHWL 116
 HWL 98
 semi diurnal
 LLWL 3
 LWL 20
 MSL 59

 Tidal type determinants in Sunda Strait waters is the value of Formhzal (F) = 0.442 so that the
Sunda Strait waters have double tangent mixed daily tidal type. Hadi (2010) describes this type in a
day occurs twice and twice ups. The graph is presented in Figure 6 below.

http://ejournal2.undip.ac.id/index.php/ijoice/ Diterima/Received : 29-02-2020
 Disetujui/Accepted : 29-02-2020

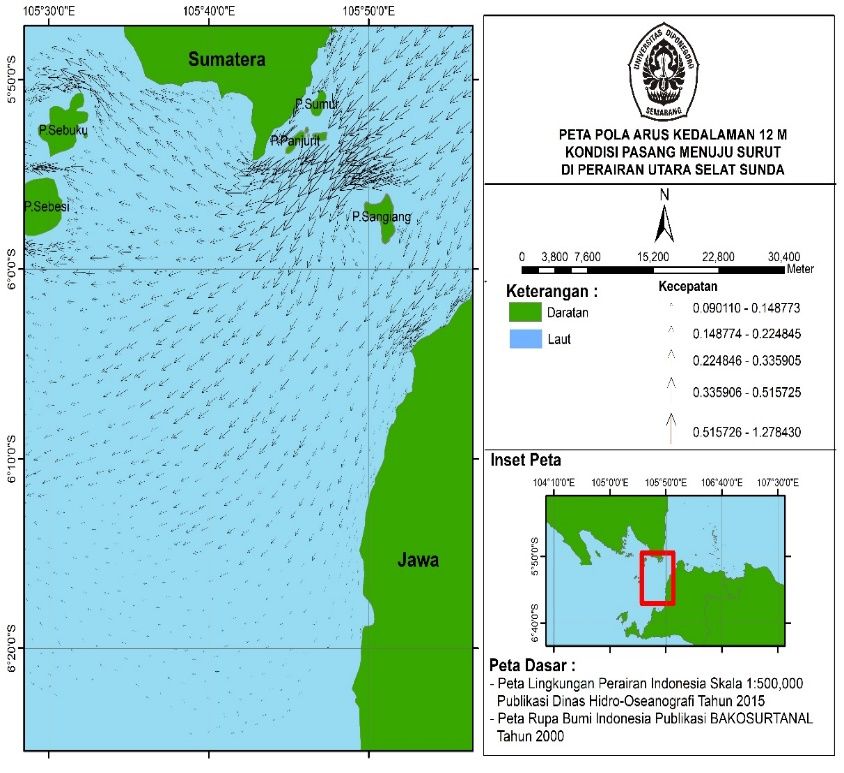
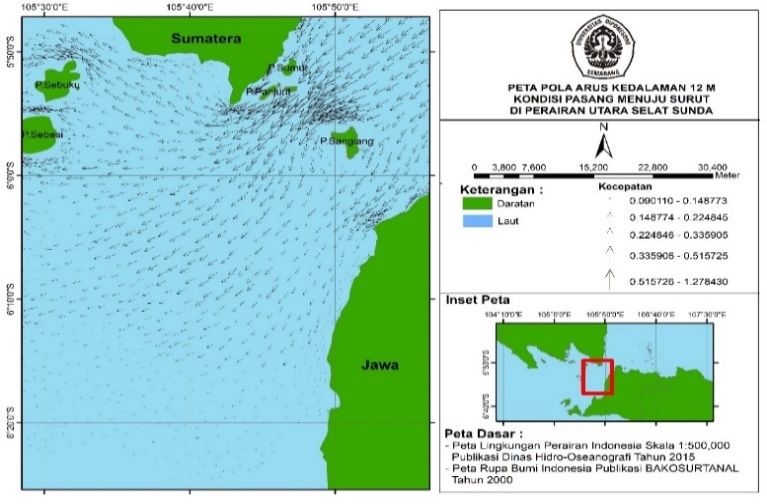
Indonesian Journal of Oceanography [February] [2020] Vol 02 No: 01 ISSN:2714-8726

 GRAFIK PASANG SURUT PERAIRAN UTARA SELAT SUNDA
 140

 120

 100

 Elevasi (cm) 80

 60

 40

 20

 0

 Tanggal/Waktu

 Elevasi (cm) HHWL LLWL MSL

 Figure 6. Tidal Elevation Charts 1-31 August 2016.

Field Data Flow Validation Results and Model Flow
 Validation is done by comparing the data of current model with current measurement data in
the field which is done based on same point and time. Validated data are the u and v component data.
Validation results in the form of CF values shown in Table 5.

Model Flow Simulation
 The current patterns are depicted in 3 Layers i.e Layer 1 (12 m), Layer 2 (44 m), and Layer 3
(84 m). The captured layer is assumed to be a Layer representing the water depth of the surface,
middle and bottom. The result of current modeling is shown in Fig. 6-8.

 Table 5. CF Value of Component U and V Flow
 Nilai CF Komponen Nilai CF Komponen
 Layer
 U V
 1 0.535 0.685
 2 0.431 0.536
 3 0.526 0.452
 4 0.512 0.463
 5 0.566 0.538
 6 0.698 0.604
 7 0.782 0.687
 8 0.767 0.722
 9 0.479 0.485
 10 0.438 0.569

 a) b)
 Fig 7. Map of Flow Pattern 12 m At Condition a) Towards Tidal Down, b) Down to
 Tide

http://ejournal2.undip.ac.id/index.php/ijoice/ Diterima/Received : 29-02-2020
 Disetujui/Accepted : 29-02-2020
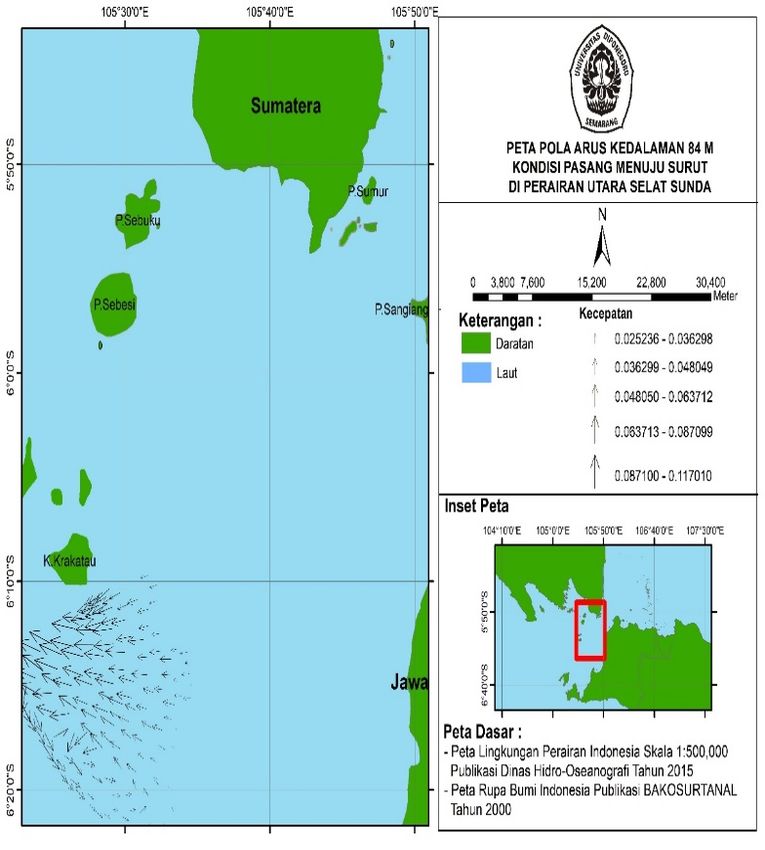
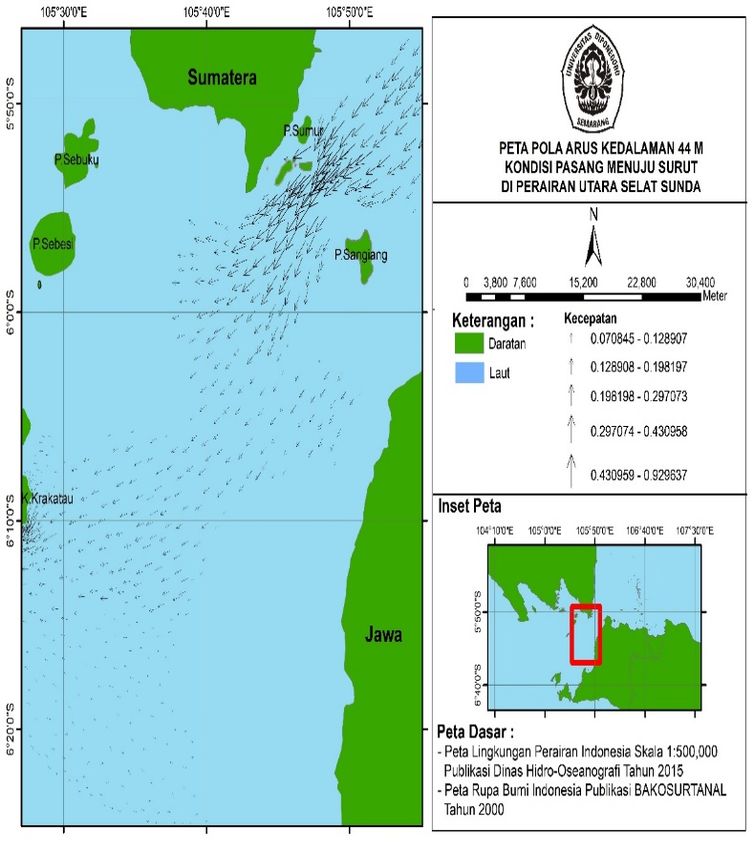
Indonesian Journal of Oceanography [February] [2020] Vol 02 No: 01 ISSN:2714-8726

 a) b)
 Fig 8. Map of 44 m Depth Flow Pattern Under Condition a) Towards Tidal Down, b) Down to Tide

 a) b)
 Fig 9. Flow Pattern Map 84 m At Condition a) Towards Towards; b) Down to Tide

Discussion
 The characteristic of the current pattern in the Northern waters of the Sunda Strait consists of
the direction of the dominant current, the velocity and the type of current movement. The direction of
the dominant current in the Northern waters of Sunda Strait is to the Northeast and the Southwest
(Figure 3a). The dominant current movement to the Northeast and Southwest is influenced by many
factors such as wind and tidal. The movement of currents to the Northeast and the Southwest is
reinforced by winds blowing from the Southwest and Northeast. The wind velocity that blows from
the Northeast ranges from 0.5-5 m / s with an incidence frequency of 16.06%, while the wind velocity
that blows from the Southwest ranges from 1-5 m / s with an incidence frequency of 12.85% (Figure 2
and Table 1). Hadi (2010) describes the stress of the wind that works on the surface of the sea will
encourage water on the surface to form surface currents, surface current patterns follow the pattern of
surface wind.
 The dominant current movement towards the Northeast and the Southwest when associated with
tidal activity is indicative of the dominant current associated with the tides (Figure 3b). This indicates
that the type of current in the northern waters of the Sunda Strait is the tidal current. The separation
graph (Fig. 5) confirms that the dominant current in the northern waters of the Sunda Strait is the tidal
current, visible from the field measurement current line which almost coincides with the astronomic
current line (tide). Supangat and Susanna (2003) explain that vertical water movement associated with
the rise and fall of tidal, accompanied by horizontal water movement is called tidal current. Sutirto and

http://ejournal2.undip.ac.id/index.php/ijoice/ Diterima/Received : 29-02-2020
 Disetujui/Accepted : 29-02-2020

Indonesian Journal of Oceanography [February] [2020] Vol 02 No: 01 ISSN:2714-8726

Trisnoyuwono (2014) also add tidal currents are horizontal motion of water to and away from the
coast along with the rise and fall of sea water (tides) caused by the tidal power generation.
 The current model (Figure 6-8) is the result of the model simulation that has been corrected with
the current data from the field measurement using Cost Function (CF) calculation to determine the
error between the two data so that the model data can be trusted accurately (Table 5). The current
model illustrates the direction of currents at the variations of depth indicating the direction of the
dominant current in the Northern waters of Sunda Strait moving to the Southwest and Northeast. This
provides a strong indication that the pattern of currents in the Northern waters of Sunda Strait is
dominantly influenced by tidal currents. The movement of currents at a depth of 12 m (surface) during
tidal conditions tends to move out of the Sunda Strait towards the Indian Ocean (Fig. 7a), while at low
tide the tide tends to move from the Indian Ocean into the Sunda Strait (Figure 7b). Current movement
at water depth 44 m (center) and 84 m (base), designate same movement pattern (Fig. 7-8). The same
pattern of current movement in this depth variation indicates that the type of tidal current movement in
the Northern waters of the Sunda Strait is hydraulic. Hadi and Radjawane (2009) explains that
astronomical and topographical styles (coastal geometry and depth) give rise to certain current patterns
in the waters. In high tide condition, the current moves into the strait and at low tide reverses outward
from the strait and usually occurs in the strait that connects two unrelated water bodies called
hydraulic tidal current. The pattern of tidal current movement in the research area occurs twice a day.
Tidal current movements related to tidal types in the Northern waters of Sunda Strait are the double
tidal daily (Table 10), so that the tides and lows occur as much as two times each but have different
periods. Neil (2015) explains that the mixed-type tidal leads to semidiurnal having two tides and two
neaps where each has a different period.
 Current velocity in the Northern waters of Sunda Strait ranges from 0.012 - 2.590 m / s (Table
2). Variations in current velocity in the Northern waters of Sunda Strait, besides from being influenced
by the movement condition of the data every 10 minutes, are also influenced by the base currents.
Small current velocities in the middle layer / encounter two opposing currents, occur also because of
the friction between the surface current with the base current, so that the friction of the opposite
current is mutually impeding speed rate. The simulation result of model is between 0.024 - 1.278 m / s
(Fig 6-8). The vector shows the direction and velocity of currents occurring in the simulated area, the
longer the vector shows the greater the current velocity. A large current velocity is seen in the area
around Sangiang Island, Sumur Island, and Panjurit Island, where this area is a constrigency area in
the Sunda Strait (Fig 6).
 The maximum current velocity at each station is found almost at the bottom of the water, shown
by 20 stations (Figure 4). The maximum speed occurring at the bottom of the water is suspected due to
the influence of ARLINDO. Jumarang (2013) explains that the Sunda Strait is an ARLINDO line aside
from the main crossroads such as the Lombok Strait, the Ombai Strait, and the Timor Sea. This is also
reinforced by Wyrtki's (1961), which states that the Sunda Strait and the Malacca Strait is the
waterway between the Indian Ocean and the Pacific Ocean, even though it’s a small way due to the
narrowness of the straits.

CONCLUSION
 The dominant surface current in the northern waters of the Sunda Strait is the tidal current. The
direction of the current movement in the high tide to low tide conditions is to the Southwest, while at
low tide to high tide condition, the direction of the current is to Northeast. The type of tidal current
movement in the Northern waters of Sunda Strait is hydraulic. The movement of alternating currents
from the Northeast to the Southwest and vice versa as tidal movements occurs twice a day (tidal mixed
double-skew daily).
 Current velocity in the northern waters of the Sunda Strait ranges from 0.012 m / s - 2.590 m / s,
where the maximum velocity at each observation point / station is at the bottom of the waters.

http://ejournal2.undip.ac.id/index.php/ijoice/ Diterima/Received : 29-02-2020
 Disetujui/Accepted : 29-02-2020

Indonesian Journal of Oceanography [February] [2020] Vol 02 No: 01 ISSN:2714-8726

REFERENCES
Angeloudis, A., Reza Ahmadian, Roger A. Falconer and Bettina Bockelmann-Evans. 2015. Numerical
 model Simulations for Optimisation of Tidal lagoon Schemes. Elsevier. Cardiff Univ. of
 Engineering, Cardiff, p.522 (abstract).
Buntoro, K. 2012. Alur Laut Kepulauan Indonesia (ALKI). Sekolah Staf dan Komando TNI
 AL(SESKOAL), Jakarta, 330 hlm.
Chatzirodou, A., Harshinie K., and Dominic E. Reeve. 2017. Modelling 3D Hydrodynamic Governing
 Island-Associated Sandbanks in a Proposed Tidal Stream Energy Site. Elsevier. Zienkiewicz
 Centre for Computational Engineering College of Engineering. Swansea Univ., Swansea, p.79
 (abstract).
Danish Hydraulic Institute Water and Environment (DHI). 2012. Manual Mike 21 Flow Model
 Hydrodinamic Module, Scientific Background. DHI Waters & Environment, Horsholm,
 Denmark.
George, MS., Bertino, L., Johannessen, OM., and Samuelsen, A., 2010. Validation of a Hybrid
 Coordinate Ocean Model for The Indian Ocean. Journal of Operational Oceanography. 1(1) :
 Nansen Enviromental And Remote Sensing Center, Bergen, p.25 (absctract).
Hadi, Safwan. 2010. Pengantar Oseanografi Fisis. Institut Teknologi Bandung, Bandung, 218 hlm.
Hadi, S. dan Radjawane, I. M. 2009. Arus Laut. Ganesha ITB Bandung, Bandung, 160 hlm.
Jumarang, M. Ishak dan Nining S. Ningsih. 2013. Transpor Volume Massa Air di Selat Sunda Akibat
 Interaksi Enso, Monsun dan Dipole Mode. Prosiding Semirata FMIPA Universitas Lampung
 (abstrak).
Kowalik, Z., Aleksey Marchenko and Dmitry Brazhnikov. 2015. Tidal Current in The Western
 Svalbard Fjords. Elsevier. Univ. of Alaska Fairbanks dan The Univ. Centre in Svalbard, p.318
 (abstract).
Neill, Simon P., M. Reza Hashemi and Matt J. Lewis. 2015. Tidal Energy Leasing and Tidal Phasing.
 Elsevier. Bangor Univ. of Ocean Sciences and Univ. of Rhode Island of Ocean Engineering,
 Menai Bridge, p.580 (abstract).
O’Rourke, Fergal, Fergal Boyle and Anthony Reynolds. 2010. Tidal Current Energy Resource
 Assessment in Ireland: Current Status and Future Update. Elsevier. Department of Mechanical
 Engineering. Dublin Institute of Technology, Dublin, p.3206 (abstract).
Supangat, A. dan Susanna. 2003. Pengantar Oseanografi. BRKP, Jakarta, 273 hlm.
Sutirto, S.T., M.T. dan Trisnoyuwono, D.,S.T., M.T. 2014. Gelombang dan Arus Laut Lepas. Graha
 Ilmu, Yogyakarta, 131 hlm.
Wyrtki, K. A. 1961. Scientific Results of Marine Investigations of the South China Sea and Gulf of
 Thailand 1959-1961. Naga Report II, The University of California. Scripps Institution of
 Oceanography, La Jolla. California.

http://ejournal2.undip.ac.id/index.php/ijoice/ Diterima/Received : 29-02-2020
 Disetujui/Accepted : 29-02-2020
You can also read