Air New Zealand Bond Offer - 13 October 2016 - interest.co.nz
←
→
Page content transcription
If your browser does not render page correctly, please read the page content below

Air New Zealand
   Bond Offer
   13 October 2016

                     1
Notice and Disclaimer
The offer of the Bonds by Air New Zealand is made in reliance upon the exclusion in clause 19 of Schedule 1 of the Financial Markets Conduct Act 2013 (“FMCA”). The offer of
Bonds is an offer of debt securities that have identical rights, privileges, limitations and conditions (except for the interest rate and maturity date) as Air New Zealand’s
NZ$150,000,000 unsecured, unsubordinated, fixed rate, interest bearing bonds maturing on 15 November 2016 which are currently quoted on the NZX Debt Market under the ticker
code AIR010 (AIR010 Bonds).
The Bonds are of the same class as the AIR010 Bonds for the purposes of the FMCA and the Financial Markets Conduct Regulations 2014.
Air New Zealand is subject to a disclosure obligation that requires it to notify certain material information to NZX Limited (NZX) for the purpose of that information being made
available to participants in the market and that information can be found by visiting www.nzx.com/companies/AIR/announcements.
The AIR010 Bonds (which have a fixed interest rate of 6.90% per annum) are the only debt securities of Air New Zealand that are currently quoted and in the same class as the
Bonds. Investors should look to the market price of the AIR010 Bonds referred to above to find out how the market assesses the returns and risk premium for those bonds.
This presentation does not constitute a recommendation by Air New Zealand Limited (“Air New Zealand”), Bank of New Zealand (“BNZ”) and Craigs Investment Partners Limited
(together the “Joint Lead Managers”), Craigs Investment Partners Limited (the “Organising Participant”), nor any of their respective directors, officers, employees or agents to
subscribe for, or purchase, any Bonds.
None of the Joint Lead Managers and the Organising Participant nor any of their respective directors, officers, employees and agents: (a) accept any responsibility or liability
whatsoever for any loss arising from this presentation or its contents or otherwise arising in connection with the offer of Bonds; (b) authorised or caused the issue of, or made any
statement in, any part of this presentation; and (c) make any representation, recommendation or warranty, express or implied regarding the origin, validity, accuracy, adequacy,
reasonableness or completeness of, or any errors or omissions in, any information, statement or opinion contained in this presentation and accept no liability therefor (except to the
extent such liability arises under the FMCA or cannot be disclosed). The Joint Lead Managers and the Organising Participant do not guarantee the repayment of Bonds or the
payment of interest thereon or any other aspect of Bonds.
This presentation is for preliminary informational purposes only and is not an offer to sell or the solicitation of an offer to purchase or subscribe for the Bonds and no part of it shall
form the basis of or be relied upon in connection with any contract or commitment whatsoever. The information in this present ation is of summary in nature and is necessarily brief. It
is given in good faith and has been obtained from sources believed to be reliable and accurate at the date of this presentation, but its accuracy, correctness and completeness
cannot be guaranteed. Air New Zealand has prepared a terms sheet (“Terms Sheet”) in respect to the offer of the Bonds. You should not decide to purchase Bonds until you have
read the Terms Sheet.
Air New Zealand intends to offer the Bonds to the public in New Zealand. No action has been or will be taken by Air New Zealand which would permit a public offering of Bonds, or
possession or distribution of any offering material, in any country or jurisdiction where action for that purpose is required (other than New Zealand). No person may purchase, offer,
sell, distribute or deliver any Bonds, or have in its possession, or distribute to any person, any offering material (including this presentation) or any documents in connection
therewith, in any jurisdiction other than in compliance with all applicable laws and regulations.
Application has been made to NZX for permission to quote the Bonds on the NZX Debt Market (“NZDX”) and all the requirements of NZX relating thereto that can be complied with
on or before the date of the Terms Sheet have been duly complied with. However, NZX accepts no responsibility for any statement in the Terms Sheet. NZX is a licenced market and
the NZDX is a licenced marked under the FMCA.
Defined terms used throughout this presentation have the meaning given to them in the Terms Sheet.                                                                                            2

Agenda
•   Air New Zealand overview
•   2016 Financial Year in review
•   Bond Issue Summary Terms, Offer Process and Key Dates
•   Appendices
        •   Five year summary

                                                            3
Air New Zealand
    overview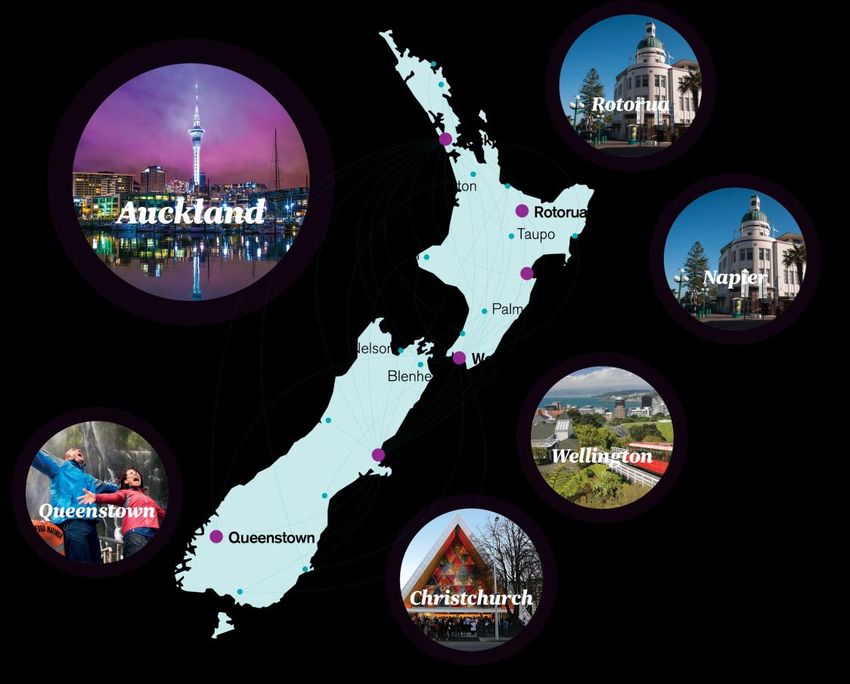
The Air New Zealand network
                                  Diversified profitability across a
                                  network focused on the Pacific Rim
                                  Growth underpinned by strong
                                  alliance partnerships in key markets
                                  30 international destinations
                                  Leveraging our geography to
                                  maximise traffic through and into
                                  New Zealand
                                       –   Tourism growth driving inbound
                                           international growth
                                       –   Grow and leverage network
                                           efficiencies in Asia
                                       –   Australian traffic in key cities
                                           feeding North & South American
     Focused on the Pacific Rim            growth

                                                                              5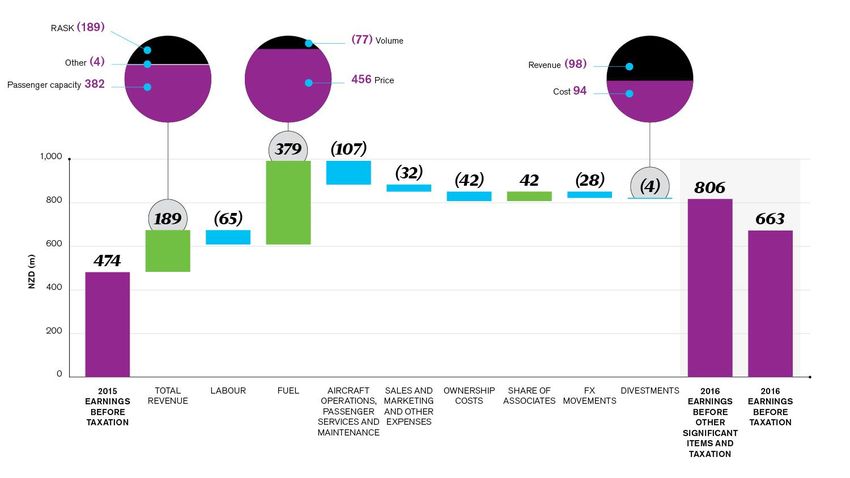
Overseas tourism into New Zealand continues
  to grow

                                                       International visitor arrivals to New Zealand:

                                                                      11%
                                                                      For year ending June 2016

                              3.3M
                               Visitors for the year
                               ending June 2016
                                                       New Zealand’s tourism industry:
                                                        • Contributes 17.4% of total exports

                                                        • Employs 7% of the workforce

                                                        • Contributes $18.5 billion to the economy

Source: Statistics New Zealand, June 2016.                                                              6
Inbound tourism expected to continue to fuel
    domestic growth

•   Domestic dispersal of inbound
    international tourism through Auckland

•   Strong domestic market share to
    leverage growth from inbound tourists

•   Network strength, product and lounges
    to drive further stimulation

•   Full network offering to 21 main centres
    and regions across New Zealand

•   Stable outlook for New Zealand
    economic growth driving increased
    domestic travel

                                                   7
Our international growth is supported by strong
alliance partnerships
*
Why it works
for Air New Zealand
Partners have “skin in the game”
to sell the route
Strength of sales & distribution in
local markets
Access to frequent flyer databases
*
Indicates a revenue share alliance.
* Not part of a revenue share alliance. 8
2016 Financial Year
     in review

   All of the data provided in this section is derived from publically
 available information in relation to Air New Zealand Limited and its
    subsidiaries (including the Annual Report of Air New Zealand
     Limited for the year ended 30 June 2016), unless otherwise
                                indicated.
The year in review
•      Operating revenue $5.2 billion (up 8.2%)*

•      Earnings before taxation $806** million (up 70%)

•      Net profit after taxation $463 million (up 42%)

•      Operating cash flow $1.1 billion (down 2.4%)

•      Return on invested capital (pre-tax) 22%**

                  Earnings
                   Earnings
                before   other
                 before other                             Other             Earnings              Net profit
                 significant
                  Significant                          significant
                                                       significant           before    Taxation     after
                  Items and
                 items   and                              items             taxation
                                                                            taxation   ($200m)    taxation
                   taxation
                  taxation                             ($143m)              $663m                 $463m
                   $806m
                   $806m

    * Excluding divestments (Altitude, Safe Air, TAE and Holiday Stores).
                                                                                                               10
    ** Prior to other significant items of $143 million.
Key drivers of the result
• Passenger revenue up 8.9%*
– Capacity and demand strong – ASKs and RPKs up 12% and 11%,
Revenue respectively
– RASK declined 2.3%*
• Cargo revenue, up 10%*
• CASK (excluding divestments) improved 10%
– Fuel price declined 40% Fuel price
Cost
down
Significant price decrease more than offset increased 40%
fuel volume
– Efficiencies contributed $222 million to profitability
* Excluding the impact of foreign exchange, passenger revenue increased 4.7%, RASK declined 6.1% and cargo revenue increased 3.5%.
11Changes in profitability
12Strong operating cash flow and liquidity
provide flexibility
• Operating cash flow $1.1 billion, down 2.4% over prior period
– Strong operating cash flow per share of $0.96
• Net cash on hand of $1.6 billion, up 21% from June 2015
13Balance sheet remains strong
• Gearing was 48.6% as at June 2016, improving 3.8 percentage points from June 2015 due
to strong operating profit
• Stable outlook Baa2 rating from Moody’s*
• $150 million retail bond maturing in November 2016
Target gearing: 45% to 55%
**
** $464mAircraft update
• Expected investment of ~$2.1 billion in aircraft and
associated assets over the next 5 years
• Assumes NZD/USD = 0.715
• Includes progress payments on aircraft
• Shift towards increased proportion of owned fleet
– Economic benefit over the lifetime of the aircraft
– Increased flexibility with capacity planning
• Balance sheet remains strong during period of
increased fleet ownership
* Excludes orders of up to five A320/A321 NEOs with purchase substitution rights.
Note: Air New Zealand Aircraft Holdings Limited, a subsidiary of Air New Zealand, is the registered owner or lessee of the majority of the aircraft operated by Air New Zealand. Air New Zealand guarantees the
obligations of Air New Zealand Aircraft Holdings Limited in relation to loans and finance and operating lease arrangements re lating to such aircraft. Any claims against Air New Zealand under these guarantees will 15
rank equally with the Bonds in the event of a liquidation of Air New Zealand. Refer to “Air New Zealand guarantees its Subsidiaries” in the Terms Sheet for further information.Modern aircraft driving improved variable cost
efficiencies
Wide-body Narrow-body Turbo-prop
B787-9 A321 neo ATR72-600 Scale economies
vs B767-300ER vs A320 ceo vs Bombardier Q300
Substantially lower
↑ 31% ↑ 23% ↑ 36%* operating costs and
increased seat density
Additional seats Additional seats Additional seats resulting in
reduced unit costs
↓ ~20% ↓ ~16% ↓ ~13%*
Variable Variable Variable
Operating cost Operating cost Operating cost
(per seat) (per seat) (per seat)
16
* When compared to the Beech 1900D, the ATR72-600 aircraft has 49 more seats and approximately 40% improvement in variable operating costs per seat.The second half of 2016 saw the emergence
of increasing competitive headwinds
Tailwinds Headwinds
• Double-digit growth* in New Zealand tourism • Increased competition pressuring RASK
Revenue – Resulting in strong domestic tourism • Limitations of New Zealand tourism
• Stable economic conditions in New Zealand infrastructure
Cost • Fuel price outlook continues to be favourable
Our unique capabilities enable us to compete strongly against increased competition
Our alliance Our brand and kiwi Our domestic Our AirpointsTM Our simplified fleet &
network service culture network members competitive cost structure
17
* Source: NZ Statistics, increase of 11% based on 12 months ending June 2016.2017 capacity and outlook
Sector Competition Air New Zealand 2017 capacity
Domestic Expect similar competitive +7% to 9% • Continued up-gauge for regional
environment to 2016 routes and increased frequency
on select trunk routes
• Queenstown night flights
Tasman & Pacific Expect competitive pressure +3% to 5% • Up-gauge related to B787
to persist in 2017 replacement of B767
Islands
International Expect competitive pressure +4% to 6% • Annualisation of Houston &
to increase in 2017 Buenos Aires
long-haul
• Full year impact of direct • Increased Asian capacity during
competition on AKL – LAX peak
• New services from Chinese and
Middle Eastern carriers
• Commencement of Osaka
seasonal service
Given the uncertain impact of competition and based upon current market conditions, 2017 earnings
before taxation are expected to be in the range of $400 million to $600 million.
Assumes jet fuel at US$55 per barrel for the remainder of the year.
18Bond Issue Summary Terms, Offer Process and Key Dates
Summary Terms
Issuer                                                Air New Zealand Limited
Description                                           Unsecured, unsubordinated, fixed rate, interest bearing debt obligations
Offer Amount                                          NZ$75,000,000
Use of Proceeds                                       General business purposes including partial repayment of the AIR010 Bonds
Tenor                                                 6 years
Closing Date / Rate Set Date                          Thursday, 20 October 2016
Issue Date / Allotment Date                           Friday, 28 October 2016
Maturity Date                                         Friday, 28 October 2022
Interest Frequency                                    Semi-annually in arrear on 28 April and 28 October
Brokerage                                             0.50% brokerage fee plus 0.25% firm fee
Minimum Application Amount                            NZ$5,000 and multiples of NZ$1,000 thereafter
Joint Lead Managers                                   Bank of New Zealand and Deutsche Craigs Limited
Supervisor                                            The New Zealand Guardian Trust Company Limited
Listing and Quotation                                 Air New Zealand will take any necessary steps to ensure that the Bonds are, immediately after
                                                      the issue, quoted.

The Terms Sheet sets out the key terms of the offer of the Bonds. You should not decide to purchase the Bonds until you have read the Terms Sheet.
The Bonds will constitute unsecured, unsubordinated fixed rate debt obligations of Air New Zealand and rank equally and without preference among themselves.
The Bonds also rank at least equally with all other unsecured and unsubordinated indebtedness of Air New Zealand, except indebtedness preferred by law. None of
the Subsidiaries or Affiliates of Air New Zealand nor any other person guarantees the obligations of Air New Zealand in respect of the Bonds. The minimum holding
of the Bonds is NZ$5,000 (or, in the case of amounts held by NZX registered brokers and registered banks, NZ$1,000) and in multiples of NZ$1,000 thereafter.        20
Offer Process
• How to apply
– Primary market participants, institutional investors and any other approved parties are invited
to participate in the bookbuild process
– All of the Bonds are reserved for clients of the Joint Lead Managers, institutional investors
and other Primary Market Participants invited to participate in the bookbuild
– There will be no public pool for the offer
– Retail investors should contact a Joint Lead Manager, their financial adviser or any Primary
Market Participant for details on how they may acquire Bonds. You can find a Primary Market
Participant by visiting www.nzx.com/investing/find_a_participant
• Application Information
– Minimum application of NZ$5,000 (and multiples of NZ$1,000 thereafter)
• Fees paid by Air New Zealand
– Brokerage of 0.50% plus 0.25% on firm allocations
21Key Dates
Opening Date Thursday, 13 October 2016
Roadshow Thursday, 13 October 2016 and Friday, 14 October 2016
Bookbuild Date Thursday, 20 October 2016
Closing Date Thursday, 20 October 2016
Rate Set Date Thursday, 20 October 2016
Issue Date / Allotment Date Friday, 28 October 2016
Expect Date of Initial Quotation and Trading on the NZX Debt Monday, 31 October 2016
Market
First Interest Payment Date Friday, 28 April 2017
Maturity Date Friday, 28 October 2022
10 calendar days before the relevant Interest Payment Date or
Record Date
Maturity Date (whether or not such date is a Business Day)
22Appendix
• Five year summary
25Five year key operating statistics
for the year to 30 June
2016 2015 2014 2013 2012
Passengers Carried (000) Domestic 9,725 9,246 8,920 8,694 8,500
International
Australia and Pacific Islands 3,507 3,388 3,277 3,181 3,073
Asia * 791 642 517 596 652
America and Europe 1,138 1,021 1,005 940 897
Total international 5,436 5,051 4,799 4,717 4,622
Total Group 15,161 14,297 13,719 13,411 13,122
Available Seat Kilometres (m) Domestic 6,065 5,592 5,385 5,108 4,969
International
Australia and Pacific Islands 11,438 10,888 10,622 10,277 9,694
Asia * 8,349 7,022 5,656 6,780 7,495
America and Europe 13,832 12,099 11,733 11,002 10,460
Total international 33,619 30,009 28,011 28,059 27,649
Total Group 33,684 35,601 33,396 33,167 32,618
Revenue Passenger Kilometres (m) Domestic 4,887 4,561 4,370 4,218 4,050
International
Australia and Pacific Islands 9,532 9,184 8,858 8,580 8,164
Asia * 7,070 5,784 4,630 5,418 5,979
America and Europe 11,734 10,405 10,220 9,517 8,820
Total international 28,336 25,373 23,708 23,515 22,963
Total Group 33,223 29,934 28,078 27,733 27,013
Passenger Load Factor (%) Domestic 80.6 81.6 81.1 82.6 81.5
International
Australia and Pacific Islands 83.3 84.4 83.4 83.5 84.2
Asia * 84.7 82.4 81.9 79.9 79.8
America and Europe 84.8 86.0 87.1 86.5 84.3
Total international 84.3 84.6 84.7 83.8 83.1
Total Group 83.7 84.1 84.1 83.6 82.8
26
* Asia included Hong Kong – London flying up until March 2013.Five year summary of financial performance
for the year to 30 June
2016 2015 2014 2013 2012
$m $m $m $m $m
Operating Revenue
Passenger revenue 4,481 4,113 3,851 3,765 3,634
Cargo 349 317 287 301 298
Contract services 172 258 277 310 316
Other revenue 229 237 237 239 235
5,231 4,925 4,652 4,615 4,483
Operating Expenditure
Labour (1,225) (1,193) (1,151) (1,068) (1,050)
Fuel (846) (1,089) (1,120) (1,204) (1,219)
Maintenance (350) (320) (285) (302) (303)
Aircraft operations (531) (466) (424) (419) (390)
Passenger services (246) (220) (212) (222) (233)
Sales and marketing (348) (303) (280) (274) (270)
Foreign exchange gains/(losses) 112 79 45 7 (68)
Other expenses (255) (252) (222) (236) (235)
(3,689) (3,764) (3,649) (3,718) (3,768)
Operating Earnings (excluding items below) 1,542 1,161 1,003 897 715
Depreciation and amortisation (465) (402) (436) (411) (348)
Rental and lease expenses (244) (211) (174) (177) (209)
Earnings Before Finance Costs, Associates and Taxation 833 548 393 309 158
Finance income 53 56 44 37 31
Finance costs (100) (108) (90) (91) (95)
Share of earnings of associates (net of taxation) 20 (22) 11 - -
Earnings Before Other Significant Items and Taxation 806 474 358 255 94
Other significant items (143) - - - -
Earnings Before Taxation 663 474 358 255 94
Taxation (expense)/credit (200) (147) (95) (74) (23)
Net Profit Attributable to Shareholders of Parent Company 463 327 263 181 71 27Five year summary of Financial Position & Cash Flows
for the year to 30 June
2016 2015 2014 2013 2012
$m $m $m $m $m
Summary of Financial Position
Current Assets
Bank and short term deposits 1,594 1,321 1,234 1,150 1,029
Other current assets 745 661 593 693 658
Total Current Assets 2,339 1,982 1,827 1,843 1,687
Non-Current Assets
Property, plant and equipment 4,485 4,061 3,279 2,933 3,090
Other non-current assets 427 733 744 820 668
Total Non-Current Assets 4,912 4,794 4,023 3,753 3,758
Total Assets 7,251 6,776 5,850 5,596 5,445
Current Liabilities
Net debt 464 253 190 159 157
Other current liabilities 2,007 1,875 1,682 1,555 1,544
Total Current Liabilities 2,471 2,128 1,872 1,714 1,701
Non-Current Liabilities
Net debt 2,103 2,069 1,543 1,470 1,537
Other non-current liabilities 569 613 563 611 544
Total Non-Current Liabilities 2,672 2,682 2,106 2,081 2,081
Total Liabilities 5,143 4,810 3,978 3,795 3,782
Net Assets 2,108 1,966 1,872 1,801 1,663
Total Equity 2,108 1,966 1,872 1,801 1,663
Summary of Cash Flows
Cash flow from operating activities 1,074 1,100 730 750 472
Cash flow from investing activities (794) (1,066) (727) (480) (654)
Cash flow from financing activities (4) 53 81 (147) 349
Increase/(decrease) in cash holding 273 87 84 123 167
Total cash and cash equivalents 1,594 1,321 1,234 1,150 1,027
28Five year summary of Financial Ratios
for the year to 30 June
2016 2015 2014 2013 2012
Profitability and capital management
EBIT 1/Operating Revenue % 15.9 11.1 8.4 6.7 3.5
EBITDRA2/Revenue % 29.5 23.6 21.6 19.4 15.9
Passenger Revenue per Revenue Passenger Kilometre (Yield) cents 13.5 13.7 13.7 13.6 13.5
Passenger Revenue per Available Seat Kilometre (RASK) cents 11.3 11.6 11.5 11.4 11.1
Cost per Available Seat Kilometre (CASK)3 cents 9.3 10.6 10.9 11.2 11.6
Return on Invested Capital Pre-tax (ROIC)4 % 18.8 16.2 14.3 11.6 7.1
Liquidity ratio5 % 36.0 29.7 29.2 29.9 27.2
Gearing (incl. net capitalised aircraft operating leases)6 % 48.6 52.4 42.9 39.3 46.1
Shareholder Value
Basic Earnings per Share7 cps 41.3 29.2 23.9 16.5 6.5
Operating Cash Flow per Share7 cps 95.6 98.1 65.5 67.9 42.9
Ordinary Dividends Declared per Share7 cps 20.0 16.0 10.0 8.0 5.5
Special Dividends Declared per Share7 cps 25.0 - 10.0 - -
Net Tangible Assets per Share7 $ 1.76 1.66 1.60 1.57 1.48
Closing Share Price 30 June $ 2.10 2.55 2.08 1.49 0.86
Weighted Average Number of Ordinary Shares m 1,122 1,118 1,101 1,096 1,096
Total Number of Ordinary Shares m 1,123 1,122 1,114 1,104 1,100
Total Market Capitalisation $m 2,352 2,861 2,318 1,639 946
Total Shareholder Return8 % 20.0 25.6 24.0 11.6 (16.1)
1. Earnings before interest and taxation (EBIT) excluding share of earnings of associates (net of taxation) and other signifi cant items
2. EBITDRA excluding share of earnings of associates (net of taxation) and other significant items
3. Operating expenditure per ASK
4. (EBIT plus interest component of aircraft leases)/average capital employed (Net Debt plus Equity) over the period
5. (Bank and short-term deposits, interest-bearing deposits, non interest-bearing deposits and bank overdraft)/Operating Revenue
6. Net Debt (including capitalised aircraft operating leases)/(Net Debt plus Equity)
7. Per-share measures based upon Ordinary Shares
8. Return over five years including the change in share price and dividends received (assuming dividends are reinvested in shares on payment date) 29You can also read