WOMEN'S RUGBY WORLD CUP 2006 STATISTICAL REVIEW AND MATCH ANALYSIS
←
→
Page content transcription
If your browser does not render page correctly, please read the page content below
WOMEN’S RUGBY WORLD CUP
                 2006

                STATISTICAL REVIEW
                       AND
                 MATCH ANALYSIS

IRB Game Analysis                    Jan 2007
The attached report does 3 things:
      • it reflects the shape of the Women’s game as seen in
        WRWC2006 through a Commentary on the tournament
            followed by a Statistical Summary and Analysis
      • it incorporates a comparison with the men’s game as
                        seen in RWC2003, and
   • it provides – because of the country by country data that
      has been included – a basis whereby each participating
      country can compare its performance in major areas of
          the game with the other teams that played in the
       competition. In doing this, the various teams may find
         the data of benefit in establishing benchmarks and
           performance indicators for future tournaments.

NOTE 1
There were 30 matches played in WRWC 2006.
Videos were not available for one of the matches. As a result, most of the following
analysis is based on the summary of 29 matches. Where, however, videos were not
required in order to produce certain sections, e.g. match scores, the report
incorporates all matches.
NOTE 2
When comparisons are made with the men’s game, they have been made with RWC
2003. This is considered to be a better basis for comparison than recent 6 Nations and
TriNations tournaments since World Cup competitions are different. They include
matches between Tier1, 2 and 3 countries. Higher scores and greater scoring spreads
are seen so that a comparison between World Cups, whether played by men or women,
gives a more accurate comparison than a comparison with Tier 1 competitions.
STATISTICAL REVIEW AND MATCH ANALYSIS

PAGE      CONTENTS

 1-2      COMMENTARY

 3-5      SUMMARY AND COMPARISON WITH THE MEN’S GAME

  6       FINAL STANDINGS

  7       RESULTS

  8       SCORING
  10      TEAM SCORING

  12      WINNING MARGINS

  12      TIME OF SCORES
  13      SOURCE OF TRIES

  13      ORIGIN OF TRIES

  14      BUILD UP OF TRIES

  14      PLAYER SCORING

  15      KICKING SUCCESS

  17      MODE OF PLAY – BALL IN PLAY

  18      ACTIVITY CYCLES
18 - 21   RUCKS AND MAULS

21 – 24   PASSING

24 – 26   KICKS

26 - 27   LINEOUTS

  28      SCRUMS

  29      RESTARTS

30 – 33   PENALTIES

  34      RED/YELLOW CARDS

  35      SUMMARY TABLES – COMPARISON WRWC 2006 to WRWC 2002
                           STATISTICAL TEAM SUMMARY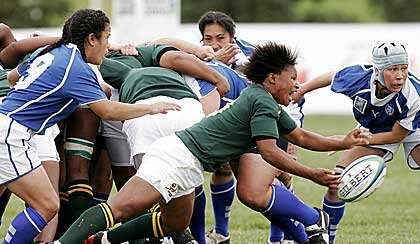
A STATISTICAL REVIEW AND ANALYSIS OF 2006 WOMEN’S RWC

COMMENTARY
                                 The big change

In November 2002, a report was produced entitled “THE WOMEN’S GAME –
a comparison with the men’s game in prior years”. The final paragraph of
the report read as follows:

      In summary therefore, it can be said that as the men’s game has developed
       since 1995, so has the women’s game. – but while the women’s game is
       structurally similar to that played by men in RWC99, the men’s game has
       moved on noticeably since then. The result is that the amount of time the ball
       is in play in the women’s game is now substantially less than in the current
       men’s game where there are some 40% more rucks/mauls and 35% more
       passes and kicks. The men’s game therefore is more attritional and is played
       at a greater pace. There is more going on.

This may well have been the case in 2002 but no longer. Women’s Rugby
World Cup 2006 saw this change.

                        Ball in play – which signifies activity – went up by
                        almost 20% compared with 2002 – and, since it follows
                        that the amount of time that the ball is in play dictates
                        to a major extent the number of rucks, passes and
                        kicks in a game, so there was more activity. The effect
                        of this increase brought the number of passes and
                        rucks to levels that are now very close to the men’s
                        game. No longer is there a difference of 40% in rucks
                        and mauls and 35% in passes as there was in 2002–
                        parity has been achieved in both these areas as a
                        result of fewer passes being made in the men’s game
                        and now more in the women’s.

This was not however the only area where difference seen 4 years ago have
either disappeared or narrowed.

In 2002, the timing of tries was quite different. In the men’s game a far greater
proportion of tries were scored in the second half. Further, in the women’s
game the first 5 minutes of a match saw twice as many tries as in any other 5
minute period. This was the complete opposite to the timing of tries in the
men’s game where the first 5 minutes saw the fewest number of tries. None of
this however applies any longer. The timing of scores, whether penalty goals
or scrums, reflects that seen in the men’s game.

The other most noticeable difference from the men’s game was in the area of
penalties and free kicks. WRWC2002 contained an average of 35% more
penalties than in the men’s game. This was largely accounted for by more
penalties being awarded at the ruck/tackle area – a fact confirming a general
observation that more players went to ground than in the men’s game. This
however is no longer the case with the result that the average number of

                                         1
A STATISTICAL REVIEW AND ANALYSIS OF 2006 WOMEN’S RWC

penalty kicks per game in WRWC 2006 was exactly the same as that in
WRWC 2002. Further – and unlike 2002 – it can no longer be said that “there
are fewer penalties for foul play and tackle offences in the Women’s game”.
They are now at the same percentage level which is very low in both cases.
Foul play penalties do not even amount to 1 per game.
The result of all this is that a comparison of WRWC2006 with RWC2003
showed a structurally very similar game. Apart from scrums - which were 33%
more frequent in the men’s game - all core elements were recognisably the
same – but with one significant exception – kicking.
While the average number of tries were similar, when it came to kicks there
were huge differences between the men’s game and the women’s game.
Conversion rates were less, and there were many fewer penalty goals.
This was because penalty attempts at goal were far less frequent and far less
successful. What became clear was that that kicks over a certain distance
caused considerable difficulty to many women’s teams. In 29 matches for
example, only 8 penalty kicks at goal from within 15 metres of the touchline
were attempted. Only 3 succeeded and all these were on the 15 metre line.
The result was that there were many fewer penalty attempts at goal – less
than 2 per game, compared with 6 in the men’s game. Further, drop goals
play little, if no part, in the women’s’ game. This, together with fewer penalty
kicks and less successful conversions explains why the average number of
points scored per game in RWC 2003 exceeded by 50% that seen in WRWC
2006. Kicking explained the entire difference.
Kicking therefore was a far
less noticeable part of the
women’s game with fewer
kicks at goal, a lesser success
rate and fewer kicks from
hand during open play. That
aside, however, it can be said
that there is now a close
similarity     between      the
women’s and men’s game at
World Cup level.

This is illustrated further in the following section which compares the women’s
and men’s game in more detail.

                                       2
A STATISTICAL REVIEW AND ANALYSIS OF 2006 WOMEN’S RWC

         Women’s Rugby World Cup 2006
        STATISTICAL REVIEW AND MATCH
                  ANALYSIS
         Summary - and comparison the men’s game

             Points Scored                                  Points Scored
                                            While the average number of tries were similar
                                            to the men’s game, conversion rates were less
The average number of points scored
                                               and there were many fewer penalty goals.
         per match was 39
    179 tries were scored in the 30
               matches.
There was an average of 6.0 tries per
               game
                                              This was because penalty attempts at goal
                                            were far less frequent and far less successful.
 There were six times more tries than
                                             What became clear was that that kicks over a
            penalty goals
                                            certain distance caused considerable difficulty
                                                        to many women’s teams.
                                               In 29 matches for example, only 8 penalty
                                               kicks at goal from within 15 metres of the
                                             touchline were attempted. Only 3 succeeded
                                                  and these were on the 15 metre line.
                                             The result was that there were many fewer
                                            penalty attempts at goal – LESS THAN 2 PER
                                             GAME, compared with 6 in the men’s game
Of the 179 tries, 20% started inside the      In the men’s game, 23% started inside the
        scoring team’s own half                        scoring teams own half
                                            This compares with an almost identical figure
                                            of 81% in the RWC2003 – which is somewhat
 The winning team scored more tries
                                             paradoxical given that there were around 5
than their opponents in all but 5 of 30
                                              times as many penalties kicked in the last
   matches – or in 80%of matches
                                              men’s World Cup. All that does however is
                                             confirm what appears to now be a universal
                                             truth –that however many penalties and are
                                              awarded and kicked, the team scoring the
                                            most tries wins on around 80% of occasions.
                                            This was not too dissimilar to RWC2003 where
                                             tries from lineouts accounted for 27%of tries
    26% of tries came from lineout
                                            and from scrums 26%.In fact, the source of try
   possession and 22% from scrum
                                            possession from all possible sources followed
              possession
                                                     closely that of the men’s game.
                                             This was a close reflection of the incidence
                                                          seen in RWC2003
   Two thirds of penalty goals were
 kicked in the first half – two thirds of
          tries in the second.

                                              3
A STATISTICAL REVIEW AND ANALYSIS OF 2006 WOMEN’S RWC

            Activity Cycles                                 Activity Cycles
                                              The average ball in play in RWC 2003 was
                                                                 42%
    Ball in play time averaged 41%
                                              The amount of time that the ball is in play
                                              dictates to a significant extent the number
                                              of rucks, passes and kicks in a game. The
                                               more the ball is in play the more activity
                                                                there is.

                                                In the last Women’s Rugby World Cup,
                                              ball in play was noticeably less than in the
                                               men’s game and as a result it was noted
                                              that ‘ the men’s game produces 40% more
                                                rucks and mauls and around 35% more
                                                    passes’. This no longer applies.

                                              The increase in ball in play of almost 20%
                                                when compared with WRWC 2002 has
                                              brought the number of passes and rucks
                                              to levels that are very close to the men’s
                                              game. Kicks however are still fewer in the
                                                   women’s game – which may be a
                                              reflection of the fact that kicks are a less
                                              successful element of the women’s game
                                                      compared with the men’s.

 Rucks/mauls averaged 131 per game                 In RWC2003, they averaged 136.
  Passes averaged 220 per game and             There were 241 in RWC2003 and 83% of
 almost 80% of all passing movements           passing movements contained 2 passes
      contained 2 passes or less                               or less.

 Open play kicks averaged 43 per game               Open play kicks averaged 52.

              Set Pieces                                      Set Pieces
There were, on average, 31 lineouts per          RWC2003 lineout figures were very
                game,                                        similar.

68% were contested and possession was         The were 33 per game, just over 60% were
    retained on 73% of occasions.              contested and possession was retained
                                                        on 80% of occasions.

There were an average of 28 scrums per          There were only 21 scrums per game I
 game. Possession retained was 89%                RWC 2003 some 7 less than in the
                                                   Women’s tournament. Retained
                                               possession was similar however – 91%.

                                          4
A STATISTICAL REVIEW AND ANALYSIS OF 2006 WOMEN’S RWC

               Penalties                                        Penalties
    Penalties averaged 24 per game               Penalties in RWC2003 also averaged 24
                                                               per game.
Penalties for ground offences at ruck and          In RWC 2003, ruck/tackle penalties
tackle accounted for 52% of all penalties                accounted for 46%.

 65% of the penalties at the ruck/tackle          70% went against the defending team
 area went against the defending team

           Red/Yellow Cards                                 Red/Yellow cards
  0 Red card and 18 yellow cards were             0 Red cards and 28 yellow cards were
                issued                          issued, which, in relation to the number of
                                                      matches played was identical.

                                            5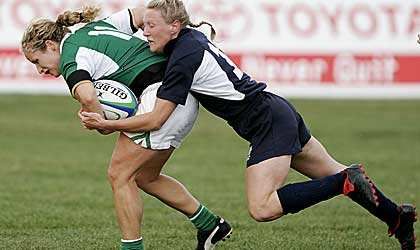
A STATISTICAL REVIEW AND ANALYSIS OF 2006 WOMEN’S RWC

       FINAL STANDINGS

           Team          Position

         New Zealand       1st

         England           2nd

         France            3rd

         Canada            4th
         USA               5th

         Scotland          6th

         Australia         7th

         Ireland           8th

         Spain             9th

         Samoa             10th
         Kazakhstan        11th
         South Africa      12th

                     6
A STATISTICAL REVIEW AND ANALYSIS OF 2006 WOMEN’S RWC

                            Round One
                            31/08/2006
   Spain         0 - 24         Scotland      Rachel Boyland
New Zealand     66 - 7          Canada        George Ayoub
Kazakhstan       5 - 20          Samoa         Clare Daniels
 Australia      68 - 12       South Africa     Nicky Inwood
  Ireland        0 - 43          France        Jenny Bental
  England       18 - 0             USA         Lyndon Bray
                           Round Two
                            04/09/2006
New Zealand      50 - 0          Samoa       Malcolm Changleng
  Ireland        11- 24            USA        Christine Hanizet
Kazakhstan       17- 32         Scotland      Kerstin Ljungdahl
  England        74 - 8       South Africa     Sarah Corrigan
 Australia      10 - 24          France         Joyce Henry
   Spain         0 - 79         Canada        Simon McDowell
                           Round Three
                            08/09/2006
  Ireland        37 - 0       South Africa     Clare Daniels
   Spain        14 - 12          Samoa          Joyce Henry
 Australia        6 - 10           USA          Lyndon Bray
Kazakhstan       5 - 45         Canada         Kristina Mellor
New Zealand     21 - 0          Scotland        Debbie Innes
  England       27 - 8           France        George Ayoub
                           Round Four
                            12/09/2006
New Zealand     40 - 10          France      Malcolm Changleng
  England       20 - 14         Canada         Sarah Corrigan
 Scotland       11 - 10          Ireland        Nicky Inwood
   USA          29 - 12         Australia     Simon McDowell
  Samoa         43 - 10       South Africa      Lyndon Bray
   Spain        17 - 12       Kazakhstan          Kim Smit
                           Finals Day 1
                            16/09/2006
South Africa     0 - 36       Kazakhstan      Dana Teagarden
  Samoa          5 - 10           Spain         Jenny Bental
  Ireland       14 - 18         Australia    Malcolm Changleng
                           Finals Day 2
                            17/09/2006
 Scotland        0 - 24            USA          Clare Daniels
  France         17 - 8         Canada         Sarah Corrigan
New Zealand     25 - 17         England       Simon McDowell

                                7
A STATISTICAL REVIEW AND ANALYSIS OF 2006 WOMEN’S RWC
Women’s Rugby World Cup 2006
STATISTICAL REVIEW AND MATCH ANALYSIS
SCORING
The following tables show the total points scored in the 30 matches, the
make-up of such points and the average per game.
It should be noted that
• There were almost six times as many tries as penalty goals
• tries accounted for 76% of all points
Av. per game 2006 2002
Score Total
Points Scored 1,179 Points 39 40
Tries 6.0 5.7
Tries 179
Penalty Goals 1.0 2.3
Conversions 94 Drop Goals 0.03 0.03
(success rate) (53%)
Penalty Goals 31
(success rate) (54%)
Drop Goals 1
8%
16%
76%
T rie s C o nv e rs io ns
P e na lt y G o a ls D ro p G o a ls
The importance of the try is reflected in the high percentage of matches won
by the team scoring the most tries. Of the 30 matches,
• the winning team scored the most tries on 80% of occasions (24
matches)
• both teams scored the same number of tries in 4 matches
• there was just one game where the winning team scored fewer tries but
won through penalty goals
8A STATISTICAL REVIEW AND ANALYSIS OF 2006 WOMEN’S RWC
Tries – most in one game 13 (Canada v Spain, England v South Africa)
Tries – least in one game 2 (Samoa v Spain)
Penalty goals – most in one game 2 (10 matches)
Penalty goals – least in one game 0 (10 matches)
The average number of points per game
was 39. This compares with 59 in the last
men’s World Cup. This difference of 20
points is accounted for almost entirely by
kicks. While the average number of tries
in each tournament was between 6 and 7,
in the men’s World Cup there were 4
times as many penalty goals, conversion
success rates were noticeably higher
(73% compared to 53%) while drop goals
were 15 times more likely.
What is clear therefore is that kicks at goal are less frequent – and less
successful - than in the men’s game. This also illustrates the fact that kicks
over a certain distance cause considerable difficulty to many women’s teams.
In 29 matches for example, only 8 penalty kicks at goal from within 15 metres
of the touchline were attempted. Only 3 succeeded and these were on the 15
metre line. The result was that there were many fewer penalty attempts at
goal – LESS THAN 2 PER GAME, compared with 6 per game in RWC2003.
As an illustration of penalty attempts being a far less favoured option in the
women’s game, 3 teams (Kazakhstan, Samoa and South Africa) were
awarded over 150 penalties in total and attempted just 2 kicks at goal
between them.
Finally – and as noted above - the winning team scored more tries than their
opponents in all but 5 of 30 matches – a percentage rate of 80%. This
compares with 81% in the RWC2003 – which is somewhat paradoxical given
that there were around 5 times as many penalties kicked in the last men’s
World Cup. All that does however is confirm what appears to now be a
universal truth –that however many penalties and are awarded and kicked, the
team scoring the most tries wins on around 40% of occasions.
9A STATISTICAL REVIEW AND ANALYSIS OF 2006 WOMEN’S RWC
TEAM SCORING
The tables below show the average number of points scored per game per
team, and the average number of points conceded per game per team:
Points Points
Team scored per WRWC Team conceded WRWC
game 2002 per game 2002
N Zealand 40 51 N Zealand 7 3
England 31 35 USA 9 11
Canada 31 21 England 11 11
Australia 23 20 Scotland 14 15
France 20 24 France 17 15
USA 17 31 Australia 18 10
Samoa 16 13 Samoa 18 8
Kazakhstan 15 19 Ireland 19 21
Ireland 14 10 Canada 22 24
Scotland 13 9 Kazakhstan 23 9
Spain 8 22 Spain 26 15
S Africa 6 n/a S Africa 52 n/a
The first column in the above table simply reflects the points scored – it does
not show however how effective each team was in scoring points in relation to
the possession that it obtained. A team may, for example, obtain little
possession but still manage to score a significant number of tries and points.
The following table considers this and attempts to show how successful each
team was in converting possession into tries. This was done by adding
together the time each team was in possession of the ball in all the matches it
played and then dividing it by the number of tries scored. The result then gave
a rate of try scoring with New Zealand, for example, scoring a try every 2m 56
seconds. The table also shows the number of tries scored in each game. (*It
should be noted that the try scoring rate excludes Australia’s game with
South Africa since the lack of a visual record of the game has precluded a
calculation of each team’s possession being made)
10A STATISTICAL REVIEW AND ANALYSIS OF 2006 WOMEN’S RWC
Individual Total tries
Team matches (no. of scored Try scoring rate
tries scored)
N Zealand 3,4,6,8,10 31 1 try every 2m 56secs
Canada 1,1,2,7,13 24 3m 12secs
England 2,2,3,4,12 23 4m 09secs
France 1,2,2,4,7 16 5m 06secs
USA 0,2,3,4,5 14 5m 18secs
Samoa 0,1,2,3,7 13 6m 04secs
Kazakhstan 1,1,2,3,6 13 6m 36secs
Ireland 0,1,2,2,6 11 7m 07secs
Scotland 0,0,1,4,4 9 9m 03secs
Australia* 0,1,2,2,10 15 14m 50sec*
Spain 0,0,1,2,2, 5 16m 04secs
S Africa* 0,0,1,2,2 5 18m 13secs*
*excludes match between Australia (10 tries)
and S Africa (2 tries).
The converse measure of success concerns the conceding of tries and while
an earlier table showed the average number of points conceded, the figures
do not show however how effective each team was in restricting points in
relation to the possession that their opponents obtained. A team may, for
example, concede very few tries in the face of considerable opposition
possession. The next chart attempts to give some sort of measurement to this
by illustrating how successful each team was in preventing their opposition
from converting possession into tries.
This was done by adding together the total time the team’s opponents were in
possession of the ball - and then dividing it by the number of tries conceded.
The result then gave a rate of try scoring by the opposition. As an illustration
of this, New Zealand conceded a try for every 14m 07 seconds possession
obtained by their opponents. In South Africa’s case, however, their
opponents scored one try for every 2m 13seconds possession.
11A STATISTICAL REVIEW AND ANALYSIS OF 2006 WOMEN’S RWC
Tries conceded Total tries
Team per match conceded Try conceded rate
N Zealand 0,0,1,2,2 5 1 try every 14m 07secs
England 0,1,1,2,4 8 8m 32secs
Canada 0,2,1,3,10 16 5m 12secs
Australia* 2,2,2,4,5 15 5m 05secs*
France 0,1,1,4,6 12 6m 41secs
USA 0,0,1,2,2 5 19m 14secs
Samoa 1,1,2,8,2 14 6m 36secs
Kazakhstan 0,2,3,4,7 16 4m 54secs
Ireland 1,4,7,0,2 14 6m 05secs
Scotland 0,2,3,3,3 11 7m 01secs
Spain 1,2,4,13,2 22 3m 54secs
S Africa* 6,6,7,10,12 41 2m 13secs*
*excludes match between Australia (10 tries)
and S Africa (2 tries).
WINNING MARGINS
While there were 4
matches with winning 30%
margins of over 50
points, overall winning 25%
margins were closer
in 2006 than in 2002 20%
as shown in the
adjacent chart. In 15%
2006 there were 4
matches with a 10%
margin in excess of
5%
51 points compared to
6 in 2002. Further, in 0%
2006, 20% of 0 to 5 6 to 10 11 to 20 21 to 30 31 to 40 41 to 50 51+
matches had a margin
2006 2002
of 5 points or less. In
2002, the equivalent
figure was 9%.
TIMES OF SCORES
In WRWC 2006, there was a clear difference between the time when tries
were scored and penalties kicked.
- 62% or almost two thirds of all penalty goals were kicked in the first half
- 41% of tries were scored in the first half and 59% in the second.
12A STATISTICAL REVIEW AND ANALYSIS OF 2006 WOMEN’S RWC
SOURCE OF TRIES
There were 179 tries scored in the 2006 tournament.
The teams scoring the tries obtained possession of the ball prior to the scoring
of the tries from a variety of sources as shown below.
Possession source 2006 - % of all tries
LINEOUT – OWN 26%
SCRUM – OWN 22
PENALTY/FREE KICK 15
OPP KICK 10
TURNOVER/ 13
OPP HANDLING ERROR
LINEOUT – OPP 5
SCRUM – OPP 4
RESTART – OWN 0
RESTART – OPP 5
ORIGIN OF TRIES
Tries originate from various parts of the pitch. The following map shows where
the attacking team obtained the possession from which they eventually s
HW 10m
TO TO 22m TO
OWN HALF 10m 22m TRYLINE
20% 8% 27% 45%
The above chart shows that 20% of tries were scored from within the scoring
team’s own half. This is almost 3 times more than 2002 when the comparative
figure was just 7%.
Canada however did not conform to this overall average. Twelve of their 24
tries – or 50% - started from possession obtained inside their own half.
Conversely, 10 of the USA’s 14 tries and 10 of Kazakhstan’s 13, started from
within 22m of the opponents goalline.
13A STATISTICAL REVIEW AND ANALYSIS OF 2006 WOMEN’S RWC
BUILD UP TO TRIES
Possession of the ball that leads to tries is obtained from a number of sources
– and they are shown above. More often than not, other actions – 2nd phases,
passes and kicks – then take place before the try is scored.
The tables below show
(a) the number of rucks and mauls (2nd phase) that preceded each of the
179 tries and
(b) the number of passes that preceded each of the tries.
PHASES Frequency Cum% PASSES Frequency Cum
% % %
0 34% 34% 0 20 20
1 29 63 1 12 32
2 20 83 2 12 44
3 7 90 3 13 57
4 5 95 4 13 70
5 2 97 5 9 79
6 2 99 6 8 87
7 ) 7 3 90
8 )1 100 8 1 91
9 ) 9 2 93
100% 100% 10 3 96
11 )
The above table shows that 83% of 12 )4
tries were preceded by 2 or fewer 13 )
2nd phases and 90% by 3 or fewer. 14 )
100% 100%
The data shown on these two charts The above table shows that 44% of
reflected a pattern that was relatively tries were preceded by 2 or fewer
passes and 57% by 3 or fewer.
consistent between the 12 teams with
the possible exception of Spain, 3 of
whose 5 tries did not contain a single
pass. The remaining two, contained 1
and 3 respectively.
With regard to the various players who
scored tries, this was another area
where there were noticeable
differences between the teams. This
was illustrated by comparing New
Zealand, Canada and England. While the backs of all three teams scored 18
or 19 tries, New Zealand’s forwards went on to score 13 tries compared to
Canada’s 5 and England’s 4.
14A STATISTICAL REVIEW AND ANALYSIS OF 2006 WOMEN’S RWC
Team Total tries Tries by Tries by
Forwards Backs
N Zealand 31 13 18
Canada 24 5 19
England 22 + 1 4 18
France 16 5 11
USA 14 6 8
Kazakhstan 13 7 6
Samoa 13 3 10
Ireland 11 5 6
Scotland 9 1 8
Australia* 5* 3* 2*
Spain 5 1 4
S Africa* 3* 2* 1*
Total 166 + 55 111
1 Pen Try
*excludes match between Australia (10 tries) and S Africa (2 tries).
KICKING SUCCESS
The conversion success rate was as follows:
Conversion Success 52%
20/23
22/31 17/27
8/33 14/23
4/16 2/14
15A STATISTICAL REVIEW AND ANALYSIS OF 2006 WOMEN’S RWC
The above chart shows the conversion success rate from various parts of the
pitch was as follows:
Within 5m of touch 20%
5m – 15m from touch 39%
Side of posts 67%
In front of posts 87%
The penalty goal success rate was as follows:
Penalty Goal Success 54%
0/0 3/9 4/8
0/0 8/14 5/6
0/1 5/11 4/5
Kicking % The adjacent table gives the kicking
success rate success rate of each participating team.
The percentages should however only be
Spain 70
regarded as indicative since success
Australia 67 depends on a number of factors. Some
tries are scored near the touchline –
Canada 59
others under the post. Further, when few
N Zealand 55 kicks at goal are taken, the success or
Scotland 53
failure of relatively few can have a
disproportionate effect on percentages.
England 53 Certain teams may take tap penalties,
scrums and lineouts instead of eminently
Ireland 50
kickable penalties. Other teams may
Samoa 50 chose to kick for goal whenever 3 points
are more or less guaranteed. The table
France 50 should therefore be looked at within such
USA 40 potential constraints.
Kazakhstan 39
S Africa 25
OVERALL 53%
16A STATISTICAL REVIEW AND ANALYSIS OF 2006 WOMEN’S RWC
MODE OF PLAY
BALL IN PLAY TIMES
29 of the 30 matches produced the following ball in play times. The omission
is the previously mentioned Australia v South Africa game.
The overall 50
ball in play 45
percentage 40
per game was 35
Ball in Play %
41%. 30
(2002 – 36%) 25
20
In 2002, there 15
were 6 10
matches with 5
less than 34% 0
1 5 9 13 17 21 25 29
b-i-p. This year
there were Match
none.
Ball in play time is, of course not shared equally between the two teams. On
the contrary, in this year’s tournament, there was a considerable difference in
the ball in play time achieved by the participating teams. Some had as much
as 40% more than others as shown in the following table.
England 19.04
Australia 18.31
New Zealand 18.13
Kazakhstan 17.08
France 16.19
Scotland 16.17
Team
Spain 16.04
Sam oa 15.47
Ireland 15.39
Canda 15.19
USA 14.53
South Africa 13.36
0 6 12 18 24
av. BIP Tim e per Gam e per Team in m ins and secs.
17A STATISTICAL REVIEW AND ANALYSIS OF 2006 WOMEN’S RWC
ACTIVITY CYCLES
Activity cycles reflect what happens when the ball is in play – it is either
passed, kicked or a ruck/maul is formed out of which ball is recycled. The
following table shows the average number of rucks/mauls, passes and kicks
per game:
2006 2002
RUCKS/MAULS (2nd phase) 131 98
PASSES 220 205
OPEN PLAY KICKS 43 40
KICK:PASS RATIO 1 to 5 1 to 5
RUCKS AND MAULS (2nd phase)
Total
Av. rucks/mauls per game 131 There were, on average, 131
(2002 – 98) rucks and mauls per game. This
is a 33% increase over the 2002
Most rucks/mauls in a game 159 tournament.
Least rucks/mauls in a game 98
Most by team in a game
106
The adjacent table also illustrates
AUSTRALIA the extent of the differences in
102 the level of contact sought by
AUSTRALIA some of the competing teams -
KAZAKSTAN 100
differences that are highlighted in
the next table.
Least by team in a game
30
SOUTH AFRICA
32
USA
30
FRANCE
The table below shows the average number of rucks and mauls per team per
game with every team except Canada showing a major increase from 2002.
18A STATISTICAL REVIEW AND ANALYSIS OF 2006 WOMEN’S RWC
AVERAGE NUMBER OF RUCKS/MAULS PER GAME
Team 2006 2002 % Increase over
2002
Australia 83 62 +34%
England 80 69 +16%
Kazakhstan 78 54 +38%
N Zealand 76 63 +21%
Samoa 65 44 +48%
Scotland 64 47 +36%
Canada 61 65 - 6%
Ireland 61 54 +13%
Spain 59 47 +26%
USA 55 33 +67%
France 55 35 +57%
S Africa 50 N/A n/a
The number of rucks/mauls (2nd phases) created by a team can however vary
enormously from match to match. The following table shows the average
number of rucks/mauls per country per game as shown above together with
the most in a game and the least in a game:
MOST & LEAST NUMBER OF RUCKS/MAULS IN A GAME PER TEAM
Av.rucks/mauls
Team per game Most in a game Least in a game
Australia 83 106 47
England 80 94 65
Kazakhstan 78 100 59
N Zealand 76 99 53
Samoa 65 76 52
Scotland 64 80 50
Ireland 61 73 46
Canada 61 68 47
Spain 59 77 48
France 55 67 39
USA 55 82 38
S Africa 50 78 30
19A STATISTICAL REVIEW AND ANALYSIS OF 2006 WOMEN’S RWC
The above data reflects the actual number of rucks/mauls created - so
Australia produced the most while South Africa created the least. This is not
altogther unexpected since Australia achieved notably more possession than
South Africa and therefore would have rucked (and passed) more. Just
because a team rucks a lot, therefore, does not necessarily mean that it is a
high rucking team. It could be simply because it obtains more ball.
Each team’s ball in play
therefore must be taken into
account. If a team’s
rucks/mauls are related to the
time they were in possession of
the ball then the extent of the
differences invariably change.
In the case of Australia and
Canada for example, while
Australia made just over
almost 40% more rucks and
mauls than Canada, it only rucked and mauled at a rate that was just over
12% more. What the following table shows therefore is the rate of activity of
each country - in other words, how many rucks/mauls they made every minute
of their possession. The table also includes the average number of rucks and
mauls shown in the previous table.
RATE OF R/M Av no. of rucks
Team i.e. no per minute and mauls
Australia 4.5 83
Kazakhstan 4.5 78
N Zealand 4.2 76
England 4.2 80
Samoa 4.1 65
Canada 4.0 61
Ireland 3.9 61
Scotland 3.9 64
USA 3.7 55
Spain 3.7 59
S Africa 3.7 50
France 3.3 55
20A STATISTICAL REVIEW AND ANALYSIS OF 2006 WOMEN’S RWC
Retention of possession at the breakdown
At the breakdown the team taking in the ball retained possession by either
winning the ball or being awarded a penalty on 87% of occasions. The
percentage success rates for each team were similar and were as follows:
Retention rate at
Team breakdown
N Zealand 92
Ireland 91
England 90
Kazakhstan 88
Scotland 88
USA 87
France 86
Samoa 85
Spain 85
Australia 84
Canada 83
S Africa 81
Overall 87%
PASSES
Total There were, on average,
220 passes per game. This
Av. passes per game 220 shows an increase of some
(2002 – 205) 7% over the 2002 average
of 205.
Most passes in a game 266
Least passes in a game 153
The adjacent tables also
Most passes by a team in a game illustrate the extent of the
Kazakhstan 189 differences in the level of
179 passing by the some of the
New Zealand competing teams -
178
New Zealand differences that are
highlighted in the following
Least passes by a team in a game tables.
Spain 50
53
France
55
USA
21A STATISTICAL REVIEW AND ANALYSIS OF 2006 WOMEN’S RWC
Av. no of passes % Increase/decrease
Team 2006 2002 over 2002
N Zealand 146 128 +14%
Kazakhstan 127 163 -22%
England 124 153 -19%
Australia 121 109 +11%
Samoa 112 88 +27%
Canada 110 122 +11%
Scotland 105 83 +27%
USA 103 79 +30%
France 97 95 +2%
S Africa 96 n/a n/a
Ireland 94 82 +15%
Spain 86 78 +10%
Overall 110 103 + 7%
The above data reflects the actual number of passes made - so New Zealand
produced the most while Spain created the least. This is not altogther
unexpected since New Zealand achieved more possession than Spain and
therefore would have passed more.
Just as in the case of rucks and
mauls, the extent of such
differences changes, however,
when ball in play is taken into
account. If a team’s passes are
related to the time they were in
possession of the ball, then the
extent of the differences can
change. The more ball in play
generally means more passes.
What the following table shows
therefore is the rate of passing of
each country. In other words, how
many passes they made for every minute of their possession. The table also
includes the average number of passes shown in the previous table. It shows
that the teams that passed the most also passed at a higher rate.
22A STATISTICAL REVIEW AND ANALYSIS OF 2006 WOMEN’S RWC
RATE OF PASSES Av no. of
Team i.e. no per minute passes
N Zealand 8.0 146
Kazakhstan 7.4 127
Canada 7.2 110
S Africa 7.1 96
Samoa 7.1 112
USA 6.9 103
England 6.5 124
Australia 6.5 121
Scotland 6.5 105
Ireland 6.0 94
France 5.9 97
Spain 5.4 86
What the above table shows is that there is not an overly close correlation
between numbers of passes and rate of passing. England, for example,
made some 30% more passes than South Africa, but South Africa passed
at higher rate than England.
When passes are further
analysed, and broken down into
passes made by the forwards,
passes made by the scrum half
and passes made by the 6
remaining backs, there have
been some very interesting
recent developments in the
international game at senior
level. Certain countries –
namely New Zealand and Wales – are noticeably more likely to use their
forwards as distributors of the ball. Proportionately, their forwards are making
noticeably more passes than other international teams.
The following table has been produced to see if these characteristics apply at
Women’s level and whether there are distinctive approaches being adopted
by the various teams. The results show that there are - with Kazakhstan
showing a profile that bears little relationship to the other 11 teams. While
France and Spain vary somewhat from the norm, Kazakhstan’s is
exceptional.
23A STATISTICAL REVIEW AND ANALYSIS OF 2006 WOMEN’S RWC
Percentages of (a) (b) (c)
passes made by Forwards Scrum half by backs
% % %
Kazakhstan 30% 30% 40%
Spain 18 41 41
France 18 45 37
South Africa 14 42 44
Ireland 14 51 35
USA 13 42 45
England 12 43 45
New Zealand 12 39 49
Samoa 12 43 45
Scotland 11 46 43
Canada 10 46 44
Australia 10 49 41
The above table also shows that New Zealand did not follow the pattern
adopted by their senior international men’s team.
KICKS
There were, on average, 41 kicks per game – one more than in 2005
Total
Av. Kicks per game 41
(2002 – 40)
Most kicks in a game 67
Least kicks in a game 32
Most kicks by a team in a game
39
Scotland
34
Samoa
31
England
Least kicks by a team in a game
9
Ireland
12
England
12
Ireland
12
Canada
24A STATISTICAL REVIEW AND ANALYSIS OF 2006 WOMEN’S RWC
The table also illustrates the extent of the differences in the level of kicking by
the various competing teams - differences that are highlighted in the following
tables.
Av no. of kicks Av no. of kicks
Team 2006 2002
Samoa 27 17
France 26 27
Australia 25 15
Spain 25 20
New Zealand 25 22
Scotland 23 23
The England 21 16 above
data USA 20 21 reflects
the actual
Canada 18 22
number of kicks
made - Kazakhstan 18 16 so
Samoa South Africa 17 n/a
Ireland 13 16
produced the most while Ireland made the least.
Just as in the case of rucks, mauls and passes, the extent of such differences
changes however, when ball in
play is taken into account. With
regard to kicks however – and
unlike rucks, mauls and passes,
more ball in play does not
necessarily mean more kicks.
What the following table shows
therefore is the rate at which
countries kicked - In other words,
the average number of kicks they
made for every minute they had
the ball. The table also includes
the average number of kicks
shown in the previous table. It shows that there was precious little change
to the order. The highest kicking teams also tended to have the highest
rate of kicking.
25A STATISTICAL REVIEW AND ANALYSIS OF 2006 WOMEN’S RWC
RATE OF
Team KICKS Av no. of kicks
i.e. no per
minute
Samoa 1.7 27
France 1.6 26
Spain 1.6 25
Australia 1.4 25
New Zealand 1.4 25
Scotland 1.4 23
USA 1.3 20
South Africa 1.3 17
Canada 1.2 18
England 1.1 21
Kazakhstan 1.1 18
Ireland 0.8 13
LINEOUTS
2006 2002
Av no. per game 31 28
Most in one game 40 41
Least in one game 18 12
Percentage competed 68% 74%
Possession retained 73% 73%
The above table gives the average number per game, the percentage
competed and possession retained. It can be seen that there while slightly
less were competed this year, there was little difference in the core figures
between 2006 and 2002. There were however differences when the figures
were broken down into team performance. Lineout success varied between
64%(Ireland) and 83% (England). What also varied was the number of times
a country’s lineout was contested by their opposition.
In Spain’s case for example, their opponents challenged their throw on only
46% of occasions which may go some way in explaining why their retention
level exceeded the average (but not by much). Other teams however found
their lineouts challenged far more frequently. New Zealand’s 81% retention
success came from an 80% challenge to their lineout – which was the highest.
England’s lineouts which had a closely similar success rate, however, were
challenged on just 51% of occasions.
26A STATISTICAL REVIEW AND ANALYSIS OF 2006 WOMEN’S RWC
Since it is likely that the relationship of challenges may, on occasions, have an
impact on successful retention, the table below gives each team’s lineout
success rate and also the percentage that were challenged by the opposition.
What the table shows is that, in general, the most successful lineout teams
were likely to be those the least challenged.
A further point on the lineout -
failing to retain possession
can be the result of not-
straight throws, knocks on and
conceding penalties and free
kicks. When these actions are
identified and isolated, the
remaining losses are the result
of effective opposition
challenge or overthrows. The
data shows that this can vary
enormously between
countries. Kazakhstan’s lineout for example was only effectively challenged 5
times while Ireland’s was effectively challenged 21 times. What the table also
shows – not unsurprisingly – is that, in general, the teams that are the most
successful on their own throw in are also likely to be the most effective
stealers of the ball on their opponents throw in. The number of such
opposition “steals” is shown in the sixth column of the following table.
% % Not Opposition Own
Team lineouts competed Straights steals steals
won
England 83 51 4 6 14
New Zealand 81 80 4 9 22
Kazakhstan 80 53 6 5 9
Canada 78 67 none 13 10
Australia 77 74 3 9 10
Samoa 77 69% 3 10 11
Spain 75 46 6 14 10
France 72 75 3 10 12
Scotland 66 68 9 20 10
USA 65 79 7 14 13
South Africa 65 83 5 12 13
Ireland 64 76 14 21 9
It can be seen from the table that a significant reason for Ireland being the
least successful team in retaining lineout possession was the number of times
the ball was not thrown in straight as well as the times it was successfully
challenged.
27A STATISTICAL REVIEW AND ANALYSIS OF 2006 WOMEN’S RWC
SCRUMS
2006 2002
Av no. per game 28 22
Most in one game 37 43
Least in one game 13 14
Possession retained 89% 95%
The above table shows that there were 28 scrums per game - 6 more than in
2002 - and the putting in team retained possession on 89% of occasions.
This 89% however is an average, with the differences between the competing
teams ranging from 81% to 95%. Loss of retention (11% on average) can
occur for a variety of reasons. Teams may concede penalties and free kicks
and, at the senior level, lose possession because of “use it or lose it”. Losing
the ball against the head (sometimes referred to as a tight head) is a relatively
rare occurrence at all levels of the game. In this year’s tournament, there were
just 40 in over 800 scrums or 1 in 20 or just one per game. Each country’s
retention rate is shown in the following table.
% scrums Pens/Fks Tightheads Tightheads
Team won conceded LOST WON
England 92 1 1 5
Kazakhstan 82 8 4 2
New Zealand 88 1 5 2
Canada 93 1 4 5
Australia 89 2 3 5
Samoa 87 4 2 2
Spain 94 2 1 7
France 95 none 3 4
Scotland 89 4 2 3
USA 90 2 3 1
South Africa 84 2 7 none
Ireland 81 4 5 4
Teams putting in the ball are also far less likely to be penalised than their
opponents. As an illustration of this – 60% of penalties and free kicks awarded
at a scrum went in favour of the putting in team with 40% going to the
opposition.
28A STATISTICAL REVIEW AND ANALYSIS OF 2006 WOMEN’S RWC
RESTARTS
• of ALL restarts - whether 50m or 22m – 73% were kicked long and 27%
short
• of ALL restarts, possession retained by the kicking team was 7% or 1 in
15
• of CONTESTABLE restarts, possession retained was 19% or just over 1
in 5
Of all 50m restarts, 73% were kicked sufficiently short that they were
contestable. The remaining kicks – or 27% - were kicked long and were
therefore a straight transfer of possession to the defending team. Not all
teams fell into this pattern however. England, for example, went against this
trend and kicked short 11 times out of 14. Canada, on the other hand, never
kicked short once in 22 restarts. The approach adopted by each team is
shown in the following table:
Kicked Kicked
Team Total long short
New Zealand 11 3 8
England 14 11 3
USA 15 7 8
Australia 17 1 16
Scotland 18 10 8
Samoa 19 1 18
France 21 8 13
Canada 22 none 22
Ireland 22 5 17
Kazakhstan 24 9 15
Spain 25 7 18
South Africa 32 3 29
29A STATISTICAL REVIEW AND ANALYSIS OF 2006 WOMEN’S RWC
PENALTIES
2006 2002
Av no. per game 24 33
Most in one game 46 46
Least in one game 13 14
The first table below shows that there were major differences between the
various teams when it came to conceding penalties. While Ireland conceded
just 41 penalties and free kicks in their 5 matches, Kazakhstan conceded 73
and Scotland 72.
Team Pens conceded
Kazakhstan 73
Scotland 72
USA 68
Spain 66
Samoa 64
France 61
South Africa* 58
New Zealand 52
England 48
Australia* 46
Canada 43
Ireland 41
* 4 matches only
What needs to be noted however is that such figures are absolute and do not
necessarily reflect the true degree of discipline or ill-discipline of a particular
team. The number of penalties can, for example, vary from match to match.
Some referees penalise more than others (in one game, there were 46
penalties and free kicks – in another, just 13) so that conceding 10 penalties
out of 15 could be construed as a less disciplined performance than
conceding 16 out of 30. A better and probably more accurate indicator,
therefore, is the proportion of penalties conceded by a team in all their
matches compared with their opponents. Both sets of figures - penalties and
proportions - are shown in the following table.
30A STATISTICAL REVIEW AND ANALYSIS OF 2006 WOMEN’S RWC
Proportion of Total number of
Team penalties conceded penalties conceded
Ireland 35% 41
Canada 43% 43
England 44% 48
Spain 47% 66
Scotland 48% 72
Australia 51% 46*
New Zealand 53% 52
Kazakhstan 53% 73
Samoa 55% 64
USA 58% 68
South Africa 58% 58
France 58% 61
This table illustrates the point made in the previous paragraph. Scotland, for
example, was the second highest penalised team in the tournament and
conceded some 40% more penalties than New Zealand. However – and
despite this - Scotland conceded fewer penalties than their opponents while
New Zealand conceded more. For whatever reason, Scotland’s matches
tended to see many more penalties than New Zealand’s matches.
Further investigation suggested an answer. It was related to groupings of
referees.
The analysis showed that the referees could be divided into 3 distinct groups:
1 male referees
2 female referees from Tier1 countries
3 female referees from Tier2+ countries
When individual matches were looked at, each group appeared to have a
distinctive penalty profile:
The male referees averaged 21 penalties per game
Tier 1 female referees averaged 23 penalties per game
Tier 2+ female referees averaged 33 penalties per game.
The conclusion from this was that countries being refereed by Tier 2+ female
referees were far more likely be playing in matches where there would be
around 50% more penalties – and therefore, as a consequence, be conceding
more penalties than other teams that were refereed exclusively by male
referees and Tier1 female referees.
This proved to be the case.
31A STATISTICAL REVIEW AND ANALYSIS OF 2006 WOMEN’S RWC
The four countries that conceded the least number of penalties (Ireland,
Canada, New Zealand and England) were not refereed once by a Tier2+
female referee. On the other hand, Scotland, Kazakhstan and Spain were
the only teams to be refereed twice by Tier2+ female referees and ended up
being three of the four most highly penalised teams in the tournament.
What the above paragraphs illustrate is that making judgments from raw data
can sometimes be misleading. Other variables need to be factored in so as to
come to a more robust or meaningful conclusion.
The next table shows the categories of offences penalised from which it will
be seen that there has been little difference between 2005 and 2002 with the
ruck/tackle area accounting for around half of all penalties.
Categories of offences 2006 2002
Ruck/tackle – on ground 52% 47%
Offside – backs/forwards/open play 18 19
Scrum 11 12
Lineout 4 5
Obstruction 5 3
Dangerous Tackles 4 3
+ 10m 2 5
Foul Play 1 1
Maul collapse 1 3
Misc 2 2
100% 100%
Crooked feeds 1 : 160
scrums
Of all penalties awarded, 70% went against the defending team. This was not
however consistent from referee to referee. In one game only 2 of 24
penalties went against the team in possession while in another, the
corresponding figure was 12 out of 31
As always, free kicks for crooked feeds remain elusive. In 2006 they
amounted to 1 in 160 scrums. Such an offence was penalised in only 4
matches.
There was a further area of interest with regard to penalties. It related to what
teams chose to do with the penalty if they did not take a kick at goal. Apart
from a scrum, the options are to kick for touch or to tap and go – and because
there were major differences between the teams and possibly one or two
surprises, the table below shows the various options taken by each team:
32A STATISTICAL REVIEW AND ANALYSIS OF 2006 WOMEN’S RWC
Tap Kick to Kick at scrum
Team penalty touch goal
Ireland 16 52 3 3
Canada 28 21 3 4
England 8 35 11 4
Spain 22 47 5
Scotland 15 53 6
Australia* 13 24 7 1
New Zealand 10 24 7 3
Kazakhstan 19 42 none 3
Samoa 38 13 1 1
USA 7 34 6 3
South Africa* 23 18 1
France 13 28 4
Total 212 391 54 22
* 4 matches only
This table showed that there were major strategic differences between the
various teams. Some teams tapped their penalties infrequently, the territorial
kick to touch being their favoured option. This was clearly the approach
adopted by New Zealand and England, the two finalists. Certain other teams
however utilised the tap penalty far more often. It can be seen form the table
that Samoa used it 3 times as frequently as kicks to touch while Canada also
favoured this option.
The differences between these 4 teams can also be expressed in percentage
terms – England and New Zealand chose the tap penalty option on 18% of
occasions while Samoa and Canada chose it on 61%.
The above table also illustrates just how few penalty goal attempts were made
– just 54 in the 29 recorded matches or less than 2 per game. Kazakhstan
never attempted a single penalty kick at goal throughout the entire
tournament.
33A STATISTICAL REVIEW AND ANALYSIS OF 2006 WOMEN’S RWC
RED AND YELLOW CARDS
There were no red cards and 18 yellow cards issued in the 29 matches.
(2002: one and 53). This was a huge reduction from 2002 with only a third as
many cards awarded in this year’s tournament.
The numbers of cards received by each team are shown below
Team Yellow Cards
Ireland 1
Canada none
England 1
Spain 3
Scotland 1
Australia* 2
New Zealand none
Kazakhstan 2
Samoa 2
USA 2
South Africa* 3
France 1
Total 18
The above 18 cards were issued for the following offences:
Reason Yellow Cards
Foul play 2
Dangerous tackle 2
Ruck/tackle 11
Offside - forward 2
Total 18
34A STATISTICAL REVIEW AND ANALYSIS OF 2006 WOMEN’S RWC
Women’s Rugby World Cup 2006
STATISTICAL REVIEW AND MATCH ANALYSIS SUMMARY
WRWC 2006 compared to WRWC 2002
WRWC WRWC
2006 2002
POINTS (average per game) 39 40
TRIES (average per game) 6.0 5.7
PENALTY GOALS (average per game) 1.0 2.3
% OF POINTS accounted for by tries 76% 72%
MATCHES WON by team scoring most tries 80% 94%
BALL IN PLAY % (average per game) 41% 36%
RUCKS/MAULS (average per game) 131 98
PASSES (average per game) 220 205
OPEN PLAY KICKS (average per game) 43 40
% OF TRIES CONVERTED 53% 39%
PENALTY GOAL (success %) 54% 63%
ORIGIN OF TRIES - Own Half (%) 20% 7%
SOURCE OF TRIES - Lineout (%) 26% 27%
BUILD UP TO TRIES – 2 or fewer Rucks/Mauls 83% -
BUILD UP TO TRIES - 3 Or Fewer Passes 57% -
LINEOUTS (average per game) 31 28
LINEOUTS percentage contested 68% 74%
LINEOUTS possession retained 73% 73%
SCRUMS (average per game) 28 22
SCRUMS possession retained 89% 95%
SCRUMS crooked feed free kicks 1 in 160 -
scrums
PENALTIES* (average per game) 24 33
PENALTIES percentage awarded at ruck/tackle 52% 47%
YELLOW/RED CARDS (Total) 0 red 1 red
18 yellow 53 yellow
35A STATISTICAL REVIEW AND ANALYSIS OF 2006 WOMEN’S RWC
Women’s Rugby World Cup 2006 – statistical summary
Goal Av
Team Av Points Av Points Total tries Total tries Kick Av poss Av ruck
scored conceded scored conceded success Per game rucks rate per
min
NZL 40 7 31 5 55% 18.13 76 4.2
ENG 31 11 23 8 53% 19.04** 80 4.2
FRA 20 17 16 12 50% 16.19 55 3.3
CAN 31 22 24 16 59% 15.19 61 4.0
USA 17 9 14 5 40% 14.53** 61 3.7
SCO 13 14 9 11 53% 16.17 64 3.9
AUS* 23 18 15* 15* 67% 18.31 83 4.5
IRE 14 19 11 14 50% 15.39 55 3.9
SPA 8 26 5 22 70% 16.04 59 3.7
SAM 16 18 13 14 50% 15.47 65 4.1
KAZ 15 23 13 16 39% 17.08 78 4.5
RSA* 6 52 5* 41* 25% 13.36 3.7
* 4 matches * 4 matches **5m 42
only only secs
missing
Ruck %of %of %of Av kick
Team retention Av Av pass rate Passes by Passes by Passes Av rate per
rate passes per min forwards scrum half by kicks min
backs
NZL 92% 146 8.0 12% 39% 49% 25 1.4
ENG 90% 124 6.5 12% 43% 45% 21 1.1
FRA 86% 97 5.9 18% 45% 37% 26 1.6
CAN 83% 110 7.2 10% 46% 44% 18 1.2
USA 87% 103 6.9 13% 42% 45% 20 1.3
SCO 88% 105 6.5 11% 46% 43% 23 1.4
AUS* 84% 121 6.5 10% 49% 41% 25 1.4
IRE 91% 94 6.0 14% 51% 35% 13 0.8
SPA 85% 86 5.4 18% 41% 41% 25 1.6
SAM 85% 112 7.1 12% 43% 45% 27 1.7
KAZ 88% 127 7.4 30% 30% 40% 18 1.1
RSA* 81% 96 7.1 14% 42% 44% 17 1.3
36A STATISTICAL REVIEW AND ANALYSIS OF 2006 WOMEN’S RWC
Opp Own Pen
Team Lineout l/out l/out Scrum Pens % Pens kicks at Yellow
success steals steals success conceded conceded goal cards
NZL 81% 9 22 88% 52 53% 7 0
ENG 83% 6 14 92% 48 44% 11 1
FRA 72% 10 12 95% 61 58% 4 1
CAN 78% 13 10 93% 43 43% 3 0
USA 65% 14 13 90% 68 58% 6 2
SCO 66% 20 10 89% 72 48% 6 1
AUS* 77% 9* 10* 89% 46 51% 7* 2*
IRE 64% 21 9 81% 41 35% 3 1
SPA 75% 14 10 94% 66 47% 5 3
SAM 77% 10 11 87% 64 55% 1 2
KAZ 80% 5 9 82% 73 53% 0 2
RSA* 65% 12* 13* 84% 58 58% 1* 3*
*4 *4 *4 *4 *4
matches matches matches matches matches
only only only only only
37You can also read