Study on Injection Molding Process Simulation and Process Parameter Optimization of Automobile Instrument Light Guiding Support
←
→
Page content transcription
If your browser does not render page correctly, please read the page content below
Hindawi
Advances in Materials Science and Engineering
Volume 2021, Article ID 9938094, 13 pages
https://doi.org/10.1155/2021/9938094

Research Article
Study on Injection Molding Process Simulation and Process
Parameter Optimization of Automobile Instrument Light
Guiding Support

 Hu Wu , Youmin Wang , and Mingyue Fang
 School of Mechanical Engineering, Anhui Polytechnic University, Wuhu, Anhui 241000, China

 Correspondence should be addressed to Youmin Wang; wymtlf@ahpu.edu.cn

 Received 29 March 2021; Revised 28 April 2021; Accepted 12 May 2021; Published 24 May 2021

 Academic Editor: Ashwini Kumar

 Copyright © 2021 Hu Wu et al. This is an open access article distributed under the Creative Commons Attribution License, which
 permits unrestricted use, distribution, and reproduction in any medium, provided the original work is properly cited.

 ®
 In the present study, Moldflow software is applied to simulate the injection molding of automobile instrument light guide
 bracket and optimize the injection gate position. In this regard, Taguchi orthogonal experimental design is adopted, and five
 processing parameters, the mold temperature, melt temperature, cooling time, packing pressure, and packing time, are considered
 as the test factors. Moreover, volume shrinkage and warping amount are considered as quality evaluation indices. Then range
 analysis and variance analysis are carried out to obtain the optimal combination of molding parameters with the volume shrinkage
 rate and the warpage amount. The grey correlation analysis was used to analyze the test results and obtain the optimal combination
 of volume shrinkage rate and amount of warping. Based on the performed simulations, it is found that the maximum volume
 shrinkage rate and the maximum amount of warping in the optimal design are 6.753% and 1.999 mm, respectively. According to
 the optimal process parameters, the injection molding of the automobile instrument light guide bracket meets the
 quality requirements.

1. Introduction pressure, warpage, shrinkage, cavitation, and fiber orienta-
 tion [1]. Moreover, Moldflow can be applied to simulate the
With the rapid development of the plastic industry, plastic injection molding process of plastic parts and predict
products are widely used in different automobile parts due to probable defects in plastic parts. Accordingly, the injection
their unique properties such as lightweight, low price, high molding process parameters can be optimized, which can
insulation, and reasonable corrosion resistance. Currently, reduce the production cost and improve the production
plastic parts have a large share in reducing car weight and efficiency, and effectively avoid the defects such as bubbles,
reducing manufacturing costs. However, inappropriate weld marks, shrinkage holes, and excessive warping de-
parameters in the injection molding process may result in formation in plastic parts [2].
numerous defects in the final plastic products. Therefore, it is Studies show that many parameters affect the forming
of significant importance to simulate and analyze each link process, and each parameter is interrelated and mutually
of the injection molding process before the production of restricted. Moreover, the influence degree of each parameter
plastic parts to obtain the optimized injection molding on the product quality is different [3]. In this regard, scholars
process parameters, control defects, ensure the product studied the influence of numerous molding parameters on
quality, and improve the production efficiency. the quality of plastic parts through orthogonal experimental
 ®
 Moldflow is the most widely applied commercial
software in simulating plastic injection molding. Currently,
 design methods or the combination of an intelligent algo-
 rithm and CAE (Computer Aided Engineering) technology
Moldflow Insight can be applied to simulate the whole [4]. Wang [5] used an orthogonal experimental design
injection molding process, including the flow, packing method to analyze the influence of molding parameters on
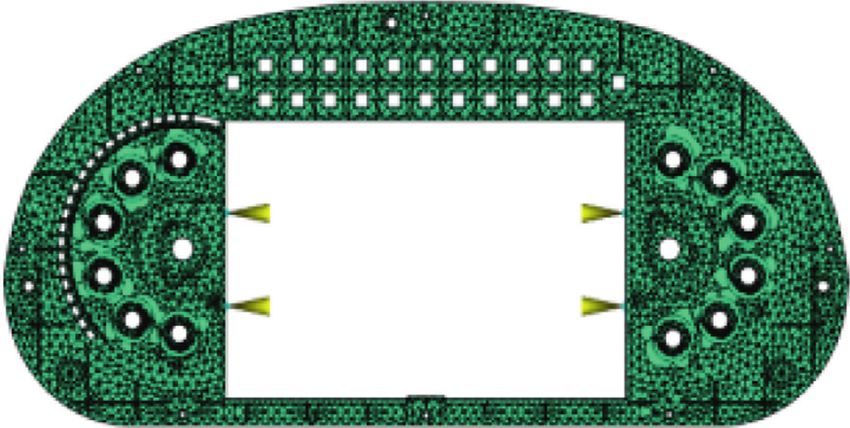
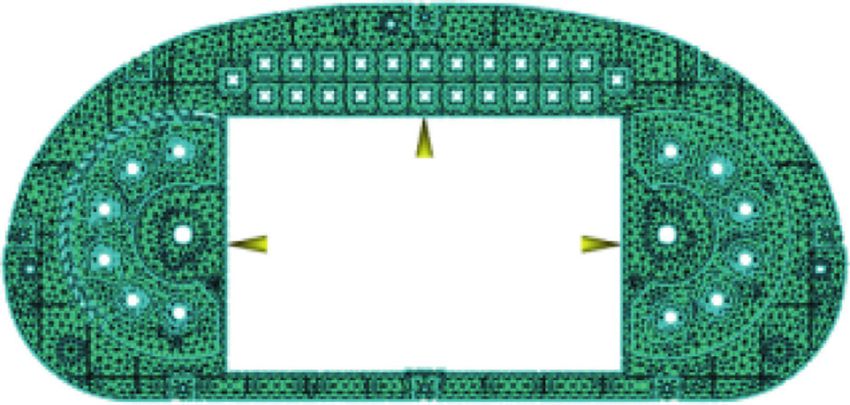
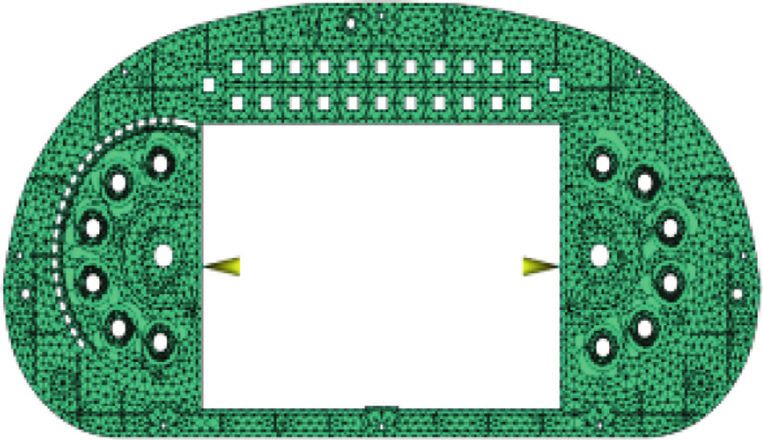
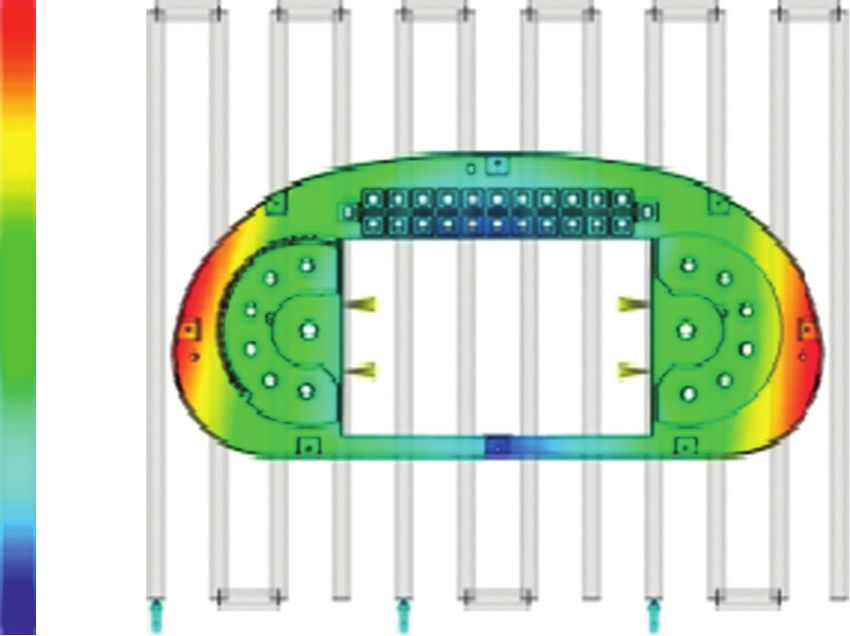
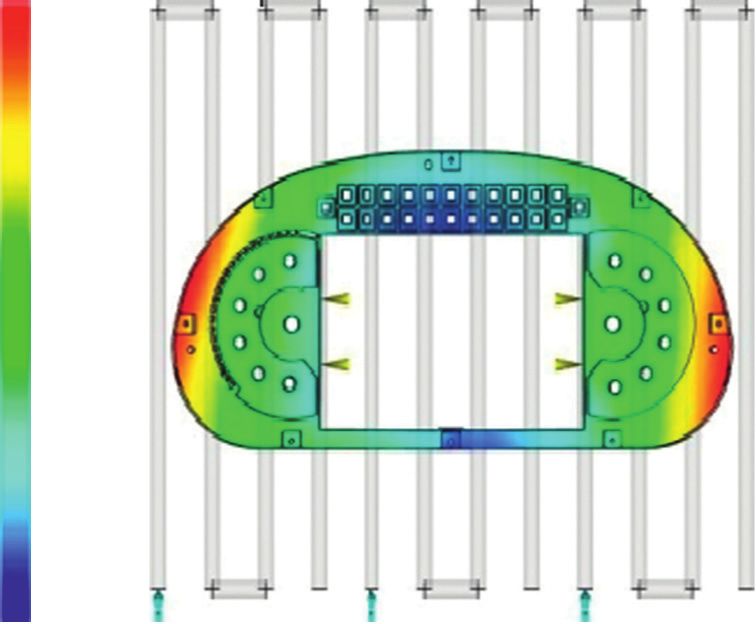
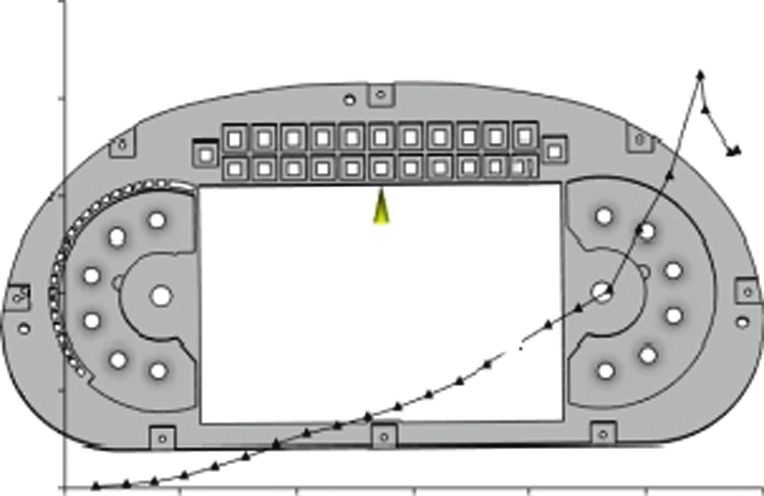
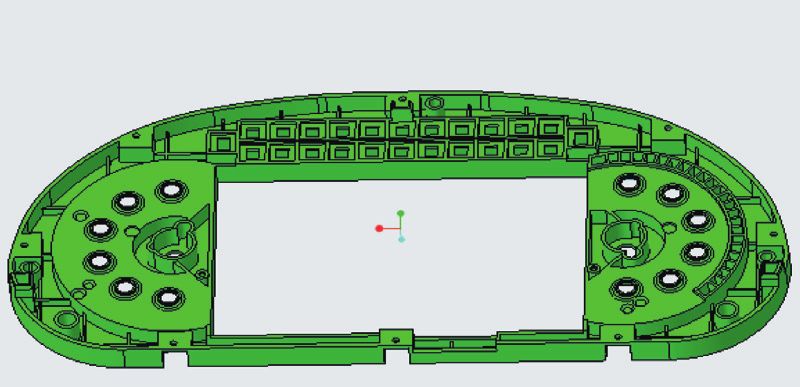
2 Advances in Materials Science and Engineering

the warpage of the wall switch bracket. Within the allowable volume shrinkage rate and the warping of the part during the
range, the process parameters were taken as 4 levels and 5 molding process should be minimized.
factors, and the optimal process parameters were found
through the range analysis. Tang et al. [6] took volume
 2.2. Finding the Optimal Gate Location. The optimal gate
shrinkage rate and amount of warping as quality evaluation
 location area recommended by the optimal gate matching
indices and established a response surface model between
 should be combined with the structural characteristics of the
molding parameters and quality evaluation indices to op-
 plastic part. Figure 2 reveals that the recommended optimal
timize affecting parameters. Jing et al. [7] optimized the
 gate position is on the part surface. However, the shape of
process parameters by Moldflow and Taguchi orthogonal
 automobile instrument light guide bracket is complex, and
test methods and obtained the influence of process pa-
 there are many cavities and ribs at the bottom, so the gate
rameters on the warpage and shrinkage mark. Kumar et al.
 position cannot be on the part surface. After synthesizing these
[8] studied the influence of process parameters on the in-
 points, four gate schemes are preliminarily considered. Figure 3
jection molding of PMC cam bushing and optimized the
 shows the gate positions of each scheme, where Figures 3(a)–
process parameters to improve the cam bushing quality. The
 3(d) correspond to gate schemes I, II, III, and IV, respectively.
design was carried out according to the Taguchi orthogonal
 Then Moldflow software is applied to simulate and
test, while the optimization was carried out through the grey
 analyze the four configurations and compare the corre-
correlation analysis and response data. Hentati et al. [9] used
 sponding filling times, flow front temperatures, clamping
Taguchi orthogonal test to conduct injection molding ex-
 forces, and weld line filling results. Finally, the optimal gate
periments with 4 factors and 3 levels through the statistical
 position can be determined, which can reduce the mold
design method. To this end, they employed the Moldflow
 revising expenses and improve the quality of the parts.
software in the simulation and analysis and obtained the
optimal process parameters accordingly. It was found that
the optimal combination parameters provide better shear 2.2.1. Filling Time. In the injection molding process, the
stress for injection molding of PC/ABS parts. Mukras et al. filling time is defined as the required time for the molten
[10] determined the optimal molding process parameters to plastic to fill the whole cavity. In this regard, Moldflow is
minimize the molding defects through experimental mul- used to analyze the four configurations. Figure 4 shows the
tiobjective optimization and then studied the warpage and filling time of different schemes.
volume shrinkage of the product quality.
 In the present study, the automobile instrument light
 2.2.2. Flow Front Temperature. The flow front temperature
guide bracket is considered as the research object. In this
 is defined as the temperature of the intermediate material
regard, the mold gate and cooling systems are simulated by
 flow when the molten plastic is filled to a certain node. This
Moldflow software to obtain the optimal gate position. Then
 temperature can be considered as the intermediate tem-
the range analysis and variance analysis are carried out to
 perature of the section [11]. Figure 5 presents contours of the
optimize the molding process parameters, volume shrinkage
 flow front temperature for different gate configurations.
rate and amount of warping. Finally, the grey correlation
analysis is applied to process the test results and obtain the
optimal combination of the volume shrinkage rate and 2.2.3. Clamping Force. The maximum clamping force
warping. exerted on the mold by the injection molding machine is
 called the clamping force [12]. Figure 6 shows the clamping
2. Numerical Simulation of Injection Molding force of different gate configurations.
 Process of the Automobile Instrument Light
 Guide Bracket 2.2.4. The Welding Line. In order to ensure the appropriate
 appearance and good strength of the molded plastic part, the
Prior to the numerical simulation of injection molding, it is number and length of the welding lines should be mini-
necessary to establish a 3D model of parts, determine op- mized. Moreover, the welding wires are not allowed in places
timal gate position, and simulate the gating system and the with stress concentration or visible areas [13]. Figure 7 shows
cooling system. the welding wiring of different gate configurations.
 The simulation results of filling time, flow front tem-
 perature, clamping force, and weld line of the four con-
2.1. Establishment of the 3D Model for Light Guide Bracket of
 figurations are summarized in Table 1.
the Automobile Instrument. In this section, Creo is used to
 It is found that configuration 4 with four gates has the
draw the 3D model of the light guide bracket of the auto-
 lowest clamping force, so this gate position is selected as the
mobile. Figure 1 shows that the part shape is complex, and
 optimal configuration.
there are many cavities and strong ribs at the bottom. The
overall dimension of the part is 367 mm × 169 mm × 25 mm,
and a 2.5 mm thick wall is evenly distributed around the 2.3. Simulation and Analysis of Injection Molding Process of
part. It should be indicated that the bracket should fit with the Automobile Instrument Light Guide Bracket. After de-
the lower PCB board and the top plate, so it is necessary to termining the material, gate position, main channel, shunt
provide a good flatness in the bracket. Consequently, the channel, and cooling system of the automobile instrument
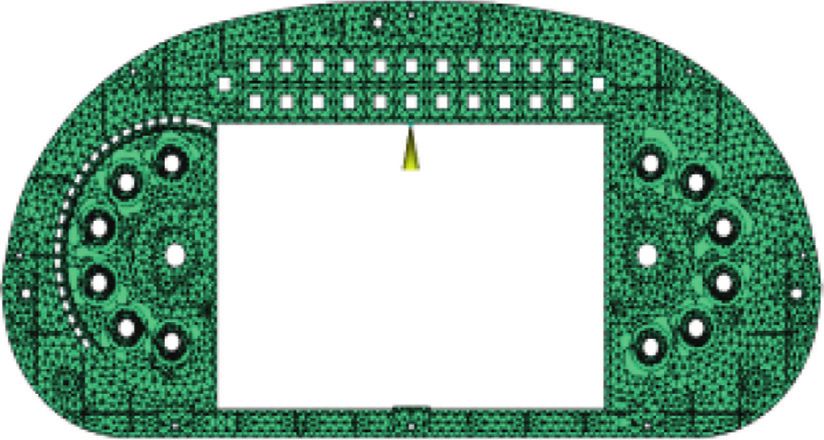
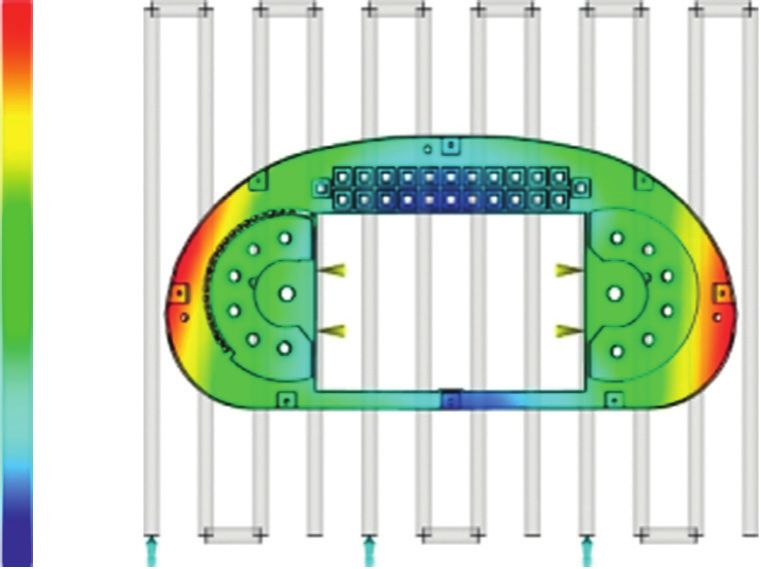
Advances in Materials Science and Engineering 3

 (a) (b)

 Figure 1: 3D model of automobile instrument light guide bracket: (a) front view and (b) the reverse view.

 The best gate position
 = 1.000
 Best

 Worst
 Figure 2: Cloud chart of optimal gate matching.

 (a) (b)

 (c) (d)

 Figure 3: Configurations of four gate locations.

light guide, the molding process parameters are set to an- 3. Design of the Taguchi Orthogonal
alyze the molded product. Figures 8 and 9 show contours of Experiment of the Molding
the volume shrinkage rate and the warping, respectively.
 Process Parameter
 It is observed that the volume shrinkage rate of the edge
part is large, and the volume shrinkage rate is small near the During the injection molding process, many factors affect
sprue. This is because the edge is far from the sprue position, the part warpage. Studies show that, among all affecting
leading to a weak packing pressure. The performed analysis parameters, the molding parameter is one of the important
shows that the maximum volume shrinkage rate and factors. Generally, the process parameters can be optimized
warping are 11.82% and 2.081 mm, respectively. by performing a continuous trial and repair process on the
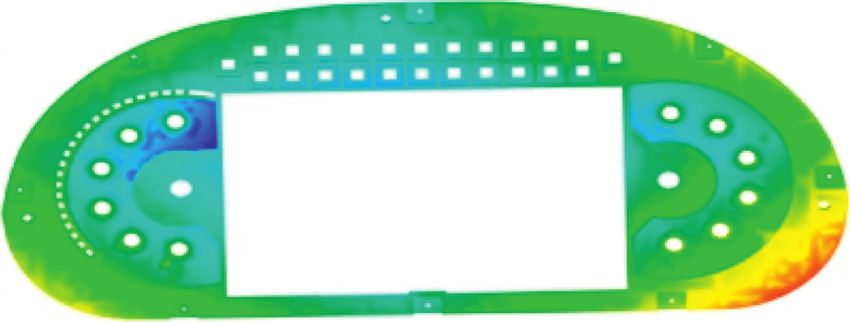
4 Advances in Materials Science and Engineering

 Filling time Filling time
 = 1.444 (s) = 1.291 (s)
 (s) (s)
 1.444 1.291

 1.083 0.9684

 0.7218 0.6458

 0.3609 0.3228

 0.0000 0.0000
 (a) (b)
 Filling time Filling time
 = 1.304 (s) = 1.055 (s)
 (s) (s)
 1.304 1.055

 0.9776 0.7915

 0.6518 0.5276

 0.3259 0.2638

 0.0000 0.0000
 (c) (d)

 Figure 4: Filling times of the part with different gate locations.

 Flow front temperature Flow front temperature
 = 268.6 (°C) = 266.6 (°C)
 (°C) (°C)
 268.6 266.6

 267.7 263.8

 266.7 261.1

 265.8 258.3

 264.9 255.6
 (a) (b)
 Flow front temperature Flow front temperature
 = 266.0 (°C) = 280.8 (°C)
 (°C) (°C)
 266.0 280.8

 260.9 278.9

 255.9 277.1

 250.9 275.2

 245.8 273.4
 (c) (d)

 Figure 5: Flow front temperature of four gate configurations.

die, which cannot meet the requirements of modern designs 3.1. Design of Taguchi Orthogonal Test for Automobile In-
[14]. In this section, it is intended to use the Taguchi or- strument Conduit Bracket. Taguchi orthogonal test index
thogonal experimental design method to study the influence refers to the effects that should be considered during the test.
of molding parameters on volume shrinkage rate and The volume shrinkage rate and the bracket warping are the
warping, thereby optimizing the parameters. main influencing factors on the product surface quality and
Advances in Materials Science and Engineering 5

 125.0 Clamping force:XY graph 100.0 Clamping force:XY graph

 100.0 80.00

 75.00 60.00
 Tonne

 Tonne
 50.00 40.00

 25.00 20.00

 0.0000 0.0000
 0.0000 0.2500 0.5000 0.7500 1.000 1.250 1.500 0.0000 0.2500 0.5000 0.7500 1.000 1.250 1.500
 Time (s) Time (s)
 (a) (b)
 100.0 Clamping force:XY graph 125.0 Clamping force:XY graph

 80.00 100.0

 60.00 75.00
 Tonne

 Tonne

 40.00 50.00

 20.00 25.00

 0.0000 0.0000
 0.0000 0.2500 0.5000 0.7500 1.000 1.250 1.500 0.0000 10.00 20.00 30.00 40.00 50.00
 Time (s) Time (s)
 (c) (d)

 Figure 6: Clamping force of different gate configurations.

 Welding line Welding line
 = 135.0 (°C) = 135.0 (°C)
 (°C) (°C)
 135.0 135.0

 101.4 101.3

 67.74 67.54

 34.10 33.81

 0.4721 0.0749

 (a) (b)
 Welding line Welding line
 = 135.0 (°C) = 135.0 (°C)
 (°C) (°C)
 135.0 135.0

 101.3 101.4

 67.54 67.73

 33.81 34.10

 0.0835 0.4675
 (c) (d)

 Figure 7: Welding line of different gate configurations.
6 Advances in Materials Science and Engineering

 Table 1: Simulation results of the four configurations.
 Temperature difference
Gate number/a Filling time/s Clamping force/kN Characteristics of welding line
 at the flow front/°C
I 1.444 3.7 1059
 The number of pieces is more and the length is larger
II 1.291 11 907
III 1.304 20.2 821.2
 The number is less and the distribution is reasonable
IV 1.055 7.4 1060

 Volume shrinkage molding parameters on the volume shrinkage rate and the
 Time = 30.00 (s) amount of warping and obtain the optimal combination of
 (%) molding parameters corresponding to two groups of ex-
 11.82
 perimental indices. Table 2 presents the process parameters
 8.910 in the simulations. Based on the principle of Taguchi’s or-
 thogonal test, an orthogonal test table L32 (54 ) was estab-
 6.003 lished, and combinations of 32 process parameters in the
 table were analyzed through the Moldflow software. Ac-
 3.097 cordingly, 32 groups of volume shrinkage rate and part
 warping were obtained, as shown in Table 3.
 0.1898

 Figure 8: Volume shrinkage contour.
 3.2. Data Analysis of the Taguchi Orthogonal Test for Light
 Guide Bracket of the Automobile Instrument. In this section,
Scale factor = 1.000 the range and variance analysis were carried out on the
 Deformation, all effect deformation orthogonal test data of Taguchi. It should be indicated that
 (mm)
 2.081 the influence trend of the test factors on the test indices can
 be obtained from the range analysis, while the variance
 analysis yields the influence degree of the former on the
 1.657
 latter parameters [16].
 The obtained parameters by the Taguchi orthogonal test
 are the optimal parameter factors, and the ratio between the
 main effect and error effect is the signal-to-noise ratio, which
 1.232 can be calculated through the following expression:
 S
 η� , (1)
 N
 0.8071
 where η, S, and N are the signal-to-noise ratio, main effect of
 the factor, and the error effect, respectively.
 Since the combination of signal-to-noise ratio and dif-
 0.3825 ferent response characteristics will produce different results,
 Figure 9: Warpage quantity contour. different signal-to-noise ratio expressions can be defined
 [17]. Then the signal-to-noise ratio of the small feature is
 calculated through the following expression:
assembly precision. Therefore, these two quality evaluation
 n
indices are selected as the testing indicators. ⎝ 1 y2 ⎞
 η � −10 log⎛ ⎠. (2)
 Test factors are parameters that have a certain influence n i�1 i
on the test indices [15]. It is worth noting that the setting of
molding parameters is the main factor that affects the The two test indices of the bracket are analyzed by the
volume shrinkage rate and the bracket warpage. Among all signal-to-noise ratio. The smaller the test index, the better.
molding parameters, the mold temperature, melt temper- Combined with the signal-to-noise ratio expression, it is a
ature, cooling time, packing pressure, and packing time have subtraction function. Therefore, the data in Table 4 can be
the highest influence on the test indices. Accordingly, these obtained by substituting the index values into equation (2)
factors are taken as the test factors. The Moldflow analysis by adopting its signal-to-noise ratio with small expected
results show that the maximum injection pressure required characteristics.
in the filling process is 101.5 MPa. For range analysis, in order to investigate the influence
 In the present study, these parameters are selected as the trend of various molding process parameters on the test
experimental factors of the orthogonal table, where each indices, presented data in Table 4 are processed to obtain the
experimental factor takes four levels. Through the Taguchi mean value of the signal-to-noise ratio of each index. Table 5
orthogonal test, it is intended to investigate the influence of presents the obtained results in this regard.
Advances in Materials Science and Engineering 7

 Table 2: Level factor setting.
 Factors
Levels A B C D E
 Mold temperature/°C Melt temperature/°C Cooling time/s Packing pressure/MPa Packing time/s
1 55 250 10 40 5
2 65 260 15 50 10
3 75 270 20 60 15
4 85 280 25 70 20

 Table 3: Orthogonal design and results.
 Factors Indexes
Test number
 A B C D E Shrinkage rate (%) Amount of warping (mm)
1 55 250 10 40 5 10.81 2.081
2 55 260 15 50 10 8.19 1.991
3 55 270 20 60 15 7.68 1.936
4 55 280 25 70 20 7.493 1.905
5 65 250 10 50 10 7.740 2.029
6 65 260 15 40 5 11.35 2.002
7 65 270 20 70 20 7.105 1.930
8 65 280 25 60 15 8.261 1.991
9 75 250 15 60 20 6.758 1.991
10 75 260 10 70 15 7.710 1.952
11 75 270 25 40 10 12.01 1.951
12 75 280 20 50 5 12.56 1.850
13 85 250 15 70 15 6.950 1.978
14 85 260 10 60 20 7.662 1.954
15 85 270 25 50 5 12.01 1.883
16 85 280 20 40 10 12.55 1.931
17 55 250 25 40 20 6.756 2.025
18 55 260 20 50 15 7.368 1.992
19 55 270 15 60 10 9.315 1.921
20 55 280 10 70 5 12.56 1.712
21 65 250 25 50 15 6.984 2.018
22 65 260 20 40 20 7.000 1.985
23 65 270 15 70 5 12.00 1.784
24 65 280 10 60 10 12.56 1.893
25 75 250 20 60 5 10.81 1.958
26 75 260 25 70 10 8.730 1.928
27 75 270 10 40 15 8.565 1.962
28 75 280 15 50 20 7.963 1.938
29 85 250 20 70 10 8.242 1.968
30 85 260 25 60 5 11.37 1.885
31 85 270 10 50 20 8.293 1.948
32 85 280 15 40 15 8.354 1.937

 A is the mold temperature, B is the melt temperature, C highest, while the volume shrinkage is the minimum. On the
denotes the cooling time, D is the packing pressure, and E is other hand, when these parameters are set to 85°C, 280°C,
the packing time. Based on the discussed procedure, the 10 s, 70 MPa, and 5 s (hereafter called A4B4C1D4E1 pa-
signal-to-noise ratio of the minimum feature is adopted. It is rameters), the average warpage of the signal-to-noise ratio is
worth noting that the larger the signal-to-noise ratio, the the largest, while the warpage amount is the minimum. Then
smaller the corresponding test index. In other words, the the combination of these two groups of parameters is
larger the SNR, the smaller the volume shrinkage rate and simulated and analyzed through the Moldflow software.
warpage amount. Table 6 reveals that when the mold Obtained results are shown in Figures 10 and 11.
temperature, melt temperature, cooling time, packing Figures 10 and 11 show that the minimum volume
pressure, and packing time are set to 55°C, 250°C, 15 s, shrinkage rate for A1B1C2D4E4 parameters is 6.721% and
70 MPa, and 20 s (hereafter called A1B1C2D4E4 parame- the minimum amount of warping for A4B4C1D4E1 pa-
ters), the average shrinkage of the signal-to-noise ratio is the rameters is 1.763.
8 Advances in Materials Science and Engineering

Table 4: Signal-to-noise ratio of volume shrinkage rate and amount fa � g − 1. (5)
of warping.
 Signal-to-noise ratio of volume shrinkage rate and (4) Calculate the sum of squares of the average
Test number amount of warping. deviation:
 S/N shrinkage rate/% S/N amount of warping/mm
1 −20.677 −6.365 Sa � Sa . (6)
2 −18.266 −5.981 fa
3 −17.707 −5.738
4 −17.493 −5.598 (5) Finally, the influence degree P can be calculated in
5 −17.775 −6.146 the following form:
6 −21.100 −6.029
7 −17.031 −5.711
 Sa
 P� × 100%. (7)
8 −18.341 −5.981 Se
9 −16.584 −5.981
10 −17741 −5.810 For each factor, the ratio of the sum of squares of de-
11 −21.591 −5.805 viations to the sum of squares of total deviations in the
12 −21.980 −5.343
 analysis of variance reflects the influence of the processing
13 −16.840 −5.925
14 −17.687 −5.818
 parameters on the test indices [19]. Ij is the mean signal-to-
15 −21.591 −5.497 noise ratio of the volume shrinkage rate at a certain level of a
16 −21.973 −5.716 test factor; Y is the signal-to-noise ratio of volume shrinkage
17 −16.594 −6.129 rate at all levels of all test factors which was taken as the
18 −17.347 −5.986 mean value. Similarly, the mean value of the signal-to-noise
19 −19.384 −5.671 ratio of warpage amount can be obtained. Table 6 presents
20 −21.980 −4.670 the obtained results from the variance analysis.
21 −16.882 −6.098 Table 6 shows that, among the studied parameters,
22 −16.902 −5.955 packing time has the greatest influence on the volume
23 −21.584 −5.028 shrinkage rate and accounts for about 75.2% of the total
24 −21.980 −5.543
 shrinkage rate. It is found that as the packing time increases,
25 −20.676 −5.836
26 −18.820 −5.702 the volume shrinkage rate gradually decreases. On the other
27 −18.655 −5.854 hand, the melt temperature has a greater influence on the
28 −18.022 −5.747 volume shrinkage rate, and as the melt temperature de-
29 −18.321 −5.881 creases, the volume shrinkage rate gradually decreases too.
30 −21.115 −5.506 Moreover, the effects of the mold temperature, cooling time,
31 −18.374 −5.792 and packing pressure on the volume shrinkage rate are
32 −18.438 −5.743 almost the same. The higher the mold temperature, the
 greater the volume shrinkage rate. The volume shrinkage
 rate decreases first and then increases with the increase of the
 For analysis of variance, the influence trend of test cooling time. As the packing pressure increases, the volume
factors on indices was processed by analysis of variance [18]. shrinkage rate fluctuates.
This analysis is conducted in five steps as follows: It is also found that the cooling time is the most im-
 portant factor to the warpage amount. With the increase of
 (1) Calculate the sum of partial squares of each test the cooling time, the warpage amount increases first and
 factor through the following expression: then decreases. The second effective factor is the melt
 n
 2
 temperature, accounting for 24.29% of the warpage amount.
 Sa � Ij − Y , (3) When the melt temperature increases, the warpage amount
 i�1 decreases gradually. The influences of the packing pressure
 and packing time on the warpage amount are similar, ac-
 where Ij and Y are the mean signal-to-noise ratio of counting for 14.33% and 12.66% of the warpage amount,
 the volume shrinkage rate at a certain level of a test respectively. When the packing pressure increases, the
 factor Y and the signal-to-noise ratio of volume warpage amount gradually decreases. Meanwhile, when the
 shrinkage rate at all levels of all test factors which was packing time increases, the warpage amount first increases
 taken as the mean value, respectively. and then decreases. Table 6 indicates that the die temper-
 (2) Calculate the sum of squares of the total deviation: ature has the lowest influence on the warpage amount. When
 n the mold temperature increases gradually, the warpage
 Se � Sai , (4) amount first increases and then decreases.
 i�1 Based on the Taguchi orthogonal test design, the in-
 fluence degree of various molding parameters on volume
 where Sai is the partial sum of squares of a test factor. shrinkage rate and warpage amount can be obtained. Ac-
 (3) Calculate the degree of freedom of test factors: cordingly, the optimal combination of molding parameters
Advances in Materials Science and Engineering 9

 Table 5: Mean signal-to-noise ratio of shrinkage and warpage.
Optimization objective Mean A B C D E
 I1 −18.681 −18.044 −19.359 −19.491 −21.338
 I2 −18.949 −18.622 −18.717 −18.780 −19.764
Shrinkage rate I3 −19.259 −19.490 −18.992 −19.184 −17.744
 I4 −19.292 −20.026 −19.053 −18.726 −17.336
 Y −19.004
 J1 −5.767 −6.045 −5.750 −5.949 −5.534
 J2 −5.811 −5.848 −5.763 −5.824 −5.806
Amount of warping J3 −5.76 −5.637 −5.771 −5.759 −5.892
 J4 −5.735 −5.543 −5.189 −5.541 −5.841
 X −5.738

 Table 6: Results of the variance analysis.
Optimization Sources of Sum of squares of Degrees of The mean ⌢square Influence degree P
objective variance deviations/Sa freedom/fa value/S a (%)
 A 0.255 3 0.085 1.84
 B 2.584 3 0.861 18.69
 C 0.211 3 0.070 1.53
Shrinkage rate
 D 0.378 3 0.126 2.73
 E 10.395 3 3.465 75.2
 Se 13.823 15
 A 0.0067 3 0.0022 1.05
 B 0.1546 3 0.0515 24.29
 C 0.3033 3 0.1011 47.66
Amount of warping
 D 0.0912 3 0.0304 14.33
 E 0.0806 3 0.0269 12.66
 Se 0.6364 15

 Volume shrinkage Scaling factor = 1.000
 Deformation, all effect deformation
 Time = 47.00 (s) (mm)
 (%) 2.001
 6.721

 1.607
 5.014

 1.213
 3.306

 0.8194
 1.599

 0.4254
 –0.1077
 (a) (b)

 Figure 10: Analysis results for A1B1C2D4E4 parameters.

can be obtained to minimize the volume shrinkage rate and this regard, grey correlation analysis is often used in the data
the warpage amount. processing of the Taguchi orthogonal test, which can
 transform a multiobjective problem into a single-objective
 problem so that it is beneficial to analyze the test data.
3.3. Multiobjective Optimization of Grey Correlation Analysis. The basic principle of the grey correlation analysis is to
The foregoing discussions demonstrate that range and determine the degree of correlation according to the simi-
variance processing are effective methods to analyze and larity degree of the curve geometry for each factor. The more
optimize a single factor. However, these methods cannot be similar the curve geometries, the higher the correlation
applied to optimize multiple objectives at the same time. In degree between factors.
10 Advances in Materials Science and Engineering

 Volume shrinkage Scaling factor = 1.000
 Deformation, all effect deformation
 Time=17.00 (s) (mm)
 (%) 1.763
 12.56

 1.605
 9.432

 1.212
 6.309

 0.8196
 3.185

 0.4268
 0.0618
 (a) (b)

 Figure 11: Analysis results for A4B4C1D4E1 parameters.

3.3.1. Evaluation Index Data Matrix. Based on the objective K �, k1 , k2 , k3 , . . . , kj , . . . km ,
analysis, the evaluation index matrix can be established with
evaluation indices. This matrix can be expressed in the
 kj � max Xi (j), X2 (j), . . . , Xj (j), . . . , Xn (j) ,
following form: (10)
 X1 (1) X1 (2) . . . X1 (j) . . . X1 (m) min(Δ min) + ρ• max(Δ max)
 ⎢
 ⎡
 ⎢ ⎤⎥⎥ ξi � ,
 ⎢
 ⎢
 ⎢
 ⎢
 ⎢ X2 (1) X2 (2) . . . X2 (j) . . . X2 (m) ⎥⎥⎥⎥⎥ Δ0,i (j) + ρ• max(Δ max)
 ⎢
 ⎢ ⎥⎥⎥
 ⎢
 ⎢
 ⎢ ⎥⎥⎥
 ⎢
 ⎢ . . . . . . . . . . . . . . . . . . ⎥⎥⎥ where Δ0,i (j) � |kj − Xi (j)| is the absolute value of the
 A �⎢
 ⎢
 ⎢
 ⎢
 ⎢
 ⎥⎥⎥, (8) reference sequence and comparison sequence,
 ⎢
 ⎢ X (1) X (2) . . . X (j) . . . X (m) ⎥⎥⎥
 ⎢
 ⎢
 ⎢ i i i i ⎥⎥⎥ min(Δ min) � min(min|kj − Xi (j)|) is the minimum ab-
 ⎢
 ⎢
 ⎢ ⎥⎥⎥
 ⎢
 ⎢
 ⎢ . . . . . . . . . . . . . . . . . . ⎥⎥⎦ solute value of each reference sequence and the comparison
 ⎣
 Xn (1) Xn (2) . . . Xn (j) . . . Xn (m) sequence, max(Δ max) � max(max|kj − Xi (j)|) denotes the
 maximum absolute value of each reference sequence and
where n is the number of tests, m is the number of evaluation comparison sequence, ξ i is the correlation coefficient of each
indices, and xi (j) is the raw data. evaluation index, and ρ is the resolution coefficient, which is
 usually set to 0.5 [20].
 Accordingly, the grey correlation coefficient matrix can
3.3.2. Normalizing the Evaluation Target Data. In order to be established in the following form:
ensure the equivalence of each index, it is necessary to
normalize the original sequence to eliminate its dimension. ξ 11 ξ 12 . . . ξ 1m
 ⎡⎢⎢⎢ ⎤⎥⎥
In the present study, the normalization is carried out ⎢⎢⎢ ξ 21 ξ 22 . . . ξ 2m ⎥⎥⎥⎥
through the following expression: ξ � ⎢⎢⎢⎢⎢ ⎥⎥⎥. (11)
 ⎢⎢⎢ . . .
 ⎣ . . . . . . . . . ⎥⎥⎥⎥⎦
 max Xi∀j(j) − Xi (j)
 X∗i (k) � , (9) ξ n1 ξ n2 . . . ξ nm
 max Xi∀j(j) − min Xi∀j(j)

where x∗i (k) denotes the index value after normalization,
max Xi∀j(j) is the maximum value of columns in the data 3.3.4. Determination of the Grey Correlation Degree.
matrix of evaluation index, min Xi∀j(j) is the minimum
value of columns in the data matrix of evaluation index, 1 m
 ci � ξ , (i � 1, 2, . . . , n). (12)
xi (j) is a vector in the data matrix of evaluation index, and m j�1 ij
Xob (j) is the target value of Xi (j).
 For evaluation of the grey correlation degree of auto-
 mobile instrument light guide bracket, the grey correlation
3.3.3. Determination of the Grey Correlation Coefficient degree of volume shrinkage rate and warpage amount can be
Matrix. The maximum value of each index can be con- obtained from equations (8) to (12), respectively. Then the
sidered as the reference sequence. multiobjective problem can be transformed into a single-
Advances in Materials Science and Engineering 11

 Table 7: Evaluation index matrix, correlation coefficient matrix, and grey correlation degree.
 Evaluation index Correlation
 Normalized matrix Grey correlation degree
Serial number matrix coefficient matrix
 Xi (1) Xi (2) X∗i (1) X∗i (2) ξi1 ξi2 ξ
1 10.81 2.081 0.302 0 0.417 0.333 0.375
2 8.19 1.991 0.753 0.244 0.669 0.398 0.5335
3 7.68 1.936 0.841 0.393 0.759 0.452 0.6055
4 7.493 1.905 0.873 0.477 0.797 0.489 0.643
5 7.740 2.029 0.830 0.141 0.746 0.368 0.557
6 11.35 2.002 0.208 0.214 0.387 0.389 0.388
7 7.105 1.930 0.940 0.409 0.893 0.458 0.6755
8 8.261 1.991 0.741 0.244 0.659 0.398 0.5285
9 6.758 1.991 1 0.244 1 0.398 0.699
10 7.710 1.952 0.836 0.350 0.753 0.435 0.594
11 12.01 1.951 0.095 0.352 0.356 0.436 0.396
12 12.56 1.850 0 0.626 0.333 0.572 0.4525
13 6.950 1.978 0.967 0.279 0.938 0.410 0.674
14 7.662 1.954 0.844 0.344 0.762 0.433 0.5975
15 12.01 1.883 0.095 0.537 0.356 0.519 0.4375
16 12.55 1.931 0.001 0.407 0.334 0.457 0.3955
17 6.756 2.025 1 0.152 1 0.371 0.6855
18 7.368 1.992 0.895 0.241 0.826 0.397 0.6115
19 9.315 1.921 0.559 0.434 0.531 0.469 0.5
20 12.56 1.712 0 1 0.333 1 0.6665
21 6.984 2.018 0.961 0.171 0.928 0.376 0.625
22 7.000 1.985 0.958 0.260 0.923 0.403 0.663
23 12.00 1.784 0.096 0.805 0.356 0.719 0.5375
24 12.56 1.893 0 0.509 0.333 0.505 0.419
25 10.81 1.958 0.302 0.333 0.417 0.428 0.4225
26 8.730 1.928 0.660 0.415 0.595 0.461 0.528
27 8.565 1.962 0.688 0.322 0.616 0.424 0.52
28 7.963 1.938 0.792 0.388 0.706 0.450 0.578
29 8.242 1.968 0.744 0.306 0.661 0.419 0.54
30 11.37 1.885 0.205 0.531 0.386 0.516 0.451
31 8.293 1.948 0.735 0.360 0.654 0.439 0.5465
32 8.354 1.937 0.725 0.390 0.645 0.450 0.5475

objective problem. Table 7 presents the warpage amount and Table 8: Range analysis of the grey correlation degree.
volume shrinkage rate data based on grey correlation Level A B C D E
analysis.
 1 0.578 0.576 0.534 0.496 0.466
 For range analysis of the grey correlation degree, the 2 0.553 0.546 0.540 0.546 0.484
mean value and the corresponding range values can be 3 0.524 0.527 0.546 0.528 0.592
calculated from the range analysis of the grey correlation 4 0.524 0.529 0.557 0.607 0.636
degree. Table 8 indicates that the larger the value of the Range 0.054 0.049 0.023 0.111 0.170
evaluation factor, the stronger the grey correlation and the Note: A is the mold temperature, B is the melt temperature, C is the cooling
higher the influence on the evaluation index. time, D is the packing pressure, and E is the packing time.
 Table 8 indicates that the highest value of the grey
correlation degree is obtained when the mold tempera-
ture, melt temperature, cooling time, packing pressure, found that the optimal volume shrinkage rate and warpage
and the packing time are set to 55°C, 250°C, 25 s, 70 MPa, amount are 6.753% and 1.999 mm, respectively.
and 20 MPa, respectively. These settings (hereafter called Based on the performed Taguchi orthogonal test and grey
A1B1C4D4E4) have the greatest influence on the volume correlation analysis, the optimal molding parameters can be
shrinkage rate and the warpage amount, which is the obtained. In this regard, Table 9 presents the optimal results.
optimal combination of process parameters. Then these Table 9 demonstrates that the Taguchi orthogonal test
molding parameters are introduced to the Moldflow and the grey correlation analysis are effective ways to op-
software and the simulation results are shown in timize the molding process parameters and obtain different
Figure 12. quality index values. It is found that the optimal volume
 Figure 12 shows that the grey correlation analysis is an shrinkage rate and warpage amount are 6.753% and 1.999%,
effective scheme to optimize the molding parameters. It is respectively.
12 Advances in Materials Science and Engineering

 Volume shrinkage Scaling factor = 1.000
 Deformation, all effect deformation
 Time = 37.00 (s) (mm)
 (%) 1.999
 6.753

 1.607
 5.059

 1.215
 3.365

 0.8227
 1.671

 0.4308
 –0.0235
 (a) (b)

 Figure 12: Analysis results of A1B1C4D4E4 parameter.

 Table 9: Comparison of quality evaluation indices of the Taguchi orthogonal test and the grey correlation degree.
 Process parameter Volume shrinkage Amount of warping
Index Influence factors
 combination (%) (mm)
Warpage amount analysis based on Taguchi
 C>B>D>E>A A1B1C2D4E4 6.721 2.001
orthogonal test
Volume shrinkage rate analysis based on
 E>B>D>A>C A4B4C1D4E1 12.56 1.763
Taguchi orthogonal test
Grey correlation analysis E>D>A>B>C A1B1C4D4E4 6.753 1.999
Note: A is mold temperature, B is melt temperature, C is cooling time, D is packing pressure, and E is packing time.

4. Conclusion are set to A4B4C1D4E1 (85°C, 280°C, 10 s, 70 MPa, and 5 s),
 the mean warpage signal-to-noise ratio is the maximum
In the present study, four gate configurations are prelimi- and the warpage is the minimum. Moreover, the minimum
narily proposed for the injection molding of the automobile volume shrinkage rate for A1B1C2D4E4 parameters is
light guide bracket. Then numerical simulations are per- 6.721% and the minimum warpage amount for
formed through the Moldflow software. Accordingly, filling A4B4C1D4E1 parameters is 1.763 mm. Through variance
time, flow front temperature, clamping force, and weld line analysis, it is found that the packing time is the molding
are analyzed and compared. It is found that, in the best parameter with the greatest influence on the volume
configuration, the filling time is 1.055 s, the temperature shrinkage rate accounting for about 75.2% of the total
difference of flow front is 7.4°C, the clamping force is shrinkage rate, and the cooling time has the greatest in-
1060 kN, the number of welding lines is low, and the weld fluence on the warpage amount. The performed simula-
distribution is reasonable. Finally, volume shrinkage and tions reveal that as the cooling time increases, the warpage
warpage are calculated as quality evaluation indices through amount increases first and then decreases. Through the
the simulation in the Moldflow software. The obtained re- Taguchi orthogonal test design, the influence degree of
sults show that the maximum volume shrinkage rate and the various molding parameters can be obtained on the volume
maximum warpage amount are 11.82% and 2.081 mm, shrinkage rate and warpage amount.
respectively. Finally, the range analysis of the grey correlation is
 The volume shrinkage rate and warpage amount of the carried out to optimize the volume shrinkage rate and
bracket are selected as experimental evaluation indices, and warpage amount simultaneously. Accordingly, it is found
different molding process parameters such as the mold that the largest grey correlation can be obtained when the
temperature, melt temperature, cooling time, packing processing parameters are set to A1B1C4D4E4 (55°C, 250°C,
pressure, and packing time are taken as experimental level 25 s, 70 MPa, and 20 MPa). The combination has the greatest
factors. Then the range analysis of the Taguchi orthogonal influence on the volume shrinkage rate and warpage
test is conducted, where the obtained results show that amount, which is the optimal combination of process pa-
when the process parameters are set to A1B1C2D4E4 (55°C, rameters. Then the combination of processing parameters is
250°C, 15 s, 70 MPa, and 20 s), the mean shrinkage signal- analyzed, and the optimal volume shrinkage rate and
to-noise ratio is the maximum and the volume shrinkage is warpage amount were obtained as 6.753% and 1.999 mm,
the minimum. Meanwhile, when the process parameters respectively.
Advances in Materials Science and Engineering 13

Data Availability [13] Yi Liu, Research on Improving Weld Line of Products by Hot
 Runner Sequential Injection Molding, South China University
The data used to support the findings of this study are in- of Technology, Guangzhou, China, 2009.
cluded within the article. [14] J. Wang, P. Wang, and F. Zhu, “Application status and re-
 search progress of injection mold CAE technology,” Inner
 Mongolia Petrochemical Industry, vol. 15, no. 8, pp. 5-6, 2005.
Conflicts of Interest [15] Y. Zhang and Y. Li, “Analysis of variance of orthogonal design
 for void grouting material at slab bottom,” Low Temperature
The authors declare that they have no conflicts of interest. Building Technology, vol. 35, no. 11, pp. 16–18, 2013.
 [16] I. Lizhen, Q. Liang, J. pan et al., “Optimization of molding
 process parameters of automobile gear lever based on or-
Acknowledgments thogonal test,” China Plastics, vol. 33, no. 7, pp. 50–56, 2019.
 [17] Y. Shi, W. fan, M. sang et al., “Study on optimization of power
This article belongs to the major projects of the University
 spinning parameters of connecting rod bushing based on
Synergy Innovation Program of Anhui Province (GXXT- signal to noise ratio and grey correlation analysis,” Foundry
2019-004) and the Teaching Research Project of Anhui Technology, vol. 38, no. 9, pp. 2261–2264, 2017.
Education Department (2019jyxm0229). [18] W. Meng, Application Research on Process Parameter Opti-
 mization of Automobile Top Cover Based on Taguchi Method
 and Finite Element Analysis, Shenyang University, Shenyang,
References China, 2017.
 [1] M. Yan, L. Liu, C. Huang, H. Geng, and X. Han, “CAE analysis [19] H. Wu, X. Qin, L. Yang et al., “Optimization of process
 of plastic handle based on moldflow,” China Shipping (Second parameters of plastic parts based on taguchi method,” In-
 Half ), vol. 2, no. 1, pp. 131-132, 2009. telligent Manufacturing, vol. 23, no. 7, pp. 35–37, 2016.
 [2] X. Li and L. Xiao, “Mould design and NC machining of [20] L. Chen and H. Wang, “Optimization of process parameters of
 beverage bottle based on Pro/E and master cam,” Packaging thin-walled asymmetric injection molded parts with one mold
 Engineering, vol. 35, no. 6, pp. 76–78, 2014. and two cavity by taguchi method,” Plastics Industry, vol. 40,
 [3] H. Yu, Research on Numerical Simulation of Injection Molding no. 11, pp. 50–53, 2012.
 of Thin-Walled Plastic Parts and Optimization of Molding
 Process Parameters, Zhejiang University of Technology,
 Hangzhou, China, 2008.
 [4] F. Beibei, Numerical Simulation and Process Optimization in
 Injection Mold Design, Hefei University of Technology, Hefei,
 China, 2016.
 [5] H. Wang, “Optimization of injection molding parameters
 based on orthogonal test method,” Shanghai Plastics, vol. 47,
 no. 2, pp. 58–62, 2019.
 [6] C. Tang, Q. Xia, and B. Zhang, “Hybrid optimization of in-
 jection molding process for instrument shell based on re-
 sponse surface model,” Plastics Industry, vol. 46, no. 6,
 pp. 37–40, 2018.
 [7] L. Jing, X. Guo, X. Yang et al., “Optimization of injection
 molding process parameters of automobile air conditioning
 shell mounting plate based on moldflow and taguchi or-
 thogonal test,” Journal of Lanzhou Institute of Technology,
 vol. 23, no. 3, pp. 76–78, 2016.
 [8] B. P. Kumar, P. Venkataramaiah, and J. S. Ganesh, “Opti-
 mization of process parameters in injection moulding of a
 polymer composite product by using gra,” Materials Today:
 Proceedings, vol. 18, no. Pt 7, pp. 4637–4647, 2019.
 [9] F. Hentati, H. Ismail, N. Masmoudi, and C. Bradai, “Opti-
 mization of the injection molding process for the PC/ABS
 parts by integrating taguchi approach and CAE simulation,”
 The International Journal of Advanced Manufacturing Tech-
 nology, vol. 104, no. 9–12, pp. 4353–4363, 2019.
[10] S. M. S. Mukras, H. M. Omar, and F. A. al-Mufadi, “Ex-
 perimental-based multi-objective optimization of injection
 molding process parameters,” Arabian Journal for Science and
 Engineering, vol. 44, no. 9, pp. 7653–7665, 2019.
[11] L. Wang, Research on Mold Design and CAE Application of
 Automobile Thin Wall Injection Parts, Jilin University,
 Changchun, China, 2010.
[12] X. Guo and G. Ma, “Design of injection mold for charger
 shell based on UG,” Mold Industry, vol. 39, no. 4, pp. 50–52,
 2013.
You can also read