Analysis of UCAS applications for 2012/13 admissions
←
→
Page content transcription
If your browser does not render page correctly, please read the page content below
Analysis of UCAS
applications for
2012/13 admissions

August 2012
Contents

1.   Introduction.................................................................................................................. 3
2.   Overall trends (all UK domiciled applicants) ................................................................ 5
3.   Trends in applicants by geographical measures of advantage .................................. 10
4.   Analysis of applications to selective universities ....................................................... 12
5.   Other areas of UCAS analysis ................................................................................... 19
6.   Other areas of potential interest ................................................................................ 20
7.   Findings ..................................................................................................................... 22

                                                                2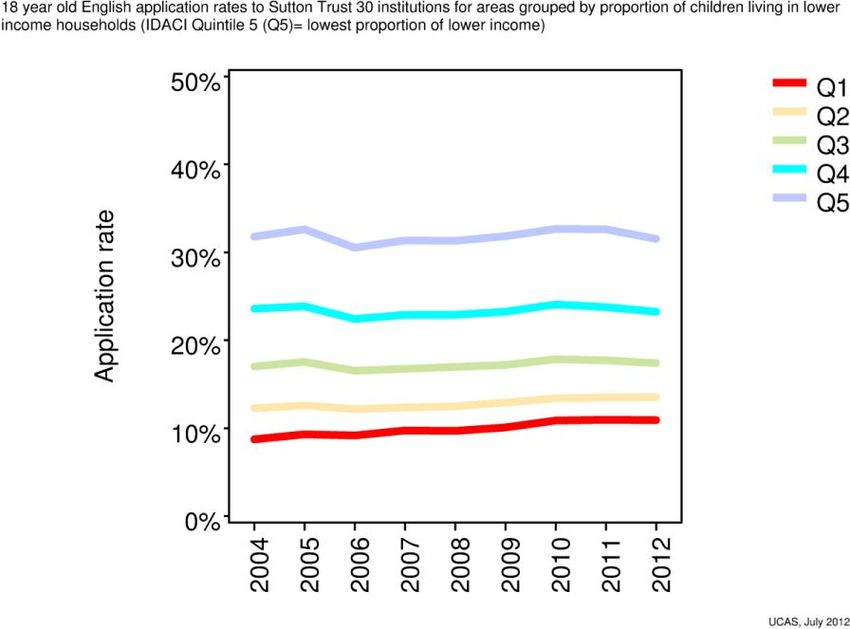
1. Introduction

i.       Background
In response to the increase in university fees in the UK from 2012, the Independent Commission
on Fees has been established to monitor the impact over the next three years. It will produce a
series of reports assessing the impact of the increase in fees on application and admissions trends
in universities, considering in particular the effect on young people from low and middle income
backgrounds.

At this stage, the Commission is analysing data on applications from UK domiciled subjects to
HEIs for admission in 2012. The Commission is extremely grateful to UCAS for their cooperation in
providing datasets to help with this phase of the Commission's work. Our aim is to complement
work being undertaken by UCAS but the interpretation and analysis in this report is our own and
independent of UCAS or any other organisation. The Commission will gather evidence from a
number of sources to support future phases of its work.

ii.      Student fees from 2012
From 2012, universities in England can charge up to £9,000 per year for undergraduate courses,
raising the cap from its 2011/12 level of £3,375. Universities wanting to charge more than £6,000
have to agree to put in place access measures, which will be assessed and monitored by the
Office for Fair Access (OFFA).

Students in Scotland attending Scottish universities do not pay fees. In 2011/12, students from
elsewhere in the UK had to pay £1,820 per year to study at a Scottish university but, from 2012,
these universities will be able to charge up to £9,000 for students from elsewhere in the UK.
Welsh universities can charge fees of up to £9,000, as in England, but the Welsh Assembly will pay
fee costs above £3,465 a year for Welsh students studying at any UK university.

At universities in Northern Ireland, tuition fees for students from Northern Ireland in 2012 will be
capped at £3,465, and will rise in line with inflation for the next four years. Fees for other UK
students will not be capped but the Northern Ireland Executive has said that fees are not expected
to exceed £9,000.

iii. The data
The Commission has independently analysed data (supplied by UCAS) for UCAS admission
cycles, 2009 to 2012 inclusive, in each case using information available at the major application
cut-off point in mid-January. This means that the datasets are comparable year on year, but they
do not include all applications made in each cycle. All UK domiciled applicants are included.
Alongside this analysis the Commission has reviewed longer term application trends produced by
UCAS using data sets covering the period 2004 to 2012. These data sets use applications data at
a different reference point of mid-March (each year) and use slightly definitions for some aspects
of the analysis (for example, age), but the Commission is satisfied that the overall conclusions
drawn here are not affected by these slight differences. UCAS published its findings on these data
sets in July 2012 in their report ‘How have applications for full-time undergraduate higher education
in the UK changed in 2012’ 1 (the ‘UCAS Report’), which is referred to further in this report.

1
    ‘How have applications for full-time undergraduate higher education in the UK changed in 2012’, UCAS
      Analysis and Research, July 2012. Report and underlying data for results available at
      http://www.ucas.com/about_us/media_enquiries/media_releases/2012/2012applicationsanalysis

                                                       3
The data covers all course types. The majority of applications relate to honours degrees, but other
course types such as foundation degrees and HNDs are also included.
Many of the comparisons in our independent analysis examine changes relative to 2010. Although
the UCAS report finds no indication that application rates in 2011 were affected by the pre-
announcing of the 2012 changes, we take this step to give a different perspective on the changes.
These comparisons also need to be seen in the context of varying year-on-year student population
sizes. For this reason the overall application trends are better analysed by looking at the longer
term application rate trends (using the 2002-09 data sets) which take the varying size of the cohort
populations into account.
This report examines both overall numbers of applicants and differentials between sub-groups. In
our analyses, we have principally considered two groups of applicants: those aged up to 19 at the
time of application, and those aged 20 or over. The UCAS report finds that, in terms of responses
to the 2012 changes, 18 year olds and over 19 year olds behave as two distinct groups. They base
their reporting around this with a focus on the 18 year old group who, having not had the
opportunity to apply to HE before, are a particularly sensitive indicator group. We have generally
taken a different approach and taken 18 year olds and 19 year olds together as a single ‘young’
group. We do this since it is a common measure of “young people” accessing HE used by the
Department for Business Innovation and Skills, and others, and because 19 year olds form a very
substantial share of total young applicants. In our view the group needs to be seen together as a
full description of the experience of young people. We understand why UCAS want to wait until
there is another year of applications data before calculating cohort application rates on this basis,
but have decided to use 18 and 19 year olds together as an intermediate measure in the
meantime.
It is also worth noting that although UCAS data covers the overwhelming majority of applications to
higher education, it does not cover all UK institutions (or institutions overseas) although the relative
number of these applications will be very small.
42. Overall trends (all UK domiciled applicants)
i. Applicant numbers by country of domicile and age group
Table 2.1: Number of applicants by country of domicile and year (January deadline)
Year
Country Age 2009 2010 2011 2012
England Up to 19 262,728 298,155 301,695 (1.2%) 276,629 (-7.2%)
20 and
82,378 123,293 124,513 (1.0%) 107,541 (-12.8%)
over
Total 345,106 421,448 426,208 (1.1%) 384,170 (-8.8%)
NI Up to 19 12,771 13,875 14,110 (1.7%) 13,600 (-2.0%)
20 and
3,168 4,560 5,020 (10.1%) 4,692 (2.9%)
over
Total 15,939 18,435 19,130 (3.8%) 18,292 (-0.8%)
Scotland Up to 19 22,635 26,619 26,686 (0.3%) 26,463 (-0.6%)
20 and
6,914 12,144 13,075 (7.7%) 12,706 (4.6%)
over
Total 29,549 38,763 39,761 (2.6%) 39,169 (1.0%)
Wales Up to 19 13,922 14,908 14,951 (0.3%) 14,667 (-1.6%)
20 and
4,406 5,897 6,338 (7.5%) 6,209 (5.3%)
over
Total 18,328 20,805 21,289 (2.3%) 20,876 (0.3%)
Total 408,922 499,451 506,388 (1.4%) 462,507 (-7.4%)
Note: Numbers in brackets are the percentage changes compared with 2010
Table 2.1 summarises the number of applications overall in the UK by age group. In all four
regions, the number of applicants peaked in 2011 (the last year before the increase in fees).
Overall increases were largely as a result of increased numbers of applicants aged over 19, where
there was a particularly sharp increase from 2009 to 2010.
Decline in total UK applicants
The 2012 application cycle saw a noticeable dip in the total number of applicants from the
comparable 2010 cycle of 7.4%. The comparison to 2010 is relevant since the 2011 cycle may
have been affected by applicant decisions made ahead of the introduction of increased tuition fees,
whereas this would not have been the case for the 2010 cycle (the data used in this report is
recorded as of January, so 2010 numbers would not be affected by knowledge of the new fee
regime). However 2012 applications were still ahead of the comparable number for 2009.
The dip in applications was seen mainly in England. The increase in tuition fees did not effectively
apply to applicants from Wales or Northern Ireland, and only to a minor extent to those from
Scotland. The decline in English applicants from the 2010 level was 8.8 %, as compared to a
nearly constant level from the other home nations across this period. This may indicate a link
between the level of tuition fees and the numbers of applicants. The fall in the population of 18 and
519 year olds is a significant factor in explaining some of the overall decline in applications (see
section 2.2. below) but this is relatively constant across the UK, and cannot account for the
difference in application drop-offs between the four home countries.
Chart 2.2 - Total number of applicants in
Chart 2.1 - Total number of Scotland, Wales and Northern Ireland by
applicants in England by year year
45,000
500,000
40,000
Number of Applicants
400,000 35,000
Number of Applicants
30,000
300,000
25,000
NI
200,000 20,000
Scotland
15,000
100,000 Wales
10,000
0 5,000
2009 2010 2011 2012 0
2009 2010 2011 2012
Year Year
Decline in number of applicants by age group
For the purposes of this report we split our analysis between those applicants aged up to 19, and
those aged 20 and over. We have included 19 year old applicants in our younger group, since
they include most gap year students, and can still be considered as school leavers.
The largest single fall in applications was from English applicants aged 20 or over which declined
from 123,293 in 2010 to 107,541 in 2012, a drop of 12.8%. This group represented 23% of the total
2012 applicant pool. English applicants aged up to 19, accounting for 60% of the pool, declined by
7%. Applications from the other home countries in all age groups either increased or showed
significantly smaller declines.
Charts 2.3 and 2.4 below summarise the number of applicants aged 19 and under by country of
domicile for the period 2009 to 2012. (Note that England is shown on a separate chart to highlight
the difference in scale between the numbers of applicants from England and those from other
nations). Scotland shows greater percentage increases over the same period, and Wales and
Northern Ireland smaller increases, than England for those aged up to 19.
6Chart 2.3: Number of applicants 19 and Chart 2.4: Number of applicants 19 and under
under from England by year from Scotland, Wales and Northern Ireland by
310,000
year
300,000 30,000
25,000
Number of applicants
Number of applicants
290,000
280,000 20,000
270,000 15,000 NI
260,000 10,000 Scotland
250,000 5,000 Wales
240,000 0
2009 2010 2011 2012 2009 2010 2011 2012
Year Year
Charts 2.5 and 2.6 show the number of applicants aged 20 and over for each year. For older
students, growth has been greater outside England. In particular, the percentage drop in the
number of applications in Scotland and Wales in 2012 was much smaller than the percentage drop
for England.
Chart 2.5: Number of applicants aged 20 Chart 2.6: Number of applicants from
and over from England by year students aged 20 and over from Scotland,
140,000 Wales and Northern Ireland by year
14,000
120,000
Number of applicants
12,000
Number of applicants
100,000 Northern
10,000 Ireland
80,000
8,000 Scotland
60,000
6,000
40,000 Wales
4,000
20,000 2,000
0 0
2009 2010 2011 2012 2009 2010 2011 2012
Year
Year
7ii. Total applicant numbers: longer term trends
The analysis in section 2.i should be seen in the context of longer term application rate trends,
which take into account the changes in cohort populations and allow the assessment of whether
application behaviour has changed. These trends are investigated in the UCAS report. Here we
use data from that report to take a different perspective by looking at the trends in applicant
numbers.
Chart 2.7 shows the number of applicants by age group over the period from 2004, and shows that
the decline in 2012 came after a long period of increasing numbers. It also shows 18 year olds as a
separate group from 19 year olds
It is also worth noting at this point that in 2011 there was no indication that more 18 year olds were
applying during that cycle rather than taking a gap year and applying in 2012. UCAS’ own data
analysis (see table 2.1 below) has shown no significant increase in the rate of applications from 18
year olds for that year.
This makes it harder to explain the relatively substantial drop-off in applications from 19 year olds,
since it would have been reasonable to expect this to have been caused by an acceleration of
applications into the prior year. We will re-examine this trend in the light of subsequent year
applications data.
Source: Data from ‘How have applications for full-time undergraduate higher education in the UK changed in
2012’, UCAS July 2012,
http://www.ucas.com/about_us/media_enquiries/media_releases/2012/2012applicationsanalysis
As already mentioned, the raw numbers of applicants does not take into account the variations
over time in the size of the various age groups. UCAS have calculated application rates taking the
population changes into account, and tables 2.1 and 2.2 below show these application rates for 18
8year olds and 19 year olds over the full period. We can see that the application rates for both 18
and 19 year olds in England have dropped this year. In Wales and Scotland there has been no
drop while in Northern Ireland the combined drop has been smaller( given the high overall
application rate in Northern Ireland, the percentage decline is also smaller)
Table 2.1: Application rates for 18 year olds over time (excluding nursing applications)
England Wales Scotland N Ireland
2004 27% 26% 27% 35%
2005 29% 26% 27% 36%
2006 27% 26% 27% 40%
2007 28% 25% 26% 39%
2008 29% 26% 26% 39%
2009 30% 28% 27% 41%
2010 33% 28% 29% 43%
2011 34% 28% 29% 44%
2012 32% 28% 29% 43%
Table 2.2: Application rates for 19 year olds over time (excluding nursing applications)
England Wales Scotland N Ireland
2004 9% 7% 5% 6%
2005 9% 7% 5% 7%
2006 8% 6% 5% 7%
2007 9% 7% 6% 7%
2008 10% 7% 5% 7%
2009 11% 8% 6% 7%
2010 12% 9% 7% 9%
2011 13% 9% 8% 11%
2012 11% 9% 8% 9%
Source: Data from Figures 21-24 from ‘How have applications for full-time undergraduate higher education in
the UK changed in 2012’, UCAS July 2012,
http://www.ucas.com/about_us/media_enquiries/media_releases/2012/2012applicationsanalysis. Nursing
applications are excluded in this analysis to avoid any effects from the introduction of nursing applications to
the UCAS scheme.
The UCAS analysis has used population data to calculate the application rates, which takes into
account a 1.4% fall in the total UK population of 18 year olds this year.
But, as can be seen, the comparative trends between the application rates from England and from
the other home countries displays the same pattern as for the raw applicant numbers, and provide
further evidence for a possible impact from the increase in tuition fees.
If we look at English 18 year olds in isolation, UCAS have calculated that the change in application
rate from the long run trend equates to the loss of one in twenty of those who would otherwise
have applied (some 15,000 applicants).
93. Trends in applicants by geographical measures of
advantage
i. Indicators
Both our analysis and UCAS’ analysis looked at applications in relation to some indicators of the
types of area applicants come from. This includes:
QYPR POLAR22:
This measure sorts the population into quintiles, depending on whether the neighbourhood they
live in has historically seen relatively high or low numbers of young people progress into higher
education. Specifically, it looks at those who were aged 18 between 2000 and 2004 and entered a
course in a UK higher education institution or GB further education college, aged 18 or 19,
between academic years 2000/01 and 2005/06.
The POLAR2 classification is formed by ranking 2001 Census Area Statistics wards by their young
participation rates for the combined 2000 to 2004 cohorts. This gives five young participation
quintile groups (QYPR) of areas ordered from '1' (those wards with the lowest participation) to '5'
(those wards with the highest participation), each representing 20 per cent of UK young cohort.
Students have been allocated to the neighbourhoods on the basis of their postcode. Those
students whose postcode falls within wards with the lowest participation (quintile 1) are denoted as
being from a low participation neighbourhood.
IDACI3
The Income Deprivation Affecting Children Index (IDACI) shows the percentage of children in each
super output area that live in families that are income deprived (ie, in receipt of Income Support,
Income based Jobseeker's Allowance, Working Families' Tax Credit or Disabled Person's Tax
Credit below a given threshold). This is a measure of economic disadvantage, rather than
educational disadvantage.
QAHE4
QAHE is a measure similar to QYPR, but it is based on the proportion of adults with a higher
education qualification in an applicant's home post code. It is therefore potentially more relevant in
looking at older populations, rather than school leavers.
ii. Analysis
The UCAS Report also released in July of this year demonstrates that the application rates for
young people from all backgrounds have fallen in 2012 with the largest declines, both
proportionally and in percentage points, for those from the most advantaged backgrounds. This is
encouraging in that any potential impact from higher tuition fees does not appear to be having a
disproportionate impact on those from less advantaged neighbourhoods. This analysis looks at
both the QYPR and IDACI measures.
The fact that the decline is actually greatest in the most advantaged neighbourhoods needs to be
seen in the context of the trend rate of growth over previous years, and the remaining very large
differences between the application rates in these different areas. The UCAS analysis
2
Developed by HEFCE, see http://www.hefce.ac.uk/whatwedo/wp/ourresearch/polar/polar2/
3
http://www.communities.gov.uk/communities/research/indicesdeprivation/deprivation10/
4
Developed by HEFCE, see ‘Quintiles based on the proportion of HE-qualified adults’ at
http://www.hefce.ac.uk/whatwedo/wp/ourresearch/polar/polar2/
10demonstrates that once the trend rate of growth is taken into account, the declines in applications
can be seen as having affected all neighbourhood types to approximately the same extent.
Our own analysis looked at some slightly different measures:
In the case of older applicants we looked at QAHE as our indicator of neighbourhood
advantage/disadvantage. As elsewhere we grouped 19 year olds along with 18 year olds in looking
at younger applicants
In neither case did we uncover patterns that were meaningfully different from those seen in the
UCAS analysis.
Chart 3.1 and table 3.1 below look at younger English applicants and show an analysis of the
number of applicants from different POLAR2 QYPR quintiles, which produces similar conclusions
to the UCAS analysis of the data.
Table 3.1: Applicants aged up to 19 and domiciled in England by year and QYPR
QYPR
1 2 3 4 5
Year
(low participation) (high participation)
2010 33752 47714 58419 69891 86505
32,017 44,968 54,363 63,736 79,339
2012
(-5.1%) (-5.8%) (-6.9%) (-8.8%) (-8.3%)
Note: Numbers in brackets are the percentage increase over 2010. Omits a small number of students (about
2,000 per year) with unknown QYPR.
The number of applicants from lower participation areas saw smaller percentage drops in
applicants than high participation areas between 2010 and 2012. This may reflect high participation
areas reaching saturation point. The pattern was similar for both males and females.
114. Analysis of applications to selective universities
In their report UCAS look at trends in applications to ‘higher tariff institutions’, that is, institutions
whose accepted applicants have, on average, higher levels of entry qualifications. We have used
the data sets supplied by UCAS to make our own initial analysis of the number of applications to
highly selective universities but for our purposes we are interested in a similar, but different,
grouping of institutions namely the Sutton Trust 135 and 306 groupings. We found some
unexpected results that we could not find a sufficient explanation for.
Therefore, at our request, UCAS undertook further analysis to see whether any underlying patterns
emerged when we looked at those applicants who had made at least one application to a selective
university (as defined by the Sutton Trust groupings). UCAS undertook this analysis using the
longer term data sets that are used in the rest of the UCAS Report, and reported the results as
application rates so as to allow fully for changes in cohort populations. UCAS also analysed the
data further to see whether there was any noticeable patterns in application rates across the
different geographical areas of advantage / disadvantage, as described in section 3 above. The
graphs used in this report, and the underlying data are available from UCAS on request.
.
The analysis undertaken by UCAS at our request has shown (in charts 4.3 and 4.4 below) that for
18 year olds overall, there have been no significant changes in the application rates to highly
selective universities this year compared to what would have been expected from previous years.
This is consistent with UCAS’ analysis of applications to higher tariff institutions.
Chart 4.1 18 year old application rates to ST13 institutions by country
5
The ST13 consists of Birmingham, Bristol, Cambridge, Durham, Edinburgh, Imperial College, LSE,
Nottingham, Oxford, St Andrews, UCL, Warwick and York.
6
The ST30 group also includes Bath, Cardiff, Exeter, Glasgow, King’s College, Lancaster, Leeds, Leicester,
Liverpool, Manchester, Newcastle, Reading, Royal Holloway College, Sheffield, Southampton,
Strathclyde and Surrey.
12Chart 4.2 18 year old application rates to ST30 institutions by country
Across the different nations we see much bigger declines in application rates to highly selective
universities from Northern Ireland compared to the other nations, with an application rate to Sutton
Trust 30 institutions this year of 15.0% compared to a rate of 18.2% in 2010. We do not currently
have an explanation for this.
For 19 year olds and those 20 and over (Charts 4.3 and 4.4), we do see a decrease in application
rates to selective universities. Looking at the second graph below (which is on a logarithmic scale)
we can see the biggest drop in application rate has been for the 19 year olds: 40,370 applicants
from a population of 796k (5%) in 2010 to 34,360 from a population of 757k (4.5%) in 2012. This is
broadly in line with the overall drop in the 19 year old application rate from 12% to 11% (Table 2.2).
Chart 4.3 UK application rates to ST13 institutions by age group
13Chart 4.4 UK application rates to ST30 institutions by age group
To look at the relative effects that might be being experienced by applicants from different
backgrounds the application rates for different POLAR2 quintiles were also considered. As
discussed earlier in this report, POLAR2 is a measure of Higher Education participation rates in the
area the applicant is from, with Q5 being the areas with the highest rates of HE participation and
Q1 being the areas with the lowest participation. The analysis (charts 4.5-4.8) found that there are
no significant differences in the application patterns in 2012 to highly selective universities across
the different POLAR2 quintiles for 18 year old English applicants.
Chart 4.5
14Chart 4.6
Chart 4.7
15Chart 4.8
Again we see bigger decreases for English 19 year olds across the different POLAR2 quintiles in
2012. We also see larger relative declines from applicants in the most advantaged areas.
Another measure of disadvantage that UCAS has used in its analysis is the IDACI measure of the
percentage of children living in low income households in the area each applicant is from. Graphs
4.9 to 4.12 below show a very similar story to the analysis by POLAR2 quintiles in that the greatest
decline in application rates in 2012 to Sutton Trust 13/30 institutions are amongst 19 year olds,
particularly for the most advantaged quintiles.
Chart 4.9
16Chart 4.10
Chart 4.11
Chart 4.12
17Overall, this further UCAS analysis looking at the trends of applications to highly selective
universities does not indicate that those from poor or middle-income backgrounds are being more
adversely impacted than those applicants from more advantaged backgrounds.
185. Other areas of UCAS analysis
UCAS’ recent analysis of application data has also covered several areas where we have not
performed any independent analysis. We welcome this additional analysis, which covers some
important areas.
In particular we have not studied the relationship between applications and the variable level of
fees charged by UK institutions, nor whether applicant choices have moved towards subjects of
study with higher reported salaries in response to the higher level of fees
In relation to fee levels UCAS have reported that there has been no significant change in
applications towards lower or higher fee courses when compared to the choices made by
applicants in previous cycles. UCAS also show that the distribution of courses confirms that a large
proportion of courses in England are offered at or near the maximum £9,000 fee (the average
tuition fee applied to by English applicants is £8,527). In our view this means that the ‘market
place’ in tuition fees is perhaps less informative than originally expected given the high number of
institutions that have chosen to charge the maximum level.
We also have not considered independently the propensity of applicants to indicate that they intend
to live at home for study. UCAS found that there have been no significant changes in the trends for
students wishing to live at home.
196. Other areas of potential interest where we have performed
an initial analysis, but are not able to report further at this
stage
In addition to the work referred to in sections 1 to 4 above, we have looked at additional data fields
on applications and applicants, and done a preliminary analysis of certain other factors which, we
believe, may need to be tracked over the coming years. We have discussed these issues with
UCAS, and will work with them to produce further analysis if we believe it is required. At this stage
we are not in a position to publish any detail since the more complex nature of these factors and
their capture through the UCAS data means that sound conclusions needs more detailed analysis
The factors which we have examined are:
i. Applicants by parental HE experience
As part of the application process, applicants are asked whether their parents, step-parents or
guardians have undertaken a course at higher education level. . A high and variable proportion of
applicants choose the 'I prefer not to say' option to this question and any patterns need to be
considered with the underlying changing demographics by parental education. For these reasons it
is not possible to have firm conclusions at this stage but parental education is an important
dimension of advantage and will need to be looked at in depth at a later stage.
ii. Applicants by socio-economic group (parental profession)
The data includes a measure of applicants' socio-economic group (SEG), based on the occupation
of the highest paid parent, step-parent or guardian, for 2010 onwards.
No firm pattern emerges from this analysis, and the self-reported nature of this measure together
with advice from UCAS that time-series can be misleading due to changes in the capturing of this
information through job titles make us cautious. In addition, the changing demographics of young
people by this classification, in particular the effect of increases in unemployment, means that no
conclusions can be drawn at this stage. However the question of whether young people from such
backgrounds are becoming less willing to apply to higher education, with the increase in fees
contributing to more general financial uncertainty, is important. Again we feel this is an important
dimension of advantage and needs more in depth analysis after the end of the cycle.
iii. Applicants by school type
We have looked at the pattern of applicants by the type of schools from which they come.
The widespread changes to recorded school types in recent years (notably schools becoming
Academies) makes the calculation of like for like trends difficult. A significant number of students
also apply as individuals rather than through schools, typically when they apply at a slightly older
age. No particularly strong patterns were seen, but we will continue to monitor this area as the
effects on the trends of these issues becomes better understood.
iv. Applications by subject
Each applicant can apply for up to five courses and, for most applicants, UCAS derives a 'preferred
subject group'. There are marked differences between subjects, and for males and females,
20between 2010 and 2012. UCAS have released a separate analysis on subject matter preferences
referred to in section 5 above. As our data also contained information relating to HNDs, for
example, it can be difficult to draw conclusions on the data for certain subjects which have a large
number of students studying for HNDs or Foundation Degrees.
v. Applicants by Gender
We have also made an initial assessment by gender. In all four years, there were significantly more
female applicants than males. The pattern of change over time for males and females was similar,
although with some indication that the number of female applicants is holding up better than for
male applicants.
There are substantially more females than males in the “twenty and over” group. The number of
applicants aged 20 and over increased by 50% from 2009 to 2010, with a further small increase in
2011. Numbers fell back slightly in 2012.
UCAS’ analysis of January application rates7 showed that men were substantially under-
represented amongst UCAS applicants and that there were signs that this gap was increasing for
2012.
7
http://www.ucas.com/about_us/media_enquiries/media_releases/2012/300112b
217. Findings
i. Overall numbers of applicants
In Scotland, Wales and, to a lesser extent, Northern Ireland, the number of applicants aged 20 and
over increased between 2010 and 2012. In contrast, the number of such applicants in England fell
by over 10%. The number of younger applicants (those aged up to 19) decreased by 7% in
England during this period, but by only 1-2% in the other countries. For all age groups combined,
the decline in England was 8.8% compared to a roughly constant level in the rest of the UK.
Although a significant portion of the absolute decline in application numbers can be accounted for
by a change in the cohort population size, the relative decline in English applications raises
concerns about the impact of increased fees.
ii. Application rates
Data on longer term trends in application rates, released by UCAS, demonstrates a fall in
application rates for young English applicants in 2012, both in absolute terms and relative to the
rest of the UK. The fact that this fall was more pronounced for 19 year olds than 18 year olds is
difficult to explain at this stage, since there was no apparent increase in the 18 year old application
rate in the prior year.
iii. Applicants from areas of advantage/ disadvantage
The decline in applicants appears to have been proportionately higher in areas of high participation
and low deprivation. Thus communities with low progression to higher education have seen a
smaller percentage drop in applications. However the UCAS analysis demonstrates that once the
trend rate of growth is taken into account, the declines in applications can be seen as having
affected all neighbourhood types to approximately the same extent.
iv. Applicants to selective universities
There has been a decrease in raw applications to those universities with relatively high entry
requirements, when compared to less selective universities. These figures relate to applications,
and an applicant can make up to five applications. The further analysis done on our behalf by
UCAS indicates that, for eighteen year olds, there are no fewer applicants (relative to the
population) choosing to apply to at least one ST30 or ST13 universities. There is, however, a drop-
off in the application rate from 19 year olds, mirroring the trend seen across applications to all
institutions, and a significant fall in applications from Northern Ireland. We should continue to
monitor these patterns.
v. General
The findings in this report come from our independent look at the UCAS applications data covering
the new tuition fee arrangements. There are some indications that the patterns of applications may
change but it is too early to conclude what the impacts of these significant fee increases are.
This report, and UCAS’ publication on how applications have changed, address many key
questions about demand for higher education in 2012. However, there are still further questions to
be addressed. In particular we have highlighted some of the factors which need further analysis
before a sound assessment of changes can be made. The Commission intends to continue to work
in close cooperation with UCAS to develop the analysis for these more difficult factors.
The Commission faces a challenging task over the next three years to determine the extent to
which any of the early observed changes reported here can be attributed to increased fee levels,
22and which groups of applicants – and potential applicants who decide not to apply to university -
are most affected.
Over the next three years application and admissions trends will be monitored to provide an
independent and impartial check on the reforms. These analyses will be combined with evidence
from other sources to ensure the Commission is taking an informed view. This report has
highlighted some areas that the Commission will keep a close eye on over the coming months.
23You can also read