Results for the year ended 31 March 2021 - 19 August 2021 Presentation also available at - LiveWest

Page created by Andre Rios
 
CONTINUE READING
Results for the year ended 31 March 2021 - 19 August 2021 Presentation also available at - LiveWest
Results for the year ended 31 March 2021
                       19 August 2021

                   Presentation also available at
         https://www.livewest.co.uk/about-us/for-investors
Results for the year ended 31 March 2021 - 19 August 2021 Presentation also available at - LiveWest
Disclaimer
This update includes certain statements, estimates and projections prepared and provided by the management of LiveWest
or LiveWest Treasury plc with respect to the anticipated future performance of either LiveWest Treasury plc (the "Issuer")
and/ or LiveWest (together, the "Relevant LiveWest Entities"). Actual results may vary from the projected results contained
herein and financial results quoted are unaudited. This update is believed to be in all material respects accurate, although it
has not been independently verified by the Relevant LiveWest Entities and does not purport to be all-inclusive. This update
and its contents are intended for use by the recipient for information purposes only and may not be reproduced in any form
or further distributed to any other person or published, in whole or in part, for any purpose. Neither the Relevant LiveWest
Entities nor any of their representative directors, board members, officers, managers, agents, employees or advisers makes
any representations or warranty (express or implied) or accepts any responsibility as to or in relation to the accuracy or
completeness of the information in this update (and no one is authorised to do so on behalf of any of them) and (save in the
case of fraud) any liability in respect of such information or any inaccuracy therein or omission therefrom is hereby expressly
disclaimed.
None of the Relevant LiveWest Entities, nor any other person connected to them shall be liable (whether in negligence or
otherwise) for any direct, indirect or consequential loss or damage suffered by any person as a result of relying on any
statement in or omission contained in this update or any other information and any such liability is expressly disclaimed.
This update is neither recommendation nor advice. This is not an offer or solicitation to buy or sell any securities.

Sourcing – unless otherwise stated: LiveWest Financial Statements 2021, LiveWest Trading Statement March 2021, LiveWest Trading Statement September 2020

                                                                                                          2
Results for the year ended 31 March 2021 - 19 August 2021 Presentation also available at - LiveWest
Our Presenting Team

                      Melvyn Garrett, Deputy Chief Executive and Executive Director of Finance

                      •   Joined LiveWest in 2013 (then Devon and Cornwall Housing (DCH))
                      •   Previously Europe, Middle East and Africa Finance and Operations Director at Motorola Mobility
                      •   Previously held finance, strategy and chief executive positions in the transport, electronics and
                          distribution sectors; with eight years spent in the USA

                      Andrew Hart, Director of Corporate Finance

                      •   Joined LiveWest in 2014 (then Devon and Cornwall Housing (DCH))
                      •   25 years’ finance experience including 10 years in corporate finance consultancy
                      •   Previously Managing Director at a consultancy specialising in housing sector treasury risk
                          management

                                                        3
Results for the year ended 31 March 2021 - 19 August 2021 Presentation also available at - LiveWest
• Key Highlights
         • Operations Update
         • Development Performance
Agenda   • Financial Performance
         • Conclusion
Results for the year ended 31 March 2021 - 19 August 2021 Presentation also available at - LiveWest
Key Highlights
Results for the year ended 31 March 2021 - 19 August 2021 Presentation also available at - LiveWest
Introduction: Key Highlights

                           Net
                         Surplus
                         £46m
                                   £59m
                                   2020

                                          6
Results for the year ended 31 March 2021 - 19 August 2021 Presentation also available at - LiveWest
Operations
Update
Results for the year ended 31 March 2021 - 19 August 2021 Presentation also available at - LiveWest
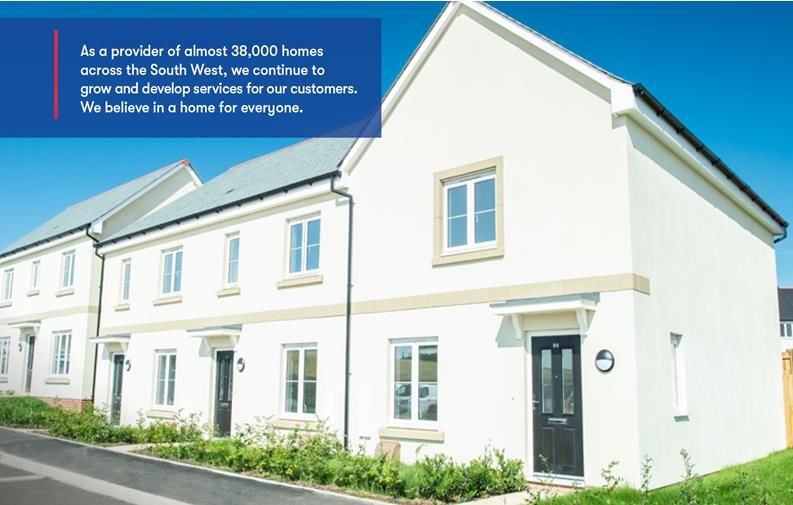
A Geographically Focused Portfolio
                                     Total Stock – 93% affordable tenures      General Needs (Social Rent)

                                                         7%                    Affordable Rent
                                                    3%
                                                                               Supported Housing
                                              12%
                                                                               Housing for Older People (
Results for the year ended 31 March 2021 - 19 August 2021 Presentation also available at - LiveWest
ESG: Environmental

 Early adopter of the Sustainability Reporting Standard – first report in October 2021
 Environmental Initiatives undertaken in the year:
 • taking a fabric first approach with renewable technology on all of our land led schemes
                                                                                                                       SAP Rating

 • all new own build scheme homes to be in the range of high EPC B to high EPC A
 • energy ratings to reach a minimum EPC C energy rating on all of our homes by 2028
 • procure and maintain a green energy supply in all of our offices
 • planting two trees for every one removed
 • reduce our business mileage by 15% of 'pre-covid' volumes
 • developing a Fleet Strategy to reduce the carbon impact of our 360 vans
 • an electric and ultra-low emission employee car benefit scheme
 • Introduction of hybrid working for our colleagues to reduce mileage and promote a healthy work/life
    balance

                                                                                                         Case Study: Ringswell Avenue Exeter
EPC Rating Total Stock                             EPC Rating of New Rented Units
                                                   Delivered in FY20/21                                  •     Start on Site November 2020
                                                                                                         •     60 Unit scheme (35 Rented, 25 Shared Ownership)
                               C                                                                         •     All Homes will be fitted with solar photovoltaic panels to
     A          B             60%                                        B                                     generate their own electricity
   0.1%        12%                                                      65%                              •     Electric car charging ports
    G
 0.02%                                                                                                   •     Public cycle parking, with spaces available for use by a car
    F          E                                                                                               club.
  0.3%        3%
                      D                                         C
                     25%                                       35%
                                                                                     9
Results for the year ended 31 March 2021 - 19 August 2021 Presentation also available at - LiveWest
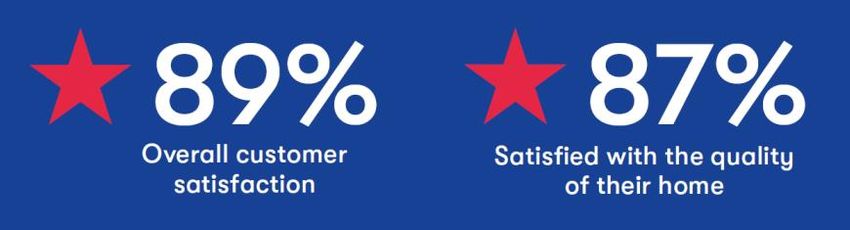
ESG: Social & Governance
 Social Initiatives:
 •   Aim to create long-term sustainable communities where people want to live and where there are opportunities to thrive and become resilient to increasing local and
     global impacts
 •   Ensuring affordability, security and safety through substantial discounts to market rates, all rented tenancies are long term with the majority on lifetime tenancies
     and a comprehensive above compliance approach to safety
 •   Early adopters of the National Housing Federation “Together with Tenants” charter
 •   Signed the Time to Change Employer Pledge which supports those facing mental health issues
 •   InFocus customer scrutiny group has membership across our housing geography to ensure our customers views are heard and acted upon
 •   Customer portal established providing 24/7 self-service functionality and partnering with Sign Video, ensuring customers can engage with us using sign language
 Key Social Achievements:

 Governance:
 •   Highest possible Governance and Viability rating (G1 / V1) - reaffirmed by the regulator in January 2021
 •   Board and Executive team comprise experienced members with a balance of skills and recognise importance of effective succession planning
 •   Gender Ratio of the Male: Female in the Board is 73:27
 •   Adopted and comply with the National Housing Federation’s 2020 Code of Governance
 •   89% Overall Customer Satisfaction and we continue to strive to improve in all aspects of our offering to our customers

                                                                                     10
Operational Performance Update
    BUILDING SAFETY

o   Customer Safety is our top priority, ensuring that our customers are safe in their homes
    through appropriate servicing of components and risk assessments
o   No buildings with ACMs (Aluminium Composite Materials)                                                                                         March     March    March
o   8 blocks over six storeys one of which is nine storeys                                                                                         2021      2020     2019
o   Dedicated building safety team recruited to ensure we meet the requirements of the Fire          Valid Gas Safety Certificates                 99.98%    100%     99.98%
    Safety Act and Building Safety Bill                                                              Fire Risk Assessments Complete                100%      99.45%   99.93%
o   We have used criteria (such as the number of storeys, quantity of cladding, the nature of        % of homes meet the Decent Homes
                                                                                                                                                   99.99%    99.91%   100%
    the residents, the presence of a fire detection system) to prioritise remedial action            Standard
o   New developments include consultation with fire specialists at an early stage of our design
    process

    RENT COLLECTION

o    Historically low void rent loss levels                                                                                                March      Sept    March   March
                                                                                                                                           2021       2020    2020    2019
o    Rent arrears returning to pre Covid-19 levels
                                                                                                  Rent arrears                             2.02%     2.54%    1.93%   1.83%
o    Increasing numbers of tenants claiming Universal credit
                                                                                                  Void rent loss (general needs)           0.47%     0.53%    0.64%   0.51%
         o   Our Tenancy sustainment team have helped our customers claim an additional
             £1.9m in income which has helped them pay their rent an household bills              Average days to re-let                   24.8                29.6    22.8
                                                                                                  No. of tenants in receipt of Universal   9,474              6,960    4,010
                                                                                                  Credit (% rented tenants)                (31%)              (23%)    (14%)

                                                                                      11
Development
Performance
Development: Delivery & Sales
March 2021 performance                                                                                                                                                  2021                                            2020
• 701 affordable homes completed, higher than initial target of 600 set at the                    Sales Performance                        Shared
                                                                                                                                                    Open Market                                 Total                   Total
  outbreak of the pandemic                                                                                                                Ownership
• £100m invested in delivery of our affordable housing programme                                  Sales (£000s)                            23,649     26,816                                  50,465                  60,749
                                                                                                  Units Sold                                256         79                                     335                     451
• Strong sales margins and low stock levels
                                                                                                  Sales as % of
• Sales as % of Turnover – 21% well within Internal Financial Framework limit                                                                   10%                     11%                      21%                     24%
                                                                                                  Turnover
  of 30%                                                                                          Stock                                          100                       8                     108                     133
                                                                                                   of which,
Units Developed                                                                                                                                   32                       4                      36                      74
                                                                                                   unreserved
1,200                                               87
                                           27                                                      of which,
                                                                                                                                                   3                       2                       5                      16
1,000
                                                                                                   unreserved > 3 mths
                        67                          375
               2                                                                                  Gross Profit (£000)                          5,479                   5,451                  10,930                  13,859
 800                                                                                                                                            23%                     20%                      22%                     23%
                        262                                                     83                Gross Profit Margin
 600                                                                           226                Profit (£000)                                3,746                   3,933                   7,679                  10,484
                                                    467
                                                                                                  Profit Margin                                 16%                    15%*                      15%                     17%
 400                    466
                                                                               264                *Profit on Open Market Sales is before an accrual for additional work required on an historical scheme. The Margin falls to 9% with
                                                                                                  this included.
 200
                                                    289
                        170                                                    211
   0                                                                                              •      Target of 6,955 new homes for development in the next 5 years (60%
                   2018/2019                    2019/2020                 2020/2021                      rented , 30% shared ownership, 10% open market)
Total                                                                                             •      Contracted pipeline of 2,504 affordable and 1,027 open market
                     900                           1,158                       701                       homes
Affordable
        Social Rented      Affordable Rented    Shared Ownership   Supported    Non Social

                                                                                             13
Financial
Performance

              When Carly found herself facing financial pressures,
              the last thing she thought she’d be doing was going to
              university. But now she’s planning to start a career in law.

              Carly, 20, said: “In the first year, after a very rocky start
              where I almost gave up, I managed to find my feet and
              finished the year with some positive results.

              “[LiveWest’s] funding was an absolute lifeline for me.”
Financial Performance
                                                      2021         2020    2019

  Total Turnover - £m                                 244          249     233

  Social Housing Lettings Turnover - £m               186          180     175

  Social Housing Lettings Surplus - %                 30%          33%     33%

  First Tranche Shared Ownership Sales - £m            24           32      22

  Open Market Sales - £m                               27           29      29

  Total Property Sales (S/O + OMS) as % of Turnover   21%          24%     22%

  Operating Surplus - £m (pre asset disposals)         61           70      66

  Operating Surplus - £m (post asset disposals)        82           90      81

  Operating Margin % (pre asset disposals)            25%          28%     28%

  Net Surplus - £m                                     46           59      56

  Gearing %                                           40%          41%     40%

  EBITDA-MRI Interest Cover %                         244%         252%    267%
  Housing & Investment Properties net of
                                                      2,164        2,083   1,978
  Depreciation - £m
  Housing Loans - £m                                  936          900     806

                                                              15
Financial Performance
     260                                  Total Turnover - £m                              30%                            Operating Surplus - %
                                                                                           28%
     240
                                                                                           26%
                                                                                           24%
     220
                                                                                           22%

     200                                                                                   20%
                         2019                     2020                    2021                           2019                     2020                    2021

 •             The impact of Covid-19 across all our business activities and additional fire safety costs resulted in our operating surplus reducing to £82m from £90m
 •             Turnover reduced by £5m. Social housing lettings income increased by £6m offset by lower sales volumes

                                       EBITDA-MRI Interest cover %                               50%                          Gearing - %
      250%
      200%                                                                                       40%

      150%                                                                                       30%

      100%                                                                                       20%
       50%                                                                                       10%
        0%                                                                                       0%
                          2019                     2020                   2021                                  2019                     2020                    2021
 •             Significant interest cover and gearing headroom compared with lenders covenants and internal warning levels
 •             2021 Interest Cover excludes non-recurring interest rate swap restructure costs (187% with these included)

                                       Net Debt per Unit Owned
     30,000
     25,000
     20,000                                                                              • Consistent debt per unit levels over the past three years
     15,000
     10,000
      5,000
           -
                          2019                     2020                   2021        16
Benchmarking
     Operating margin – social housing lettings                      EBITDA – MRI Interest Cover %

     Headline social housing Cost Per Unit (£)                       Gearing %

     • Comparing LiveWest against a selection of Moody’s rated housing associations using HouseMark data
     • Comprises of current A2 or higher rated associations
                                                                    17
Source: LiveWest 2020/2021 Annual Report
Debt and Security: Portfolio – March 21
March 20                      Loans   Swaps       Net loans      %
                                                                             Available Security
                                                                             Stock uncharged or held as excess security and
Fixed                         667      245          912         97%          available to secure future borrowings:
Floating                      269     (265)          4           1%          • 10,738 properties
Index linked                    -      20            20          2%
                                                                             • Security value of £0.9bn
Total Debt                    936         -         936        100%
Cash and liquid investments   (85)            -     (85)                     Swaps
                                                                             • MTM Liability - £83m (2020: £116m)
Net Debt                      851         -         851
                                                                             • Liability is fully secured (Including buffer
                                                                               against rate movement)
                                                  Debt Facilities            • Average Maturity – 9 years

                                                                              EMTN
                                                   £426m                      • Transferred £100m 2048 5.576% Bonds into
                                                                                EMTN Programme in June 2020 via
                                                              £936m
                                                                                solicitation process
                                                                              • In February 2021 £250m 2056 1.875% Note
                                                                                of which £100m was retained, our third
                                                   Drawn      Undrawn           Note issued from the programme.

                                                                        18
Conclusion

               Net
             Surplus
             £46m
                       £59m
                       2020

                              19
Appendix:
Organisational
Structure &
Governance
Appendix: Corporate Structure and Funding

                                                                LiveWest Homes Limited
                                                              (Regulator of Social Housing
                                                               registration number: 4873)

                                                    Arc
                                                                                             LiveWest                              Great Western
     LiveWest              LiveWest            Developments                                                      Westco
                                                                                             Properties                           Assured Growth
    Capital Plc*         Treasury Plc*          South West                                                    Properties Ltd
                                                                                              Limited                                   Ltd
                                                   Ltd**

                   *Parent Company Guarantee        •   Completed consent solicitation process transferring £100m LiveWest Capital Bond into
                      from LiveWest Homes               the LiveWest Treasury EMTN Programme

                      ** Company Limited            •   LiveWest Capital Plc and Arc Developments South West will become inactive and
                         by Guarantee
                                                        dormant

                                                                           21
Appendix: Board Membership

• Board comprises 11 members:
o   9 independent members, 2 executives
      ❖ LiveWest board is led by Linda Nash
      ❖ LiveWest CEO is Paul Crawford
• Treasury Committee includes specialist banking co-opted member
•   We are not-for-profit and comply with the National Housing Federation’s
    Code of Governance 2020 edition
•   InFocus customer scrutiny group of over 40 members who help ensure
    customer views are heard and acted upon and review performance

    Board Statistics
    Gender Ratio Male : Female        73:27
    Average Age                       62
    Average Tenure                    4 years
    Maximum Tenure (non-executives)   9 years
    Percentage Non-Executive          82%
    Regulator Grading                 G1/V1
                                                                              ARC = Audit and Risk committee   DC = Development committee    TC = Treasury committee
    CEO/Worker Median Pay Ratio       8.12                                    CSC = Customer Servicescommittee RC = Remuneration and Nominations
                                                                                                               committee
                                                                              22
Appendix: Executive Team

                           23
You can also read