Investor Presentation - 29 June 2017 - Amazon AWS

Page created by Mildred Holmes
 
CONTINUE READING
Investor Presentation - 29 June 2017 - Amazon AWS
Investor Presentation   29 June 2017
Investor Presentation - 29 June 2017 - Amazon AWS
OVERVIEW
>   Total fixed line connections decline continued at broadly the same rate in April-May,
    while broadband decline slowed modestly
    ▪ Ask for better broadband advertising campaign achieving strong awareness
    ▪ new record for fibre orders and connection activity in May
    ▪ completing a fibre connection every minute of working day

>   Shift to utility regulatory framework confirmed by Government announcement on 1 June

>   Chorus UFB uptake at 35% at end of May
    ▪ 264,000 UFB customers with 756,000 able to connect
    ▪ May fibre orders were up 33% from same time last year
    ▪ UFB2 rollout has commenced in Hokitika

>   Online video continues to drive significant increases in data traffic
    ▪ 1,052Gbps average network throughput at 9pm in May 2017, up 46% from May 2016
    ▪ 147GB average monthly household data usage in May (125GB average on copper; 217GB on
       fibre)
                                                              INVESTOR PRESENTATION 29 JUNE 2017   2
Investor Presentation - 29 June 2017 - Amazon AWS
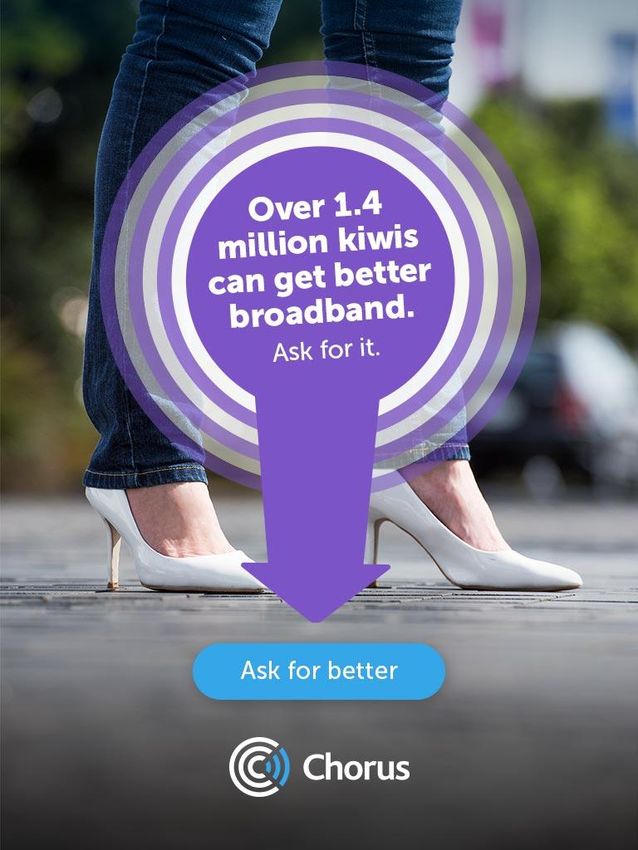
REGULATION: MOVING TO A UTILITY MODEL
>     Final regulatory framework policy decisions announced by Government on 1 June

Fibre – post 2020 utility framework                                          Copper – post 2020 legacy framework
 Regulated asset base (RAB) to be set by Commerce Commission:               Where fibre is available:
      o depreciated historic cost for pre 2011 assets                         Copper network to be deregulated and
      o depreciated actual cost for post 2011 assets and                       Telecommunications Service Obligation (TSO) removed
      o increased by unrecovered losses incurred pre 2020                     Chorus can withdraw copper service, subject to minimum
      o no retrospective efficiency review                                     consumer protection requirements
 Revenue cap with commercial geographically averaged pricing
                                                                             Where fibre is not available:
  except for:
                                                                              Copper remains regulated and TSO applies
      o two anchor products (voice only + entry level broadband -
                                                                              Copper pricing capped at 2019 levels with CPI
         100/20Mbps fibre) at 2019 prices + CPI
                                                                               adjustments
      o similar price cap for direct fibre access
                                                                              Commission required to review pricing framework no
      o after 2023 the Commission can review the revenue cap
                                                                               later than 2025
         model, as well as the anchor products subject to
         specified conditions & statutory criteria

    Legislation to be introduced in second half of 2017 (NB. General Election 23 September 2017)
                                                                                                                                    3

                                                                                         INVESTOR PRESENTATION 29 JUNE 2017
Investor Presentation - 29 June 2017 - Amazon AWS
REGULATION: BUILDING BLOCK MODEL (BBM)
>   A regulatory framework that supports efficient private sector investment to meet network upgrades and increasing
    consumer demands through ongoing incentives to innovate, invest and improve efficiency for the long term benefit of
    consumers.
    ▪ Legacy focus on promotion of infrastructure competition no longer a Government priority for fixed line access regulation.
    ▪ Government says the Commission should allow UFB providers the opportunity to earn normal returns over the lifetime of their
        investments (financial capital maintenance concept). An investment grade credit rating is a pre-requisite to receive UFB funding
        and to support ongoing investment.

                                                                                      Opex
         Initial RAB                                                                                        ANNUAL MAXIMUM
            value                                                                                              ALLOWABLE
                                                         Regulatory                 Return on                   REVENUE
                                                           WACC                      capital
                                    RAB                                                                     Anchor and price
                                                                                                            capped products:
                                                        Depreciation                Return of                voice
                                                                                     capital                 100/20Mbps fibre
           Capex                                                                                             direct fibre
                                                                                                           NB. Symmetrical wash-
                                                                                  Regulatory
                                                                                                           up for unders or overs
                                              Asset lives                        tax allowance

                                                                                  Building block                               4

                                                                                    cost stack
Investor Presentation - 29 June 2017 - Amazon AWS
REGULATION: BBM DETAILS
>   The Commission will set the upfront input methodologies to provide a transparent and
    predictable guide to how regulated assets will be treated under the new framework
    ▪     draft legislation may provide further clarity on BBM details that are not yet prescribed
                     Chorus view
Assets               Total Chorus assets less copper specific assets and less a % of shared assets (backhaul). Post 2011 investment including
                     shared infrastructure driven by fibre upgrade.
Opening asset        Commission to determine asset valuation methodologies consistent with legislative direction on fundamental points: use
valuation            of DHC (book value) for pre 2011 assets, DAC for post 2011 assets. Initial RAB must include all costs to meet UFB
                     obligations, standard and non standard UFB installation costs, and unrecovered UFB losses. No retrospective efficiency.
Regulatory WACC      5.56% mid point for Dec 2015 copper decisions. Higher WACC justifiable in a BBM.

Opex                 Total Chorus opex less copper specific spend.

Revenue cap (and     Form of control prescribed for 2020. Revenue cap to be sufficient to cover all costs and allow a reasonable return.
price caps)          Consistent with other utilities in NZ with a symmetrical wash up. Commercial flexibility on non-anchor products and
                     demand mix as between anchor/non-anchor products is critical to enable a fair chance to reach the revenue cap and the
                     aims of BBM regulation of critical infrastructure.
Funding              RAB reflects actual costs of the assets regardless of how financed. CFH funding was part of commercial construct.
                     Substantial private sector risk taken on to support accelerated build and take up including performance hurdles and
                     potential penalties with no guarantees on success or regulatory and market risks.
                                                                                      INVESTOR PRESENTATION 29 JUNE 2017                   5
Investor Presentation - 29 June 2017 - Amazon AWS
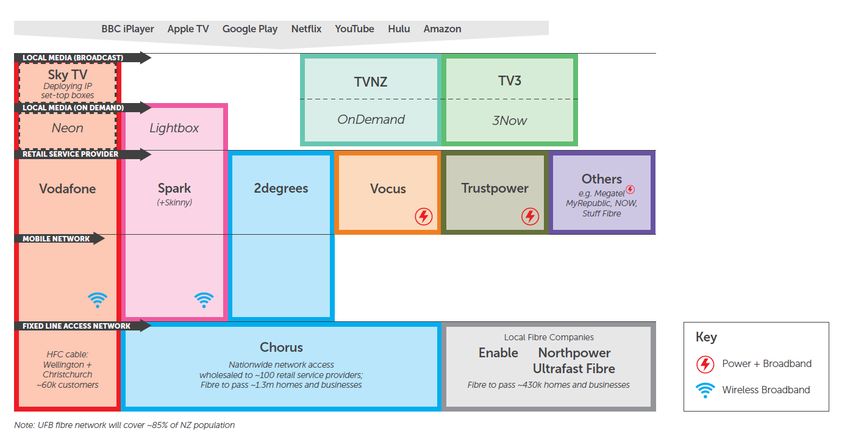
CHORUS CONNECTION TRENDS
                               Chorus connections trends
                                                                                                         >     Chorus connections declining
1800000                                                                                                        as:
1600000                                                                                                        ▪ voice only lines diminish
1400000                                                                                                            either through migration to
1200000                                                                                                            broadband and/or
1000000                                                                                                            mobile/wireless
800000                                                                                                         ▪ other Crown fibre partners
600000                                                                                                             grow broadband share
                                                                                                                   (~125k connections at 31
400000
                                                                                                                   March)
200000
                                                                                                               ▪ fixed (mobile) wireless
      0
     Dec 2015           March 2016        June 2016          Sept 2016        Dec 2016   March 2017
                                                                                                                   operators encourage existing
                                                                                                                   customers onto their own
                Data services (copper)                Fibre premium (P2P)                                          networks
                Fibre broadband (GPON)                VDSL
                Copper UBA                            Unbundled copper (no broadband)
                Baseband copper (no broadband)

                                                                                              INVESTOR PRESENTATION 29 JUNE 2017         6
Investor Presentation - 29 June 2017 - Amazon AWS
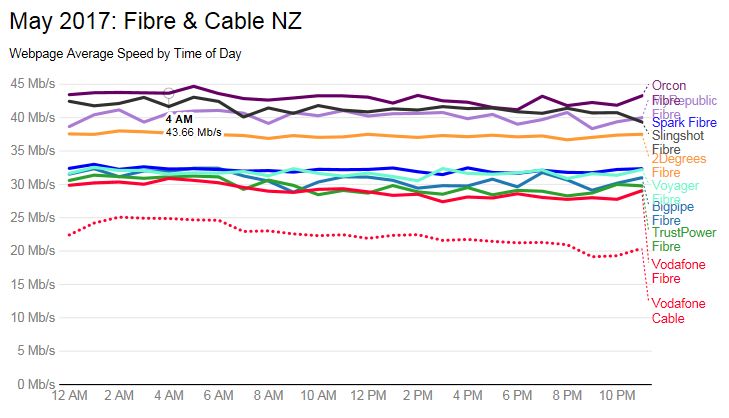
NZ BROADBAND MARKET – BY TECHNOLOGY

                                                                                                    >      Demand for broadband
                IDC - NZ broadband market by technology                                                    continues to grow
1,800,000
1,600,000
                                                                                                           ▪ broadband penetration still
                                                                                                              increasing
                                                                                                           ▪ continued premises growth as
1,400,000
1,200,000                                                                                                     result of New Zealand’s
1,000,000                                                                                                     migration/population inflows
 800,000
                                                                                                    >      Network competition has
 600,000                                                                                                   increased
 400,000                                                                                                   ▪ other local fibre companies
 200,000                                                                                                      expanding footprint to ~430k
       -                                                                                                      premises
             Q1 Q2 Q3 Q4 Q1 Q2 Q3 Q4 Q1 Q2 Q3 Q4 Q1 Q2 Q3 Q4 Q1                                            ▪ fixed (mobile) wireless
            2013 2013 2013 2013 2014 2014 2014 2014 2015 2015 2015 2015 2016 2016 2016 2016 2017
                                                                                                              operators expanding rural and
               Chorus xDSL
               Chorus premium fibre
                                                  Chorus mass market fibre
                                                  Local fibre companies (UFB)
                                                                                                              urban footprint
               Non-UFB fibre networks
               Vodafone cable
                                                  Other xDSL
                                                  Fixed (mobile) wireless
                                                                                                           ▪ consolidation of legacy
               Legacy fixed wireless, satellite                                      Source: IDC              wireless/satellite market
                                                                                        INVESTOR PRESENTATION 29 JUNE 2017         7
Investor Presentation - 29 June 2017 - Amazon AWS
NZ BROADBAND MARKET – BY RETAILER

            IDC – NZ broadband market share by retailer                                              >      Fibre rollout is a churn event
                                                                                                            ▪ smaller retailers have been
1,600,000                                                                                                      growing their share of overall
1,400,000
                                                                                                               market
                                                                                                            ▪ intense retail competition
1,200,000                                                                                                      focused on unlimited data and
1,000,000                                                                                                      100Mbps fibre as entry level
                                                                                                               plan
 800,000
                                                                                                            ▪ retail plans increasingly
 600,000                                                                                                       bundle content (e.g. Netflix,
                                                                                                               Sky TV) and/or electricity
 400,000
                                                                                                               (e.g. Trustpower, Vocus)
 200,000

       -
             Q1 Q2 Q3 Q4 Q1 Q2 Q3 Q4 Q1 Q2 Q3 Q4 Q1 Q2 Q3 Q4 Q1
            2013 2013 2013 2013 2014 2014 2014 2014 2015 2015 2015 2015 2016 2016 2016 2016 2017
             Spark    Vodafone   Orcon    Vocus    2degrees   Trustpower    Rest of Market
                                                                                       Source: IDC
                                                                                         INVESTOR PRESENTATION 29 JUNE 2017          8
Investor Presentation - 29 June 2017 - Amazon AWS
BETTER BROADBAND CAMPAIGN

>    Campaign to upgrade customers to fibre, or VDSL as a stepping
     stone to fibre, commenced in May
     ▪ strong response to above the line campaign
         • 80,000 unique visitors to askforbetter.co.nz
         • 29,000 address checks: 9k could upgrade to VDSL and 10k
            could upgrade to fibre

>    Chorus is supporting RSPs with contributions to modem costs for
     qualifying connections upgraded to fibre or VDSL:
     ▪   $150 per connection for ADSL to fibre (100Mbps+) upgrades
     ▪   or $100 per connection for ADSL to VDSL upgrades

                                                                 INVESTOR PRESENTATION 29 JUNE 2017   9
FOCUS ON FIBRE CONNECTIONS
What we achieved                                                  Dec 2015                   Jul 2016                 April 2017

                                               Lead times          20 days                   16 days                   11 days
A better customer
experience than ever                 Customer satisfaction           6.6                        6.8                      7.3
before
                                      Customer escalations           6%                         8%                       5%

                                    Technician reschedules           14%                        10%                      4%

                                 Doing more jobs than ever        421/day                    537/day                   550/day
Better performance in
the field                  Meeting customer commitments              85%                        80%                      90%

                                Meeting business customer
                                                                     58%                        65%                      95%
                                            commitments

MDU connection          More apartments connected to fibre   8400 completed in the first five         5400 completed in the last six
improvements                                    than ever               years                                  months

                                                                             INVESTOR PRESENTATION 29 JUNE 2017                        10
FIBRE ROLLOUT AND UPTAKE

                                                                            Chorus fibre connection activity - all NZ
>   Fibre orders increased significantly in May   25000                                                                                                                                                              25000
     Ask for better campaign and retail                                               May 2017 orders increased 33% vs May 2016
       incentives stimulating demand              20000                                                                                                                                                              20000
     release of new fibre ready addresses
       increases at end of build year:            15000                                                                                                                                                              15000

       •   756,000 customers able to connect at
           31 May (vs 708k at 31 March)           10000                                                                                                                                                              10000

       •   264,000 customers connected within
           UFB footprint                          5000                                                                                                                                                               5000

     weighted average lead time for fibre
                                                     0                                                                                                                                                               0
       connection increased to 18 days

                                                                            Mar-16

                                                                                                                          Aug-16

                                                                                                                                                                                          Mar-17
                                                                                                                                            Oct-16
                                                                                                                 Jul-16
                                                                                                        Jun-16
                                                          Jan-16
                                                                   Feb-16

                                                                                      Apr-16

                                                                                                                                                                                                   Apr-17
                                                                                                                                                               Dec-16
                                                                                                                                                                        Jan-17
                                                                                                                                   Sep-16

                                                                                                                                                                                 Feb-17
                                                                                                                                                      Nov-16

                                                                                                                                                                                                            May-17
                                                                                               May-16
     30k work in progress connections (up
       from 23k in March), including orders
       requiring consent                                           Connections built and activated                                                   Additional connections completed
                                                                   Orders (net of cancellations and rejections in the month)

                                                                                     INVESTOR PRESENTATION 29 JUNE 2017                                                                                      11
FIBRE DEMAND KEEPS GROWING

>    35% of potential customers have
     connected to fibre
      demand continues to accelerate in newly
        completed areas
      fibre uptake spans all ages, incomes and
        family types
      fibre has 100% awareness and highest
        satisfaction, loyalty and likelihood to
        recommend (source: Colmar Brunton Broadband
        Market Monitor Survey, March 2017)

>    UFB2 build underway
      Hokitika first UFB2 area: trialling “batch”
        approach to connections at time of build
       build complete target of 5,000 premises in
         FY18, with build work also starting in FY18 for
         FY19 premises.

                                                           INVESTOR PRESENTATION 29 JUNE 2017   12
DATA DEMAND KEEPS GROWING
>    Online viewing is driving data demand                                                    >   147GB average monthly household data usage on
     ▪     Our network traffic peaks between 8:30pm and                                           our network in May 2017 (103GB in May 2016)
           9:30pm each day and has grown almost 50% in the                                             125GB average on copper
           last year                                                                                   217GB on fibre
     ▪     TVNZ has begun livestreaming all channels online
     ▪     6 out of 10 households now on unlimited data plans
                                                                                                               Average Monthly Data Usage
                                                                                                              (GB) per Broadband Connection
                                                                                                       250

                                                                                                       200

                                                                                                       150                                                            147
                                                                                                                                                       123
                                                                                                       100                                   103
                                                                                                                                 84
                                                                                                                   71
                                                                                                       50
                                                                                                  GB    -
                                                                                                              May-15      Dec-15      May-16       Dec-16     May-17

                                                                                                                        Copper        Fibre         Average
    *Source: Nielsen CMI – Household Shopper, use internet at home and know their data plan

                                                                                                        INVESTOR PRESENTATION 29 JUNE 2017                       13
PEAK HOUR – AN EVER GROWING MOUNTAIN OF DATA

                                                                                                                                                9PM

                                                                 9PM
                                                                                                                                          6PM

                                                    6PM
                                                                                                                                    3PM

                                         3PM

                                                                                                    6AM
        6AM

        Time of day                                                                                                   Time of day

                      Note: data represents average of traffic across all days in May, excluding corporate traffic.                                   14

                                                                                             INVESTOR PRESENTATION 29 JUNE 2017
FIXED LINE DELIVERS CONSISTENT PERFORMANCE
>      Customers value reliability and consistency of service
       ▪ our network is designed to support peak demand: ADSL, VDSL and fibre perform within ~97% peak speed band
       ▪ fluctuations in fixed line performance typically reflect retailer network constraints
       ▪ wireless and cable networks share capacity and are more prone to congestion at peak times

    Source: TrueNet                                        Source: TrueNet

                                                                     INVESTOR PRESENTATION 29 JUNE 2017    15
WIRELESS PERFORMANCE HIGHLY VARIABLE
   >      Buffering has increased significantly on wireless in the last month
          ▪ Truenet data shows buffering events as a percentage of all measurements increased to 25% in May

              Buffering Average vs Peak Hours (8-9pm)
  30
                                                                  25.8%
  25
  20
% 15                          April    May
                                                          11.1%

  10
   5
   0
             Fibre           VDSL             ADSL          Wireless
                                                            (mobile)

       Source data: TrueNet Urban Broadband Report – April, May 2017                                           Source: TrueNet

                                                                          INVESTOR PRESENTATION 29 JUNE 2017                     16
COPPER NETWORK PERFORMANCE
>   Copper broadband performance increasing          Mbps
    steadily                                          25
                                                                          Average Copper Connection Speed
    ▪ new Dynamic Line Management (DLM)
       technology deployed in April resulted in       20
       increase in average download speeds of:
       •   18% on ADSL connections                    15
       •   8% on VDSL connections                                                                                           DLM
    ▪ now looking at options for vectoring            10                                                                    change
                                                                                                           VDSL
       deployment in selected areas                                                                        bandplan
                                                       5
                                                                                                           change
>   Focus on copper fault performance
                                                       0
    ▪ our fault restoration time is averaging ~24
       hours despite very challenging weather in
       April-May
    ▪ on average, a copper broadband fault on our    DLM automatically optimises ethernet-based ADSL and VDSL line settings for speed
       network occurs just once every five years     and stability
    ▪ we’ve identified ~20k customers in higher
       fault areas who could benefit from shift to
       fibre

                                                                      INVESTOR PRESENTATION 29 JUNE 2017                      17
WHAT WE’RE FOCUSED ON
   Better broadband

   • Driving broadband uptake and retention
   • Providing customers with a network that is fast, reliable and congestion free

   Transforming customer experience and cost

   • Optimising the fibre/VDSL connection experience for customers
   • Implementing new models for fibre connection

   Delivering the future broadband network

   • Delivering our UFB rollout on time and on budget
   • Underpinned by a regulatory framework that supports ongoing investment

   Creating opportunities to grow

   • Identifying new open access business opportunities, including the role of fibre in future uses cases such as
     non-broadband access points and the Internet of Things

                                                                           INVESTOR PRESENTATION 29 JUNE 2017       18
LEVERAGING THE UTILITY OF OUR NETWORK
                                     NZ premises growth:
                                     ~400,000 new homes
                                     expected in Auckland
                                           by 2040                                                Urban fibre footprint
                                                                                                   enabling new non-
                                                                                                 broadband connections
                                                                                                 (e.g. CCTV, micro cells)

National network
footprint enables HD
online TV to 95%+ of   Data growth driving        Exchange diversity
premises               demand for regional        and network
                       and mobile backhaul        proximity an asset
                                                  for data centre usage

                                                                          INVESTOR PRESENTATION 29 JUNE 2017                19
Appendices

             20
UNDERSTANDING OUR BUSINESS
   >         Our revenues are largely from copper (mostly regulated) and fibre (largely contracted) connections

             Fixed line connections                     31 March 2017         31 Dec 2016       30 Sept 2016         30 June 2016      31 March 2016        31 Dec 2015

             Unbundled Copper   (including SLU/SLES)               90,000             99,000           105,000              110,000               114,000         119,000
 Voice
             Baseband copper (no broadband)                       328,000            343,000           354,000              368,000            381,000            395,000
                                                                                                                                            Re-check
             Fibre broadband (GPON)                               259,000            231,000           203,000              167,000            136,000            112,000

Broadband    VDSL (includes naked)                                224,000            199,000           179,000              159,000
                                                                                                                                            category
                                                                                                                                               148,000            139,000

             Copper ADSL (includes naked)                         716,000            784,000           847,000              900,000         names,
                                                                                                                                               944,000add         972,000

             Data services (copper)                                  9,000             9,000               10,000            10,000
                                                                                                                                            Sept?
                                                                                                                                                11,000               11,000

             Fibre premium (P2P)                                   13,000             13,000               13,000            13,000                13,000            13,000

             Total fixed line connections                       1,639,000        1,678,000          1,711,000            1,727,000              1,747,000      1,761,000

   >         We now think of connections across three ‘zones’
                                                   Non-UFB areas (~15% population)       Chorus UFB areas             Local Fibre Company UFB areas           TOTAL

             Indicative No. of Chorus                     67,000 voice only               267,000 voice only                 84,000 voice only                  418,000
         connections by zone at 31 March                 174,000 broadband               854,000 broadband                  171,000 broadband                 1,199,000
         TOTAL (N.B. excludes data services                   241,000                          1,121,000                          255,000                     1,617,000
          and fibre premium connections)

                                                                                                                                                                21

                                                                                                           INVESTOR PRESENTATION 29 JUNE 2017
NZ FIXED LINE MARKET

                            Vocus
                       2o
                                    MyRepublic
                                    NOW          $49 intro plan

                                            Local Fibre Companies

                                                                    22
Indicative NZ broadband coverage
               100                                                    No fixed line broadband coverage
                                                                                                                                            Government target (2025)
                     Rural Broadband Initiative (RBI) 2011-2017
                     wireless access to 275k homes + businesses.                                                                            Last 1% to access 10Mbps
                     110k able to access Chorus fixed broadband:                                                                            99% to access 50Mbps
               90      57% get 5Mbps+; 50% 10Mbps+; 34% 20Mbps+

               80                                                                                                                                UFB2
Population     70
within reach                          Fibre to the Node (FTTN)
(%)            60                     (ADSL2+/VDSL)
                                                                                                                  Non-UFB population:          777,776
                                                                                                                  UFB2 population:             423,226
                                                                                                                  UFB1 population:           3,746,069
               50                                                                                                 TOTAL                      4,947,061

               40
                                                                                     Estimated pop       UFB1 – 75.7% of pop;           UFB2 - ~8.5% of pop
                                                                                     covered by 2023     33 towns and cities
               30                                       Chorus                       2,772,000           830,900 premises; ~1.1 m       168k premises; 203k
                                                                                                         connections (~70% of UFB1)     connections (~85% of UFB2)
                                                        Ultra Fast Fibre (central    460,000             195k premises                  23k premises; 12
               20                                       North Island, lines co.)                                                        towns/areas
                                                        Enable (Christchurch,        433,000             ~180k premises                 500 premises
                                                        council owned)
               10                     UFB1              Northpower                   52,000              20k premises                   9k premises; 12
                                                        (Whangarei, lines co.)                                                          towns/areas
                0
                 2011                                              2017                                          2020                                            2024
UFB UPTAKE BY REGION – March 2017
                    100%   BUILD 100% COMPLETE

                    90%

                    80%

                    70%

                    60%

                    50%

                    40%
% uptake relative                                                                                       34% UPTAKE
to capable          30%
addresses
                    20%

                    10%

                     0%

                           Jun-16      Sep-16    Dec-16   Mar-17      % of build complete 31 March

                                                                   INVESTOR PRESENTATION 29 JUNE 2017     24
Disclaimer
This presentation:
•    Is provided for general information purposes and does not constitute investment advice or an offer
     or invitation to purchase Chorus securities.
•    Includes forward-looking statements. These statements are not guarantees or predictions of future
     performance. They involve known and unknown risks, uncertainties and other factors, many of
     which are beyond Chorus’ control, and which may cause actual results to differ materially from
     those contained in this presentation.
•    Includes statements relating to past performance which should not be regarded as a reliable
     indicators of future performance.
•    Is current at the date of this presentation, unless otherwise stated. Except as required by law or the
     NZX Main Board and ASX listing rules, Chorus is not under any obligation to update this presentation
     at any time after its release, whether as a result of new information, future events or otherwise.
•    Should be read in conjunction with, and is subject to, Chorus’ audited consolidated financial
     statements for the year to 30 June 2016, consolidated interim financial report for the six months
     ended 31 December 2016, and NZX and ASX market releases.
•    Contains information from third parties Chorus believes reliable. However, no representations or
     warranties are made as to the accuracy or completeness of such information.

                                                                                                              25
You can also read