Investora Presentation - Altdorf, September 17, 2019
←
→
Page content transcription
If your browser does not render page correctly, please read the page content below
Altdorf, September 17, 2019

Investora Presentation

Table of Contents

1. Short Overview
2. ODH Financial and Operational Highlights
3. New Catalysts
4. Attractive Asset Base .. Still Undervalued
5. Andermatt Swiss Alps (ASA) Recent Updates
6. Outlook 2019

             Investor Presentation              Altdorf, September, 2019   2
Destinations                                                         6

                                                                         4
Portfolio                                                                    5

                                         1   Egypt:
A leading fully integrated                   ▪ El Gouna
developer with 30 years of                   ▪ Taba Heights      7
                                             ▪ Makadi Heights
experience                                   ▪ Fayoum                            1   3
                                             – O-West
101.0 mn m2                              2   Oman:                                       2
of land bank across                          ▪ Hawana Salalah
                                             ▪ Jebal Sifah
7 countries                                  – As Sodah Island
                                             – City Walk
68.5 mn m2 remaining                     3   UAE:
land bank (67.8%)                            ▪ The Cove

                                         4   Switzerland:
9 operating destinations                     ▪ Andermatt

with 32 Hotels                           5   Montenegro:
& 7,082 rooms                                ▪ Luštica Bay

                                         6   United Kingdom:
                                             – Eco – Bos

                                         7   Morocco:
                                             – Chbika

▪ Operating Destination

                 Investor Presentation                                                       Altdorf, September, 2019   3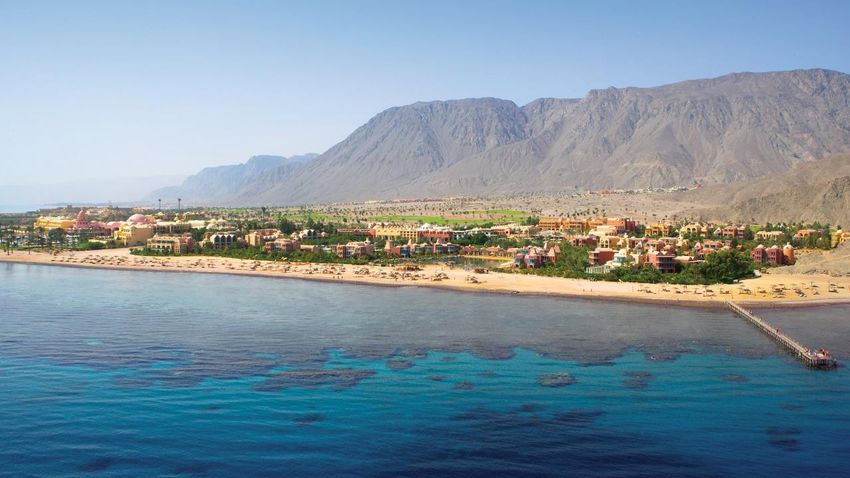
El Gouna, Egypt          Taba Heights, Egypt       Hawana Salalah, Oman

Jebal Sifah, Oman        The Cove, UAE             Makadi Heights, Egypt

Andermatt, Switzerland   Lustica Bay, Montenegro   O West, Egypt

                                                                           4
Business Model – Evolution of a new town
Acquisition phase Development Phase Operational Phase
Land Bank Value Creation
Real Estate RE Owner Services
New destination
Hotel Development Hotel Operations
identification
acquisition
Destination Development Destination Operations
& initial concept
Land Monetization
Construction
1 2 3 4 5 6 7 8 9 10
Real Estate
Periodic assessment
Start of construction
Detailed destination
of performance and
Marketing concept
and sales strategy
Internal / Operator
Buyer hand over /
Start of operation
Product sign-offs
Initial destination
service quality
Start of sales
Hotels and commercial property
hand over
opening
concept
concept
Community and town
Site Master Infrastructure facilities
Construction
identification planning development
Real estate pre-sales throughout various stages
Investor Presentation Altdorf, September, 2019 5
Contribution of other key destinations is increasing at a fast pace

               FY 2016                                                                                 1H 2019

                                                                                         high
  high

                                                                                                                                                                        El Gouna
                                                                   El Gouna                                                 The Cove
                     The Cove
                                                                                                                                  Taba Heights              Hawana Salalah
                                   Taba Heights
Maturity

                                                                                        Maturity
                                                                                                                                                            Andermatt
                         Makadi                                                                                          Jebel Sifah

                                                                                                               Makadi                             Lustica

           Jebel Sifah
                                                  Hawana Salalah     Andermatt                       As Sodah
             As Sodah                       Lustica

                                                                                                   City Walk
            City Walk                                                                                                    Chbika
                                Chbika
  low

                                                                                         low
                         Eco Bos                                                                               Eco Bos                           O West

               low                                           Revenues            high                  low                                        Revenues                                           high

                                                                                                                                                                                          Developed Area

           Our ultimate goal is to speed up the development and maturity of all our destinations towards the                                                                           Undeveloped Area
                                                                                                                                                                             Investment held in associates
           successful “El Gouna Model” and increase their contribution to the Group’s revenue and profits.
           O West is our new destination added to the Group portfolio in 2019.

                                         Investor Presentation                                                                                                  Altdorf, September, 2019                     6
2. ODH Financial and Operational Highlights

        Investor Presentation                 Altdorf, September, 2019   7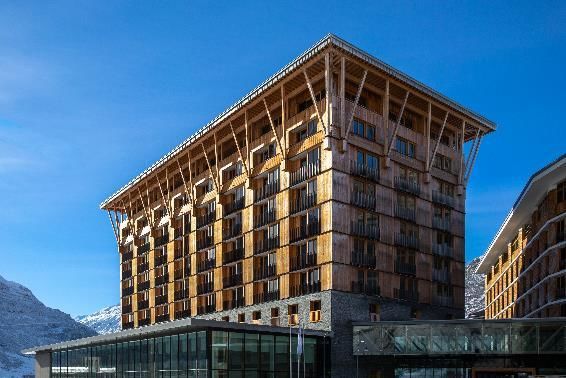
Succesfully Executing on our Three Pillar Strategy...
Todays ODH‘s Financial Stance
Key Segment Financials
Total Revenues (CHF mn)                                      Adj. EBITDA (CHF mn)                                           Net Losses (CHF mn)
                                                                                   70                                                                                        (1.5)
                                                                                                                                                                  (16.4)
                   340                                                                                                                    (41.1)      (37.3)

  237     244                                                                                          42
                                         223                                                 35
                                                                        33
                             156
                                                              20                                                             (243.8)

  2016   2017      2018    1H 2018    1H 2019                2016       2017      2018     1H 2018   1H 2019                   2016       2017         2018       1H 2018   1H 2019

 Cash Flow From Operations (CHF mn)                                                                                         Net Debt to Adj. EBITDA

                    56                                                                                                          14.7x

          30
                                                                                                                                                        8.2x
                                           20
                              11
                                                                                                                                                                              3.3x
 (9)
                                                                                                                                FY 2016                 FY 2017               FY 2018
 2016    2017      2018     1H 2018      1H 2019

                * 1H 2018 revenues and Adj. EBITDA included contributions from Citadel Azur, Royal Azur and Club Azur hotels that were sold out and deconsolidated during 2018.

                 Investor Presentation                                                                                                             Altdorf, September, 2019             8
Todays ODH‘s Operational Stance
            Key Segment KPIs

      Net Real Estate Sales (CHF mn)                                                         Real Estate Defereed Revenue (CHF mn)                   Real Estate Portfolio Receivables (CHF mn)
                                                                  1,058
                                                                                                                                404
300                                                                              900

                                            839                                  800

250

                                                                      285                                                                                                                       512
                                                    450
                                                                                 700

200
                        538                                                      600

            319                        201                                                                    236
                                                                                 500

                                                                                                                                                                            324
150

                                                                                 400

                                                                                                      183             199                                                             275
100

            123         126
                                                                                 300

                                                                                               141                                                                244
 50
                                                     99                          200

                                                                                                                                                        195
                                                                                 100

  0                                                                              0

            2016        2017           2018        1H 2018           1H 2019                  2016    2017    2018   1H 2018   1H 2019                  2016      2017      2018    1H 2018    1H 2019
                          Net Sales Value          No. of Units

                                                                                                                                                     Town Managment Total Revenues (CHF mn)
      Hotels Financials & KPIs (CHF mn)
      180
                          63%                66%                          67%          70%

                                                                                                                                                                             36
      160

              53%                                       62%                            60%

      140

                                      157
                                                                                                                                                         27        27
                                                                                       50%

      120

                        132
      100

            120                                                                        40%

                                                                                                                                                                                                 23
       80
                                                                                       30%

                                                                     84                                                                                                                16
                                                   73
       60

                                                                                       20%

       40

                                              59
                   36          45                                           33
                                                                                       10%

                                                           28
       20

        0                                                                              0%

              2016        2017          2018        1H 2018          1H 2019
                                                                                                                                                        2016      2017      2018     1H 2018   1H 2019
                         Revenues            GOP        Occ. Rate%

                                    * 1H 2018 revenues and Adj. EBITDA included contributions from Citadel Azur, Royal Azur and Club Azur hotels that were sold out and deconsolidated during 2018.

                                     Investor Presentation                                                                                                        Altdorf, September, 2019        9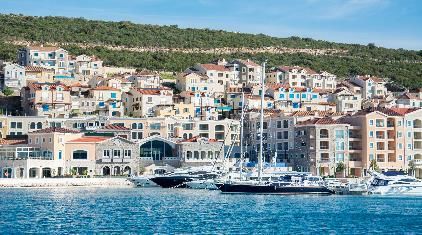
1H 2019
Income Statement – Reported vs. Pro-forma

                              Pro-forma          Pro-forma    Reported Reported     Difference between the Reported figures and Pro-
(CHFmn)
                                1H 2019            1H 2018     1H 2019 1H 2018      forma:
Revenue                              223.0           142.1       223.0     155.6    −   Took out Tawmeel Group revenues in 1H 2018 as it
Cost of sales                      (161.3)           (97.6)     (161.3)   (106.1)       was sold and deconsolidated in Q4 2018.
Gross profit                             61.7         44.5        61.7      49.5
Gross profit margin, (%)            27.7%            31.3%       27.7%    31.8%     −   Took out Royal Azur and Club Azur Hotels revenues
                                                                                        in 1H 2018 as they were sold and deconsolidated in
Adj. EBITDA                              41.7         29.9        41.7      35.0        Q4 2018.
Adj. EBITDA margin, (%)             18.7%            21.0%       18.7%    22.5%
EBITDA                                   43.8         15.1        43.8      19.5    −   Took out Citadel Azur Hotels revenues in 1H 2018 as
Net losses for the period                (1.5)       (19.1)       (1.5)    (16.4)       they were sold and deconsolidated in May 2018.

                 Investor Presentation                                                                            Altdorf, September, 2019   10
Successfully signed debt rescheduling package with the Egyptian banks
Annual savings of c. CHF 4.0mn in interest payments for 2019 & a total of c. CHF 19mn over the 6 years period (2019-2024).
Current Maturity Profile & Balance in 1H 2019 Current Debt by Currency Current Debt by Country
1H 2019 Balance: CHF 344.8mn 6% 4%
Cost of Debt: 8.6% 12% Egypt
EGP
82 29% Oman
63 USD
57 UAE
42 48 EUR 29%
Montenegro
25 6% AED 61%
13 13 47%
6% OMR
CF 2019 2020 2021 2022 2023 2024 2025 -
2032
Planned Maturity Profile & Balance Debt by Currency after Rescheduling Debt by Country after Rescheduling
4%
Balance: CHF 325.3mn 7%
Cost of Debt: 7.9% 10%
Egypt
82 EGP
75 30% Oman
USD
42 UAE
33 32 35 EUR 30%
13 59% Montenegro
10 7% 47% AED
6% OMR
CF 2019 2020 2021 2022 2023 2024 2025 -
2032
Investor Presentation Altdorf, September, 2019 113. New Catalysts
Investor Presentation Altdorf, September, 2019 12− Render
O West, Egypt
ODH’s newest addition to its towns’ portfolio in West of Cairo
Collection duration: Over Government Payments
Total residential sales value of the project: EGP
15 years ▪ Gov. is entitled to 26% of total residential sales
collection for the first 8 years.
77.0 billion ▪ Gov. is entitled to a total cash payment of EGP
11.4bn (CHF 633.5mn) over 8 years and a
(CHF 4.3 billion at current rates). primary in-kind residential BUA of 130,000 sqm
delivered in year 8 which implies a land cost
per sqm of EGP 1,580 (CHF 87.8) on a net
Construction duration: present value basis.
Sales duration: Over
▪ In addition to that, Gov. will be entitled to another
8 years 12 years. in-kind residential BUA of 150,000 sqm 75,000 sqm
in year 9 and 75,000 sqm in year 10.
13− Render
O West, Egypt
ODH’s newest addition to its towns’ portfolio in West of Cairo
▪ Net Contracted Real Estate Sales Value:
CHF 160.6mn as of 1H19.
▪ No. of contracted units: 590 unit.
▪ Avg. selling price (CHF/m2): CHF 1,229.
▪ Total revenues: CHF 23.8mn as of 1H19.
Next:
Total land area:
Total number of residential units: ▪ New high-end apartments launch in Sep.19
4.2 million sqm 19,000 ▪
for an inventory of CHF 35mn.
First commercial launch in Sept.19 with an
(1,000 Feddans) Inventory of CHF 27mn.
Commercial area is still under
Total Residential units BUA:
development. ▪ First British Int. School to be signed by year
3.2 million sqm
end.
14Taba Heights, Egypt
Sinai’s Premium Destination
New Updates
▪ July 2019: German Ministry of Foreign
Affairs announced that it has removed
restrictions on all German airlines to
travel to Taba.
▪ To date we have 4 hotels (1,319 room)
opened out of the 6 (2,365 rooms)
existing.
▪ In negotiations with German Tour
operators to commence charter flights to
Taba as of Nov. 2019.
▪ In 2010, Taba Heights used to generate
Total land area: 6 hotels with c. USD 20mn of pure EBITDA.
2,365 rooms.
4.3
The town offers a marina, a golf course and a
▪ A full relaunch plan for Taba is currently
wide range of facilities including a medical
center, child daycare services, a school, and
understudy.
million sqm a vibrant up-town center.
15Taba Heights, Egypt Taba Heights, Egypt
Hotel KPIs (CHF) Revenues per segment
1H 2019 (CHF mn)
50 45%
45
39% 40%
40
43 33% 35%
82.8%
35
30%
27%
30%
30
32 25%
5.3
20%
25
26 26 20%
2.9
20
22 21 0.7
20 15%
+16.7%
15
18
15 10%
10
0.6
4.6
10 +100.0%
2.3
5%
5
0 0%
1H 2018 1H 2019
2015 2016 2017 2018 1H 2019
Hotels Destination Management
ARR TRevPar Occ. Rate
164. Attractive Asset Base .. Still Undervalued
Investor Presentation Altdorf, September, 2019 17Asset-rich company with significant value still to be realized
CBRE Report Values El Gouna Assets at USD 2.1 billion, 42 Times Its Current Book Value
Starting with El Gouna – our largest remaining undeveloped land bank and biggest hotel portfolio.
ODH Land Bank: Hotels:
− Total land bank of 101 million sqm of which − ODH owns 32 Hotels with 7,082 guest rooms.
68.5 million sqm is still undeveloped.
− Hotels are booked at cost and had never been revalued.
− Land is booked at cost – has never been revalued.
− CBRE valued the 17 hotels in El Gouna, Egypt
− El Gouna have – 22.8 million sqm of land at USD 303.6 million, compared with the book value
remains undeveloped. of USD 39.3 million.
− The book value of El Gouna land bank was
USD 0.20 cents per sqm.
− CBRE Valuation came at USD 79.4 per sqm.
Total remaining value of El Gouna’s undeveloped
land bank alone is USD 1.8 billion CBREs repor (Sep 2018) t executive summary can be found on ODH’s website
Investor Presentation Altdorf, September, 2019 18Yet…Book Value is not Indicative to theTrue Equity Value
Orascom Development Egypt(ODE); As an Example..
ODE Book Value vs. Adj. Book Value ODE Market Cap vs Adj. Book Value
(CHF mn) (CHF mn)
2,150
2,150 2,048
1,627
523
103
ODE Book Value ODE Adj. Value Implied Book ODE Market Cap ODE's Fair Value ODE's Implied Market
reflecting CBRE Discount reflecting CBRE El Discount
Gouna hotels and Gouna Land and
Land Valuation Hotels valuation
- 1 .ODE Market Cap As of 9 September 2019
Investor Presentation Altdorf, September, 2019 19ODH and ODE’s Share Price Development
ODE Share Price vs. EGX 30 ODH Share Price vs. SPI Index
599%
69%
43%
148%
Sep-17
Jul-16
Sep-16
Nov-16
Jul-17
Nov-17
Jul-18
Sep-18
Nov-18
Jul-19
Sep-19
May-16
May-17
May-18
May-19
Jan-16
Jan-17
Jan-18
Jan-19
Mar-16
Mar-17
Mar-18
Mar-19
ODE EGX ODH SPI
ORHD.CA FY 2016 FY 2017 FY 2018 YTD Sep 9th ODHN.SW FY 2016 FY 2017 FY 2018 YTD Sep 9th
% Return (5.39%) 279.1% 48.1% 8.8% % Return (50.6%) 115.7% 35.5% 1.3%
Close price (EGP) 1.26 4.75 7.04 7.66 Close price (CHF) 5.11 11.0 14.9 15.10
Mkt. Cap (EGPmn) 1,398.0 5,257.9 7,756.0 8,659.4 Mkt. Cap (CHFmn) 206.4 444.4 602.0 610.0
Investor Presentation Altdorf, September, 2019 20ODE Share Price Development and Analyst Price Targets
Currently ODE is member of the main Egyptian Stock Exchange Index the "EGX 30“ Since February 2019.
Analyst Price % of upside based on ODE Value Analysis After reflecting the Average Price Target on
Company
Targets (EGP) price as of Sep. 9, 2019 ODE share (CHF mn)
Pharos Holding 14.71 92.0%
HC Capital 14.10 84.1%
Beltone Financial 12.50 63.2%
814
CI Capital 12.00 56.7%
Naeem Holding 11.90 55.4%
56%
Shuaa Capital 11.90 55.4% 523
AAIB 11.51 50.3%
EFG-Hermes 11.50 50.1%
Arqaam Capital 10.50 37.1%
Sigma Capital 9.42 23.0%
Average Price Targets 12.00 56.7% ODE Current Mkt. Cap ODE Potential Mkt. Cap implying analyst
average target price
Investor Presentation Altdorf, September, 2019 215. Andermatt Swiss Alps (ASA) Recent Updates
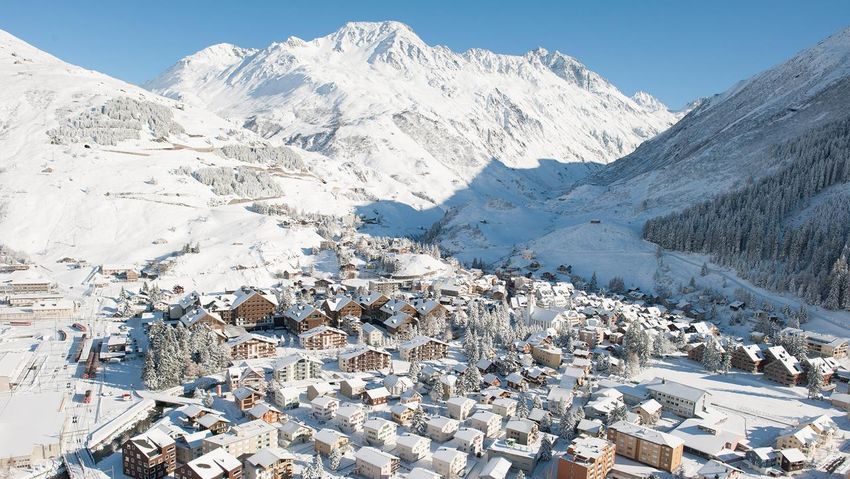
Investor Presentation Altdorf, September, 2019 22Andermatt, Switzerland
Home As It Should Be
Updates
▪ In Dec.18 opened the Radisson Blu
Reussen Hotel with 224 rooms.
▪ In June 19 opened the first concert hall in
Andermatt with Berlin Philharmoniker.
▪ Franz-Xaver Simmen has resigned & left ASA
in April 2019. On an interim basis, ASA is
directed by Khaled Bichara.
Total land area: ▪ New CEO hired; Raphael Krucker will start
on 1st of Jan. 2020. He spent 24 years in
1.5
million sqm Undeveloped: 2 hotels with
various management positions in the Bühler
Group, a leading global Swiss technology
company.
367 rooms.
150,000
sqm
Offers a range of facilities including
residential units, hotel, ski arena,
commercial centers & many other
▪ ASA has successfully placed a 3rd
CHF 50mn bond in July 2019.
amenities.
23Andermatt, Switzerland Andermatt, Switzerland Andermatt, Switzerland
Real Estate KPIs (CHF) Hotel KPIs (CHF) Revenues per segment
FY 2018 (CHF mn)
120 12. 5
700
54% 54% 60%
12.1 600
662 +87%
618
50%
11.8
100 12. 0
110 135.7
11.5 500
72.6
80 11. 5
500 516 40%
17.9
400
35% 35% 15.4
60 11. 0
30%
+16%
300
10.5
34.3 90.9
+165%
40 10. 5 20%
200
38
20
30 10. 0
100
10%
17 22.9 +18%
0 9.5
26.9
0 0%
2015 2016 2017 2018 2015 2016 2017 2018 FY 2017 FY 2018
Net Sales, CHFmn Avg. price per sqm '000 ARR Occ. Rate Hotels Real Estate Destination Management
24Andermatt Swiss Alps (ASA)
Radisson Blu Concert Hall
Investor Presentation Altdorf, September, 2019 256. Outlook 2019
Investor Presentation Altdorf, September, 2019 26Guidance FY 2019
FY 2018 Actual Reported FY 2018 Pro-forma * FY 2019 Target
Revenues CHF 340mn CHF 319mn CHF 400mn
Adj. EBITDA CHF 70mn CHF 62mn CHF 74mn –77mn
Real Estate Sales CHF 201mn CHF 445mn–470mn
Adding a new Casa Cook hotel with 100 extra rooms’ in El Gouna to bring its total keys to 2,748 in October 2019.
Hotels
Rebranded and opened Arena Inn Hotel to become a Cook's Club Hotel with 144 keys in mid-August 2019.
* FY 2018 Pro-forma excludes the contribution of Citadel Azur, Royal Azur, Club Azur hotels & Tamweel Group identified as non-core assets.
Investor Presentation Altdorf, September, 2019 27Disclaimer
THESE MATERIALS ARE BEING PROVIDED TO YOU SOLELY FOR YOUR INFORMATION AND ARE STRICTLY THIS DOCUMENT CONSTITUTES NEITHER AN OFFER TO SELL NOR A SOLICITATION TO BUY ANY SECURITIES AND IT
CONFIDENTIAL AND MUST NOT BE REPRODUCED, DISCLOSED OR FURTHER DISTRIBUTED TO ANY OTHER PERSON, DOES NOT CONSTITUTE A PROSPECTUS PURSUANT TO ARTICLES 652a AND/OR 1156 OF THE SWISS CODE OF
OR PUBLISHED, IN WHOLE OR IN PART, FOR ANY PURPOSE. OBLIGATIONS OR ARTICLES 32 ET SEQ. OF THE LISTING RULES OF THE SWX SWISS EXCHANGE. A DECISION TO
INVEST IN SHARES OF THE GROUP SHOULD BE BASED EXCLUSIVELY ON THE ISSUE AND LISTING PROPECTUS
IN PARTICULAR, NEITHER THIS DOCUMENT NOR ANY PART OR COPY OF IT MAY BE TAKEN OR TRANSMITTED INTO PUBLISHED BY THE GROUP FOR SUCH PURPOSE.
THE UNITED STATES OF AMERICA (THE "UNITED STATES") OR TO U.S. PERSONS OR DISTRIBUTED, DIRECTLY OR
INDIRECTLY, IN THE UNITED STATES OR TO U.S. PERSONS. NEITHER THIS DOCUMENT NOR ANY PART OR COPY OF THE INFORMATION CONTAINED IN THIS DOCUMENT IS NOT INTENDED TO LEAD TO THE CONCLUSION OF ANY
IT MAY BE TAKEN OR TRANSMITTED INTO, OR DISTRIBUTED OR REDISTRIBUTED, DIRECTLY OR INDIRECTLY, IN CONTRACT OF WHATSOEVER NATURE, IN PARTICULAR WITHIN THE TERRITORY OF EGYPT, THE UNITED ARAB
AUSTRALIA, CANADA OR JAPAN, OR TO ANY RESIDENT THEREOF. EMIRATES, KUWAIT, MOROCCO, OMAN AND SAUDI ARABIA.
ANY FAILURE TO COMPLY WITH THESE RESTRICTIONS MAY CONSTITUTE A VIOLATION OF UNITED STATES, THESE DOCUMENTS MAY CONTAIN CERTAIN FORWARD LOOKING STATEMENTS AND INFORMATION IN RELATION TO
AUSTRALIAN, CANADIAN OR JAPANESE SECURITIES LAWS. THE DISTRIBUTION OF THIS DOCUMENT IN OTHER ORASCOM DEVELOPMENT HOLDING AG WHICH REFLECT THE CURRENT VIEWS AND/OR EXPECTATIONS OF THE
JURISDICTIONS MAY BE RESTRICTED BY LAW, AND PERSONS INTO WHOSE POSSESSION THIS DOCUMENT COMES COMPANY AND THE COMPANY’ S MANAGEMENT IN RESPECT OF THE COMPANY’S PERFORMANCE, ACTIVITIES, AND
SHOULD INFORM THEMSELVES ABOUT, AND OBSERVE, ANY SUCH RESTRICTIONS. FUTURE EVENTS. SUCH FORWARD LOOKING STATEMENTS INCLUDE, AMONG OTHER, STATEMENTS THAT MAY
PREDICT, FORECAST, SIGNIFY OR IMPLY FUTURE RESULTS PERFORMANCE OR ACHIEVEMENTS, AND MAY CONTAIN
THIS DOCUMENT DOES NOT CONTAIN OR CONSTITUTE AN OFFER TO SELL OR A SOLICITATION OF ANY OFFER TO WORDS SUCH AS “UNDERSTANDS”, “ANTICIPATES”, “EXPECTS”, “ESTIMATES” , “IT IS LIKELY” OR OTHER TERMS OR
BUY SECURITIES IN THE UNITED STATES OR IN ANY OTHER JURISDICTION IN WHICH SUCH OFFER OR SOLICITATION EXPRESSIONS WITH SIMILAR MEANING. THESE STATEMENTS ARE SUBJECT TO A NUMBER OF RISKS,
IS NOT AUTHORIZED OR TO ANY PERSON TO WHOM IT IS UNLAWFUL TO MAKE AN OFFER OR SOLICITATION. THE UNCERTAINTIES AND ASSUMPTIONS. THE COMPANY CAUTIONS READERS THAT CERTAIN RELEVANT FACTORS
SECURITIES OF OD HOLDING HAVE NOT BEEN AND WILL NOT BE REGISTERED UNDER THE UNITED STATES MIGHT BE THE CAUSE FOR ACTUAL RESULTS TO DIFFER FROM THE PLANS, GOALS, EXPECTATIONS, ESTIMATES
SECURITIES LAWS AND MAY NOT BE OFFERED OR SOLD IN THE UNITED STATES OR TO OR FOR THE ACCOUNT OR AND INTENTIONS EXPRESSED IN THIS DOCUMENT. NEITHER THE COMPANY NOR ANY RELATED COMPANIES,
THE BENEFIT OF “U.S. PERSONS” (AS SUCH TERM IS DEFINED IN REGULATION S UNDER THE U.S. SECURITIES ACT DIRECTORS, OFFICERS, REPRESENTATIVES OR EMPLOYEES THEREOF SHALL IN ANY EVENT BE LIABLE AS TO THIRD
OF 1933, AS AMENDED) ABSENT REGISTRATION OR AN EXEMPTION FROM REGISTRATION UNDER THE U.S. PARTIES (INCLUDING INVESTORS) FOR ANY INVESTMENTS OR BUSINESS DECISIONS ADAPTED OR ACTS
SECURITIES ACT OF 1933, AS AMENDED. OD HOLDING NOR ITS SHAREHOLDERS INTEND TO REGISTER ANY PERFORMED BY THEM ON THE BASIS OF THE INFORMATION ANY STATEMENTS CONTAINED HEREIN OR FOR ANY
PORTION OF THE OFFERING IN THE UNITED STATES OR CONDUCT A PUBLIC OFFERING OF SECURITIES IN THE CONSEQUENTIAL, SPECIAL OR SIMILAR DAMAGES DERIVED THEREFROM.
UNITED STATES.
ANY MARKET INFORMATION AND COMPANY’S COMPETITIVE POSITION DATA INCLUDING MARKET PROJECTIONS
THIS DOCUMENT IS DIRECTED ONLY AT PERSONS (i) WHO ARE OUTSIDE THE UNITED KINGDOM OR (ii) WHO HAVE USED IN THIS DOCUMENT HAVE BEEN DERIVED FROM IN COMPANY’S STUDIES, MARKET RESEARCH REPORTS,
PROFESSIONAL EXPERIENCE IN MATTERS RELATING TO INVESTMENTS FALLING WITHIN ARTICLE 19(5) OF THE PUBLICLY AVAILABLE DATA AND INDUSTRY PUBLICATIONS. ALTHOUGH THE COMPANY HAS NO REASON TO BELIEVE
FINANCIAL SERVICES AND MARKETS ACT 2000 (FINANCIAL PROMOTION) ORDER 2005 (AS AMENDED) (THE "ORDER") THAT THIS INFORMATION OR THESE REPORTS ARE INACCURATE IN ANY MATERIAL , RESPECT , THE COMPANY
OR (iii) WHO FALL WITHIN ARTICLE 49(2)(a) TO (e) ("HIGH NET WORTH COMPANIES, UNICORPORATED ASSOCIATIONS HEREBY STATUS THAT IT HAS NOT INDEPENDENTLY CHECKED ANY COMPETITIVE POSITION, MARKET SHARE,
ETC.) OF THE ORDER (ALL SUCH PERSONS TOGETHER BEING REFERRED TO AS "RELEVANT PERSONS"). ANY MARKET VOLUME, MARKET GROWTH OR OTHERS.
PERSON WHO IS NOT A RELEVANT PERSON MUST NOT ACT OR RELY ON THIS COMMUNICATION OR ANY OF ITS
CONTENTS. ANY INVESTMENT OR INVESTMENT ACTIVITY TO WHICH THIS COMMUNICATION RELATES IS AVAILABLE ROUNDING
ONLY TO RELEVANT PERSONS AND WILL BE ENGAGED IN ONLY WITH RELEVANT PERSONS. NUMBERS PRESENTED THROUGHOUT THIS PRESENTATION MAY NOT ADD UP PRECISELY TO THE TOTALS
IN ANY EEA MEMBER STATE THAT HAS IMPLEMENTED DIRECTIVE 2003/71/EC (TOGETHER WITH ANY APPLICABLE PROVIDED IN THE TABLES AND TEXT. FOR PRESENTATION PURPOSES, FIGURES ARE ROUNDED TO THE NEAREST
IMPLEMENTING MEASURES IN ANY EEA MEMBER STATE, THE “PROSPECTUS DIRECTIVE”) THIS COMMUNICATION IS DECIMAL PLACE. PERCENTAGES, PERCENT CHANGES AND ABSOLUTE VARIANCES, HOWEVER, ARE CALCULATED
ONLY ADRESSED TO AND IS ONLY DIRECTED AT QUALIFIED INVESTORS IN THAT EEA MEMBER STATE WITHIN THE BASED ON THE EXACT FIGURES AS SHOWN IN THE FINANCIAL STATEMENTS.
MEANING OF THE PROSPECTUS DIRECTIVE.
Investor Presentation Altdorf, September, 2019 28Thank you
You can also read