GROWING IS COMMITMENT. WE POSSESS - Q4 FY2021 Earnings Presentation

Page created by Bruce Ellis
 
CONTINUE READING
GROWING IS COMMITMENT. WE POSSESS - Q4 FY2021 Earnings Presentation
Q4 FY2021
                        Earnings Presentation

GROWING
IS COMMITMENT.
WE POSSESS.                  P H A R M A C E U T IC A L S LT D .

                                H E ALTH C A R E F O R A L L

www.lincolnpharma.com                                              1
GROWING IS COMMITMENT. WE POSSESS - Q4 FY2021 Earnings Presentation
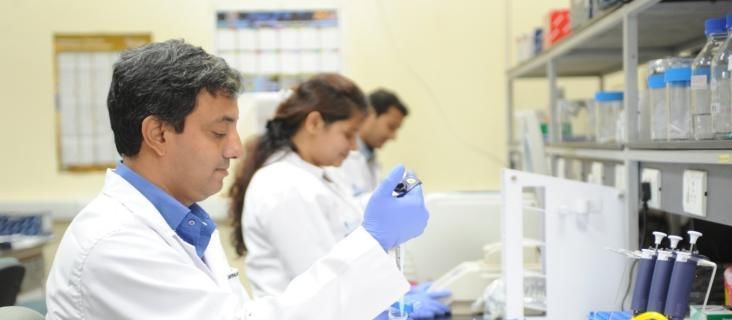
Safe Harbor

 This presentation contains statements that contain “forward looking statements” including, but without limitation, statements
 relating to the implementation of strategic initiatives, and other statements relating to Lincoln Pharmaceuticals’ future business
 developments and economic performance. While these forward looking statements indicate our assessment and future
 expectations concerning the development of our business, a number of risks, uncertainties and other unknown factors could
 cause actual developments and results to differ materially from our expectations.

 These factors include, but are not limited to, general market, macro-economic, governmental and regulatory
 trends, movements in currency exchange and interest rates, competitive pressures, technological developments, changes in
 the financial conditions of third parties dealing with us, legislative developments, and other key factors that could affect our
 business and financial performance. Lincoln Pharmaceuticals undertakes no obligation to publicly revise any forward looking
 statements to reflect future / likely events or circumstances.

Q4 FY2021 Earnings Presentation                                                                                                   2
GROWING IS COMMITMENT. WE POSSESS - Q4 FY2021 Earnings Presentation
CORPORATE OVERVIEW
      BACKGROUND                         PRODUCT PORTFOLIO                     MANUFACTURING                           EXPORTS
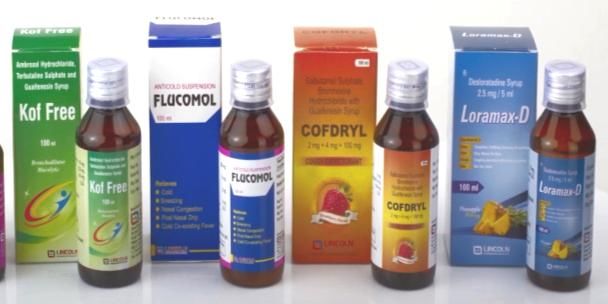
• Established in the year               • 1700 registered products and     • Manufacturing facility at       • Exports to 60 plus countries
  1979, Lincoln Pharma has                another 700 in pipeline            Khatraj in Ahmedabad, Gujarat     currently & plans to expand to
  developed 600 plus                    • Focused areas includes - Anti-   • EU-GMP, WHO-GMP and ISO-          90 countries in next 2-3 years
  formulations in 15 therapeutic          infective, respiratory             9001: 2015.                     • Exports increased to 65% of in
  areas .                                 system, gynecology, cardio &     • Green Facility producing 65%      FY21 from 11% in FY13.
• Team Strength of 1,200                  CNS, anti-bacterial, anti-         of energy consumption           • Major Markets include - East &
• FY21 - Sales at Rs. 424 crore &         diabetic, anti-malaria among       through renewable Solar &         West Africa, Central & Latin
  PAT at Rs. 62 crore                     others.                            Wind Project                      America and Southeast Asia

        FINANCIALS                             MAREKT INFO                              R&D                             RATING
• Debt Free company                     • Listed on BSE in 1996            • Awarded with 7 Patents;         • ICRA Upgraded Rating and
• 5 Year PAT CAGR 20% Plus              • Market Capitalistion of Rs.        Filled 25 plus Patent             Outlook of the company
                                          450 crore as on 31 Mar 21          Applications                    • Long Term rating is
                                        • Promoter Holding at              • DSIR Approved R&D                 upgraded to ICRA A with
                                          37.26% in Mar 21 vis-à-vis         Facilities                        stable outlook
                                          32.36% in Mar 20                 • 75 Plus R&D Professional        • Short Term rating is
                                                                             including 30 Scientists           upgraded to ICRA A1

      Q4 FY2021 Earnings Presentation                                                                                                  3
GROWING IS COMMITMENT. WE POSSESS - Q4 FY2021 Earnings Presentation
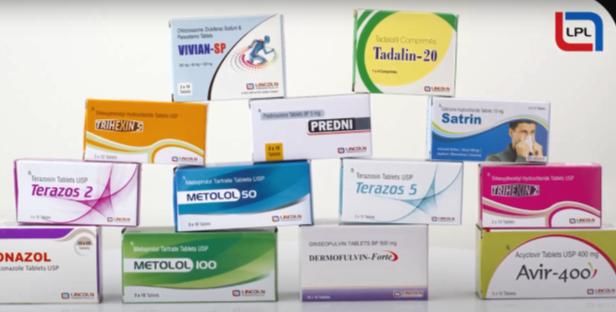
Q4 & FY21 Performance & Roadmap
• Our company is growing from strength to strength and delivering robust operational and financial performance while maintaining healthy growth in revenue, margins and
profitability and expects to continue the growth momentum in the coming years.

• Revenue for the FY 21 increased 9.75% to Rs. 424.18 crore; For FY21

• Exports for the FY 21 increased 18.4% to Rs. 270 crore; For FY21. Exports to European Union post EU GMP approval will start soon.

• Domestic Business and New Launch - Company will be introducing 6-7 new products in the domestic markets and expects 20-25 new dossiers approval for the exports market.
To complement company’s strong presence in acute segment, company is also building portfolio in lifestyle and chronic segment especially dermatology, gastro and pain
management

• Expansion Plans:-
I.   Cephalosporin Plant - Civil Work for the Cephalosporin Plant is going on and it will complete soon. Total Capex estimated for this plant is Rs.40-45 crore.
II. Setting up API unit - Pollution Control Board granted permission for setting up APIs unit.

• Amalgamation of Lincoln Parenteral Ltd to bring many synergies for both companies including competitive strength, operational efficiencies, productivity gains, and logistic
advantages, thereby significantly contributing to future growth.

• ICRA Upgrade - The rating agency ICRA has upgraded company’s long-term rating to ICRA A with stable outlook from ICRA A- and positive outlook. Short term rating of the
company upgraded to ICRA A1 from ICRA A2+ earlier.

• Promoter Holding - Promoter holding as of March 21 is 37.26%, up from 32.36% as of Mar 2020 - rise of around 4.9%. Company is committed to gradually up the promoter
holding ideally to a majority mark over the next 3-5 years.

• Outlook - Over the last 5 years, company has delivered a robust 20% plus CAGR in profits, higher single digit growth in sales. In FY 22 company expect to outpace industry
growth; Expect double digit sales growth with improvement in margins. Geographical and product expansion coupled with operational efficiency contributing to the growth.
Company is in the process of expanding presence in Africa, South East Asian countries and exploring entry in EU.

  Q4 FY2021 Earnings Presentation                                                                                                                                           4
GROWING IS COMMITMENT. WE POSSESS - Q4 FY2021 Earnings Presentation
Q4FY21 Results
            NET REVENUE                                    EBITDA                     PAT
                                                   38.9%                                     12.6
            -0.7%                                                   17.78
                                                                             41.6%

                                                  12.8
     82.7                  82.1
                                                                              8.9

   Q4FY20                 Q4FY21              Q4FY20                Q4FY21   Q4FY20         Q4FY21

Q4 FY2021 Earnings Presentation    Fig (Rs. Cr)                                                     5
GROWING IS COMMITMENT. WE POSSESS - Q4 FY2021 Earnings Presentation
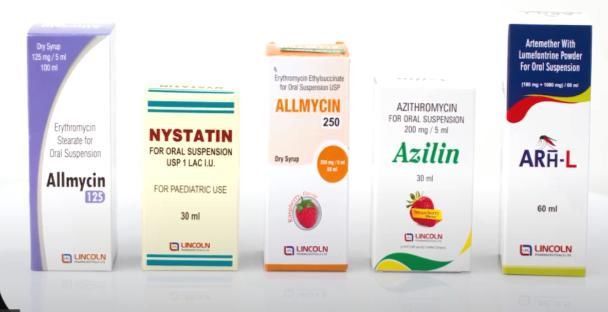
Performance – Focused Therapeutic Areas
                                                        Revenue Breakup
                                                                            4% 2% 3%    2%                     General Anti Infectives
                                                                       9%                      24% 25.9%
                                                               31.9%                                           Respiratory Systems
                                           23.1%
 Therapeutic Area

                    33.7%                                        14%                                           Alimentary Tract and Metabolism
                                                                                                               Genito Urinary System and Sex Hormones
                                   FY21                                                FY20
                                                                  13%                           15%            Musculo-Skeletal System
                                                 8.4%                    14%                            8.7%   Parasitology
                                                                                                               Blood and Blood Forming Organs
                                                                                                      7.4%
                       12.9%              6.4%                    9.2%                                         Cardiovascular System
                                  15.5%                                           16.9 %
                                                                                                               Central Nervous System
                                                                                                               Others

                      35%
                                                                  43%
 Geography

                                                                                              41%
                                                                                                                International
                                   FY21                                                FY20
                                                                                        59%
                                                                                                       57%
                                                 65%
                                                                                                                Domestic

Q4 FY2021 Earnings Presentation                                                                                                                    6
GROWING IS COMMITMENT. WE POSSESS - Q4 FY2021 Earnings Presentation
Performance Overview
                                      Consolidated Financial Performance
                                           Q4              Y-o-Y       Q3        Q-o-Q             Full Year           Y-o-Y

Particulars (mn.)                 FY2021        FY2020   Growth (%)   FY2021   Growth (%)   FY2021        FY2020     Growth (%)

Net Revenue                        821           827       -0.7%      1,155      -28.9%     4,299          3,975       8.1%

EBITDA                             177           128       38.3%       207       -14.5%      928               766     21.1%

            Margin (%)            21.6%         15.5%                 17.9%                 21.6%          19.3%

Profit Before Tax                  153           115       33.0%       184       -16.8%      837               672     24.5%

            Margin (%)            18.6%         13.9%                  16%                  19.5%          16.9%

Profit After Tax                   126           89        41.6%       135       -6.7%       622               514      21%

            Margin (%)            15.3%         10.8%                 11.7%                 14.5%          12.9%

Basic EPS (Rs.)                    6.29          4.47      40.7%       6.74      -6.7%      31.11          25.72       20.9%

Note:
• Financials are as per IND-AS

Q4 FY2021 Earnings Presentation                                                                                                   7
GROWING IS COMMITMENT. WE POSSESS - Q4 FY2021 Earnings Presentation
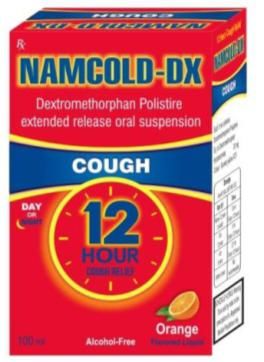
About - Lincoln Pharmaceuticals Ltd

                                     Providing Affordable and Innovative
                                        medicines for healthier lives.

                                  VISION
                                  To spark a universal attempt to uncover cures of diseases by
                                  focused and targeted R&D, through forging Strategic alliances
                                  both domestically and internationally.

                                  MISSION
                                  1. Focused on delivering outcomes that meet important medical
                                     needs, making quality medicines more accessible and more
                                     affordable, and provide solutions for tomorrow’s health
                                     challenges.
                                  2. To create “Healthcare for All” an actuality by modest
                                     participation of premium low-cost pharma products

Q4 FY2021 Earnings Presentation                                                                   8
GROWING IS COMMITMENT. WE POSSESS - Q4 FY2021 Earnings Presentation
Key Milestones

          1979                                  1984-85                                1992                              1995-96
    Lincoln was incorporated &
                                      Received WHO – GMP for plant /       Converted in to a Public Limited
   commences operations as a                                                                                    Launched IPO & Listed on BSE
                                              production unit                        Company
     Partnership Firm

                                                                                    2015-16                              2016-17
             2000                               2010-11
                                                                                    Listed on NSE             Launched 3 products which are first
   Domestic Market Expansion;          Developed & Launched 3 NDDS
                                                                            Installed Windmill 2.1 MW in        time in India; Entered regulated
   Covered 80% of India Market                   products
                                                                             addition to 600 KVA in 2009      African & Latin American countries

           2017-18                              2018-19                             2019-20                              2020-21
    Launched Next Generation         1MW Solar Roof installed; Targeting    Received EU GMP; Patent for              Debt Free company ;
Progesterone Therapy “ProlinSpray”     Regulated Market Inspection            Diclofenac Rectal Spray;            Launched Vitamin C + Zinc

  Q4 FY2021 Earnings Presentation                                                                                                             9
GROWING IS COMMITMENT. WE POSSESS - Q4 FY2021 Earnings Presentation
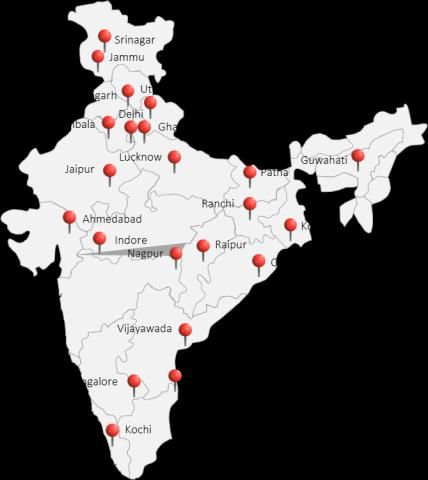
Growth Drivers – Ready for the Next Big Leap
                                  • Pollution Control Board granted permission for setting up API Unit
        CAPEX                     • Civil Work for the Cephalosporin Plant is going on and it will complete soon. Total Capex estimated is Rs.40-45 crore.

                                  • Export Network to increase to 90+ Countries from 60 currently
Export Network                    • Received EU GMP from Germany FDA; Will allow company to market in all 27 member countries of EU

Amalgamation                      •Amalgamation of Lincoln Parenteral Ltd to bring synergies for both companies and will lead to increased competitive
                                   Strength, Cost reduction and efficiencies, production gains

Strong Finances                   • Strong liquidity position of the company; Debt Free company

                                  • Focus on expanding product portfolio, Patent & NDDS through R&D
 New Product                      • Building a strong portfolio in lifestyle and chronic segment especially women healthcare, dermatology to complement
                                    its strong presence in the acute segment.

                                  • Over the last 5 years, company has delivered a robust 20% plus CAGR in profits, higher single digit growth in sales.
Growth Outlook                    • ICRA Upgraded Rating and Outlook of the company

Q4 FY2021 Earnings Presentation                                                                                                                            10
Lincoln Pharmaceuticals Ltd - Financial Overview
            Year                  Revenue                  EBITDA                        PAT                        EPS                  Share Price
            FY 21                        424                  92                         62                      31.11                       225
            FY 11                        189                  13                            6                    4.51                         35
       10 Yrs CAGR                    8.42%                21.61%                   26.31%                    21.33%                      20.45%
          Book Value (Per Share)                              Market Cap (Rs. Cr)                                     Net Debt (Rs. Cr)
                                                     472
                                           188                                                   450
                                                               420       425
                                157                                                                        108        108
                      135
                                                                                                                                71.1
            112                                                                    268
  96

                                                                                                                                           -7.5
                                                                                                                                                    - 10.91
                                                                                                          FY 2017    FY 2018   FY 2019    FY 2020   FY 2021
FY 2017    FY 2018   FY 2019   FY 2020    FY 2021   FY 2017   FY 2018   FY 2019   FY 2020       FY 2021

    Q4 FY2021 Earnings Presentation                                                                                                                 11
Business Revenue Mix
  Particular (Rs. cr)              FY 2013           (%)          FY 2017     (%)            FY 2021               (%)

Domestic Sales                     145.03           74.5%         246.46     67.4%            146.85             35.27%

Exports                             49.67           25.5%         119.27     32.6%            269.56             64.73%

FY13                                         FY17
                           25.5                                                      FY21
                                                                      32.6
                                                                                            35.3

                                                                                                                 64.7
                                                    67.4
       74.5

         Exports     Domestic                          Exports   Domestic                          Exports   Domestic

 Q4 FY2021 Earnings Presentation                                                                                        12
Global Footprint
  Presence over 60 + Countries in Europe, Latin America, Africa, Asia Pacific, South East Asia and 26 States across India

         Europe:
         France

South & Central             Africa:                                    Asia :
America :                   Angola, Benin, Botswana, Burkina           Afghanistan, Armenia, Azerbaijan,
Bolivia, Chile, Costa       Faso, Burundi, Cameroon, Ethiopia, Gab      Bhutan, Cambodia, Fiji, Hong
Rica, Ecuador, El-          on, Ghana, Ivory                           Kong, Iraq, Lebanon, Kazakhstan,
Salvador, Guatemala, G      Coast, Kenya, Madagascar, Malawi, Mali     Mauritius, Myanmar, Nepal, Phili
uyana, Honduras, Jama       , Mozambique, Niger, Nigeria, Senegal, S   ppines, Sri                         International Presence
ica, Panama, Peru, Suri     eychelles, Sierra Leone, Somalia, South    Lanka, Thailand, Turkmenistan, Uz   C&F Agent Location in India
name, Trinidad &            Sudan, Sudan, Tanzania, Togo, Uganda, Z    bekistan, Vietnam, Yemen
Tobago                      ambia, Zimbabwe, Zanzibar

Q4 FY2021 Earnings Presentation                                                                                                          13
Research & Development
                                                         NDDS Formulations Introduced as First Time in India
                                                          Anti-fungal vaginal spray
                                                          Diclofenac rectal spray
                                                          Sildenafil oral spray
                                                          Ondansetron Hydrochloride Oral Spray (DOMI-UP)
                                                          Paracetamol 1000mg Programmed Release Tablet (PA-12)
                                                          Micronized Progesterone Vaginal Spray (PROLIN)
                                                          Namcold DX Oral Suspension
                                                          First one to introduce TINNEX for the relief of Tinnitus

          R&D Expenditure as % of Sales                  Research Facilities                                R&D Team
                                                         Senior Scientist                                        15
                                  3.2%
                                          2.6%           Junior Scientist                                        18
                    2.0%
                                                         Analysts                                                18
 1.6%
                                                         Regulatory Personnel                                    12
 3.43               7.95          11.7    10.6
                                                         Administrative Personnel                                9
 FY 14              FY 16         FY 18   FY 21          Others                                                  6
                                          Fig (Rs. Cr)   Total                                                   78
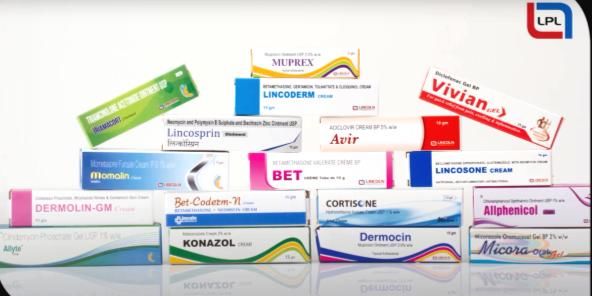
Q4 FY2021 Earnings Presentation                                                                                  14
Innovations - Lincoln Pharma

Q4 FY2021 Earnings Presentation   15
Product Range - Lincoln Pharma

Q4 FY2021 Earnings Presentation   16
Wide Spectrum of Therapeutic Coverage

                                   Cough & Cold /                             Sterile Ophthalmic
              Dermatologist                               Gyneacologial                             Gastro Intestinal
                                  Anti Allergic / Anti-                               Eye
               Preparation                                  Products                                     Range
                                      asthmatics                               Drops/Ointment

                                                          Anti-bacterial /
                                  Vitamins / Minerals                          Analgesic / Anti-
              Anti-malarial                               Anti-viral/ Anti-                             Otology
                                    / Anti-oxidants5                               pyretic
                                                               fungal

                                                                                                   Phosphodiesterase
                                    Anti-Psychotic /      Cardiac / Anti-     Anti-Diarrhoeal /
                                                                                                    Type 5 Inhibitor
              Anti-Diabetic         Anti-Convulsant       Hypertensives /     Anti-Spasmodic /
                                                                                                      and General
                                   /Anti-Depressant          Diuretic             Laxative
                                                                                                      Anesthetics

Q4 FY2021 Earnings Presentation                                                                                         17
Best in Class Facilities
                                                                       Certifications: EU-GMP, WHO-GMP Certified; ISO 9001:2015
                                                                       Certified

                                                                       R&D Center: Approved by Government of India; Team of 30 scientists
                                                                       for R&D

                                                                       Green Energy: Windmill project for captive consumption; 1MW Solar
                                                                       Roof installed

                     Dosage Forms Produced at Unit 1                                 Dosage Forms Produced at Unit 2

       Description                       Annual Capacity   Unit       Description         Size               Annual Capacity Unit

        Tablet (Compression & Coating)    21,600 Lakhs     Tablets    Liquid Ampoules     1 ml to 5 ml         60,000,000    Ampoules
                                                                                          10 ml                30,576,000    Ampoules
        Tablet (Granulation)                9,00,000       Kg
                                                                      Liquid Vials        2 ml to 10 ml        15,600,000    Vials
        Capsule (Filling)                  2,340 Lakhs     Capsules                       10 ml to 30 ml       15,600,000    Vials
                                                                      Oral Liquids        60 ml to 100 ml      18,000,000    Bottles
        Dry Syrup (Filling)                 72,00,000      Bottles
                                                                                          150 ml to 200 ml     18,000,000    Bottles
        Ointment (Filling)                  336 Lakhs      Tubes
                                                                      Dry Powder Injection 100 mg              22,464,000    Vials

Q4 FY2021 Earnings Presentation                                                                                                         18
Financial Highlights
                          Revenue                                                  EBITDA
                                                                                                          93
                                                     424
                                                                                      67        66
                                            386                           53
                                                                47
   360             361              366

 FY 2017        FY 2018         FY 2019   FY 2020   FY 2021   FY 2017   FY 2018     FY 2019   FY 2020   FY 2021

                                PAT                                               Net Worth
                                                                                                         376
                                                      62                                       313.1
                                            51                                       269.3
                                    49                                   224.5
                 35                                            192.6
  28

FY 2017        FY 2018        FY 2019     FY 2020   FY 2021   FY 2017   FY 2018     FY 2019   FY 2020   FY 2021

  Q4 FY2021 Earnings Presentation                                                                        19
Profitability Ratios
                         EBITDA Margin                                           PAT Margin
                                18%                 21%                            13.4%                14.6%
                                          17%                                                 13.2%
                 15%
 13%                                                                    9.7%
                                                              7.8%

FY 2017        FY 2018        FY 2019    FY 2020   FY 2021   FY 2017   FY 2018     FY 2019    FY 2020   FY 2021

                               ROCE                                                RONW
                               22.0%               22.1%                           18.3%
21.0%                                    20.5%               17.0%                            16.3%     17.5%
                15.0%                                                  12.7%

FY 2017        FY 2018        FY 2019    FY 2020   FY 2021   FY 2017   FY 2018     FY 2019    FY 2020   FY 2021

  Q4 FY2021 Earnings Presentation                                                                        20
Shareholding Information
                                                  Mar 2021                                   March 2020
Investor Category                   No. of       No. of Shares   % Holding      No. of       No. of Shares       % Holding
                                    Shareholders Held                           Shareholders Held
Promoter Group                           30         74,51,904      37.26%               30        64,71,379           32.36
Public Holding                         21,385      1,25,48,096     62.74%            15,138       1,35,28,621         67.29
Total                                  21,415      2,00,00,000     100.00%           15,168       2,00,00,000         100.00

                                                                 Stock Information                    As on 31 March 2021
                                                                 No. of Equity Shares                     2,00,00,000
                                                                 Face Value (INR)                               10
                                                                 Market Price (As on 31 March 2021)             225

                                                                 52 Week High / Low                        283 / 85.5
                                                                 Market Capitalisation (Rs. Cr)                 450

  Q4 FY2021 Earnings Presentation                                                                                       21
22
You can also read