Indiana: 2019 State of Digital Inclusion - Publication created by the Purdue Center for Regional Development and Purdue Extension
←
→
Page content transcription
If your browser does not render page correctly, please read the page content below

Indiana: 2019 State
                     of Digital Inclusion

          Publication created by the Purdue Center for Regional Development and Purdue Extension

January 2021                                                     Roberto Gallardo, Bo Beaulieu, Indraneel Kumar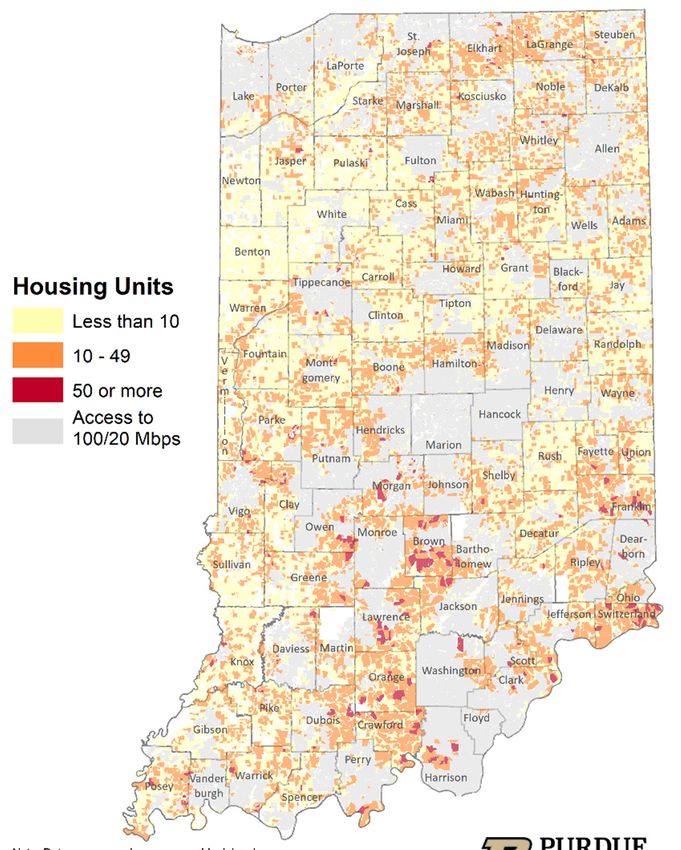
1

The COVID-19 pandemic has had a significant impact across the
state. According to the Indiana State Department of Health, as of
mid-January 2021, more than half a million Hoosiers have been
infected and around 8,000 have died.

Beyond the human impact, many businesses have been                                 of these three layers across multiple socioeconomic
affected, especially those in the hospitality and food                             contexts leads to varying degrees of digital exclusion,
industries. According to Harvard’s Opportunity Insights                            which in turn affect a community’s ability to adapt to
Tracker1, the number of small businesses in the state                              and prosper in the digital age.
declined by 32% between January and December 2020.
                                                                                   To summarize, while digital inclusion can be framed as a
In addition to these impacts, COVID-19 has also brought                            social justice and equity issue, it can—and should—also
to the forefront a decades-old issue called the “digital                           be framed as a community and economic development
divide”. As individuals, organizations, and businesses                             issue. A digitally inclusive community or region ensures
scrambled to remote work, conduct business online,                                 that all residents, organizations, and businesses can
or e-learn, the issue of the digital divide became                                 participate fully in an increasingly digitized community,
abundantly clear. The term “digital divide” was coined in                          society, and economy. This report will review a series of
the mid-1990s and refers to those that have access, can                            2019 metrics to get a better idea of the state of digital
afford, and use the internet versus those that cannot.                             inclusion in Indiana.

However, like any divide, it implies that it can be bridged;                       The first section discusses three distinct but related
yet as digital technologies and its applications continue                          broadband availability metrics: 1) data reported to the
to evolve, expecting a one-time bridge to produce an                               Federal Communications Commission via Form 477;
even playing field is naïve. Consider for example how                              2) a metric provided by Microsoft; 3) and speed tests
the digital divide concept itself has evolved over time.                           results across the state. These three metrics describe a
The first-level digital divide was understood as a binary                          robust landscape of broadband availability. The second
yes/no access to the technology; the second-level divide                           section explores multiple indicators associated with
is understood more in terms of how the internet is used                            broadband adoption and use, including the homework
and why; and the third-level digital divide is attempting                          gap and internet income access inequities.
to understand how these different internet uses result
                                                                                   The third section examines multiple innovative metrics
in varying social, political, economic, and cultural
                                                                                   regarding the digital divide, digital distress, and remote
outcomes2.
                                                                                   work and e-learning vulnerability. It also explores digital
A broader concept—digital inclusion—can be used to                                 economy trends, including the impact of digitization
integrate these different digital divide levels while also                         on workers and jobs. Lastly, the concluding section
accounting for distinct social and economic contexts.                              presents a series of recommendations that build on the
In other words, digital inclusion refers to the adoption                           findings of this report.
and meaningful use of digital applications for social and
economic benefits revolving around three main layers
of connectivity, devices, and skills3. The interaction

1. EconomicTracker/data at main · OpportunityInsights/EconomicTracker · GitHub (link)
2. Conceptualizing and Testing a Social Cognitive Model of the Digital Divide on JSTOR (link)
3. Community Developments Investments (November 2018) | OCC (treas.gov) (link)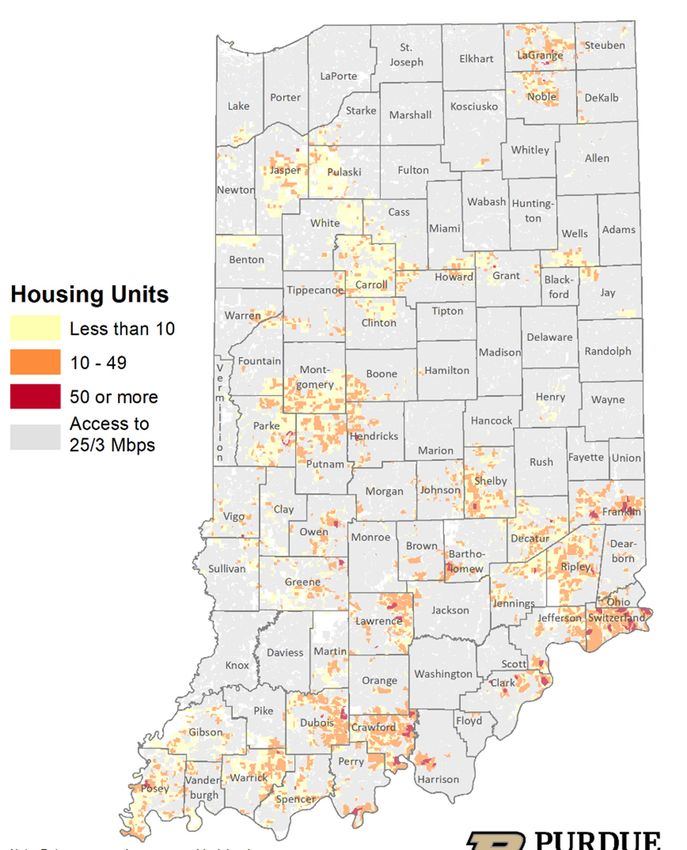
2

SECTION I. BROADBAND AVAILABILITY

The most popular source of broadband availability                                block (smallest geographic level for which the Census
data is the Federal Communications Commission (FCC)                              compiles demographic information).
Form 477, a document that Internet providers file twice
                                                                                 COVID-19 made many homes and businesses realize
per year. This dataset includes broadband availability
                                                                                 that advertised 25/3 is simply not enough when
data at the Census block level including technology and
                                                                                 multiple e-learners and remote workers are attempting
advertised maximum speeds. Although the dataset
                                                                                 to go online, usually at the same time. In fact, a survey
is known to overestimate broadband availability4, it
                                                                                 of about 2,800 households across six rural communities
remains the only comprehensive broadband dataset
                                                                                 in Indiana found that while more than 90% had internet
available.
                                                                                 access at home, 60% of these were unsatisfied with
The FCC defines “served” as areas having access to                               their home service5.
at least 25 megabits per second download (Mbps)
                                                                                 Figure 2 includes a significantly faster broadband
and 3 Mbps upload, or 25/3 for short. About 261,300
                                                                                 threshold of 100/20 Mbps and the housing unit density
Hoosiers—or 3.9% of the population—did not have
                                                                                 outside of this footprint. Roughly 13.5% of residents or
access to advertised 25/3. Regarding housing units,
                                                                                 907,000 are outside this 100/20 footprint compared to
3.8% do not have access to advertised 25/3. Figure 1
                                                                                 roughly 13.0% of housing units or 379,000.
shows housing unit density (shades of orange) in the
state outside the 25/3 Mbps footprint at the Census

   Figure 1                                                                          Figure 2

4. FCC Underestimates Americans Unserved by Broadband Internet by 50% (broadbandnow.com) (link)
5. Internet connectivity in rural Indiana: A quality of service problem (link)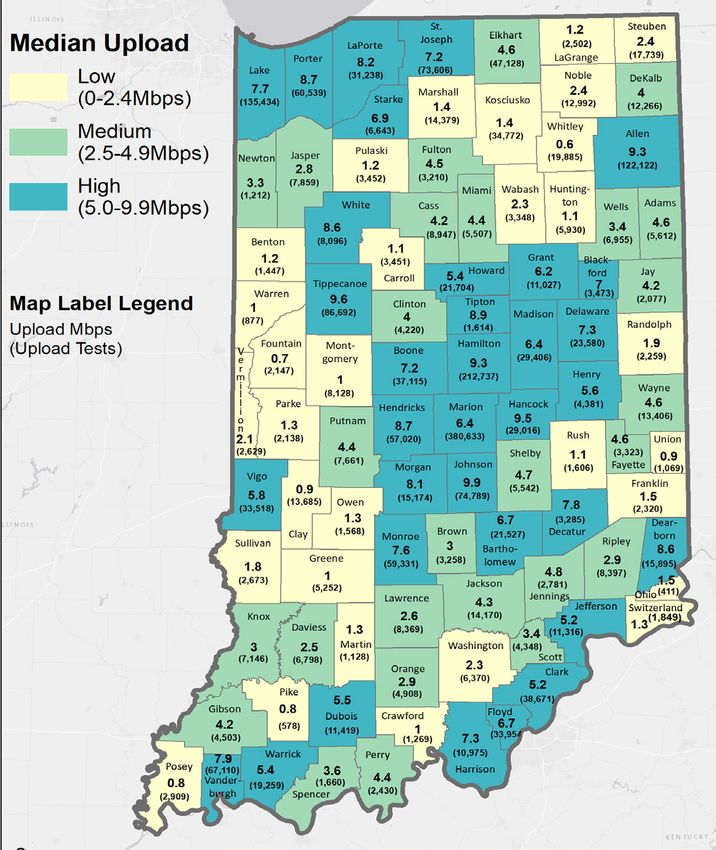
3

Aside from the speed thresholds, it is important to                             Another key metric to consider in addition to maximum
understand access to a variety of providers. Figure                             advertised speeds, is actual speeds. While speed
3 shows the percent of housing units with access to                             tests are not the perfect assessment of broadband
multiple providers for both advertised 25/3 and 100/20                          availability, they do provide a valuable piece of
Mbps. For example, 47.6% of housing units in the                                additional information. Microsoft published a county-
state have access to three or more providers offering                           level dataset estimating the percent of people not
advertised 25/3 versus 9.2% offering 100/20 Mbps.                               using the internet at a minimum download speed of
                                                                                25 Mbps6. This percent was obtained by using server
Different broadband technologies offer different
                                                                                logs when computer users were requesting updates of
advertised speeds. Figure 4 showcases the average
                                                                                Microsoft Office, Windows, Xbox, and/or other software
maximum advertised speed by broadband technology.
                                                                                applications. Figure 5 shows the percent of population
Notice how cable and fiber provide the fastest average
                                                                                per county in Indiana that did not use the internet at
download speeds. Also, note that fiber offers the closest
                                                                                a minimum of 25 Mbps during November of 2019.
to symmetrical speeds (where download and upload
                                                                                These are classified into three equal (same number of
speeds are identical).
                                                                                counties) groups: low, medium, and high.

                                                                                                      Figure 3

                                                                                                      Percent of population per
                                                                                                      county in Indiana that did
                                                                                                      not use the internet at a
                                                                                                      minimum of 25 Mbps during
                                                                                                      November of 2019.

                                   Figure 4

                   Average maximum
                 advertised speed by
            broadband technology.

6. Microsoft Airband: An annual update on connecting rural America - Microsoft On the Issues (link)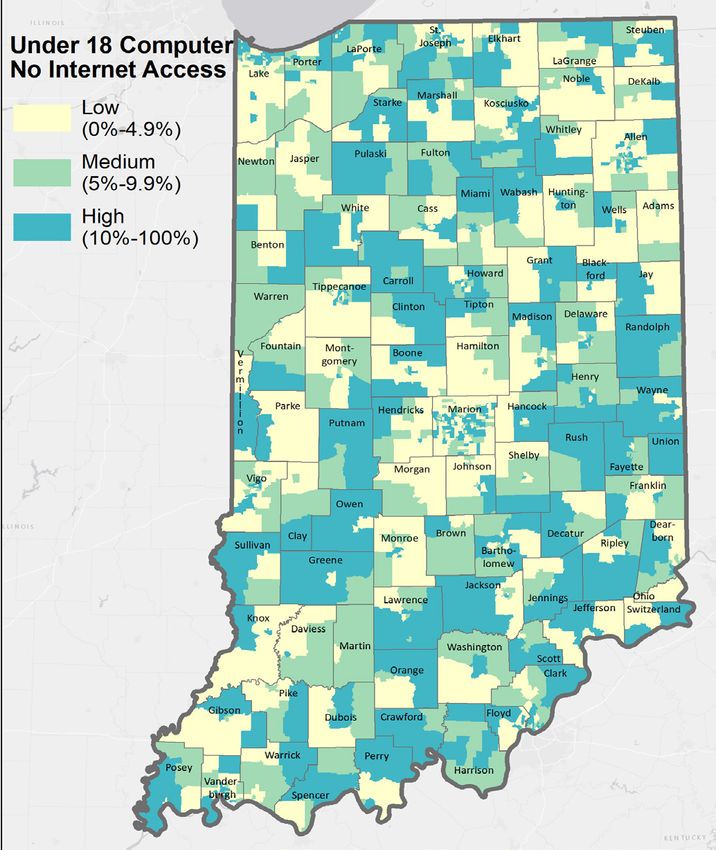
4

         Figure 5                                              Figure 6

       Another metric available is one that captures results
       of speed tests stored and analyzed by M-Lab. M-Lab
       has developed speed tests that can be embedded
       on websites and apps (for example, the TestIT app
       supported by the National Association of Counties7).
       Figures 6 & 7 show the median download and upload
       speed test results conducted throughout 2019 on a
       per county basis, as well as the number of speed
       tests conducted. These two are grouped into low,
       medium, and high.

       To summarize, FCC data show that roughly 3.8% of
       Hoosiers do not have access to advertised 25/3 while
       Microsoft found that close to two-thirds (62.4%) of
       Hoosiers do not use the internet at a minimum speed
       of 25 Mbps download, a very significant difference.
       This strongly suggests that more accurate broadband
       availability data are needed.

                                                                 Figure 7

7. TestIT: How Fast is Your Broadband (naco.org) (link)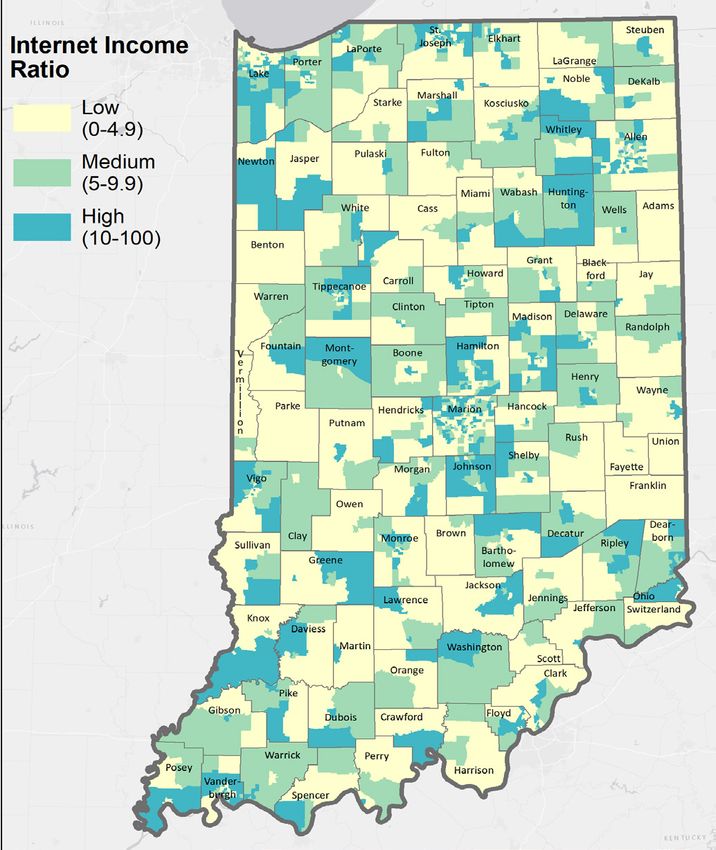
5

SECTION II. BROADBAND ADOPTION, HOMEWORK
GAPS, AND DIGITAL EQUITY

The previous section reviewed multiple indicators
associated with broadband availability. A key point to
remember is that broadband availability results will vary
depending on the metric used. Therefore, it is important
to crosscheck these metrics with locally gathered data,
such as household surveys and even word of mouth
when pursuing broadband planning.

Aside from availability, research has found that
broadband adoption—as opposed to availability—has a
bigger bang for the buck when it comes to employment,
income, etc.8 Unfortunately, the ideal national dataset
that records how the internet is being used and to what
extent at the county-level, is not available. However,
there are several metrics that can be used as proxies to
broadband adoption.

First, Figure 8 divides counties in the state into low,
medium, and high categories depending on the percent
                                                                                       Figure 8
of households with no internet access. While the data
themselves do not tell us why there is no internet
access (e.g., service is not available, not reliable, or it is
too expensive), they do provide a better understanding
of broadband adoption.

Another innovative metric regarding internet use is
venture densities. A venture is a website, business or
nonprofit, and its redirects including email, payments,
and social media. Therefore, a venture density is the
number of active and highly active websites per 100
residents. A highly active venture also considers how
old is the website, its traffic, associated links, and how
built-out it is. This metric was calculated by using data
from the webhosting company Go Daddy. Figures 9 & 10
showcase Indiana counties grouped into low, medium,
and high buckets based on their active and highly active
venture densities.

                                                                                       Figure 9

8. Does rural broadband impact jobs and income? Evidence from spatial and first-differenced regressions - ProQuest (link)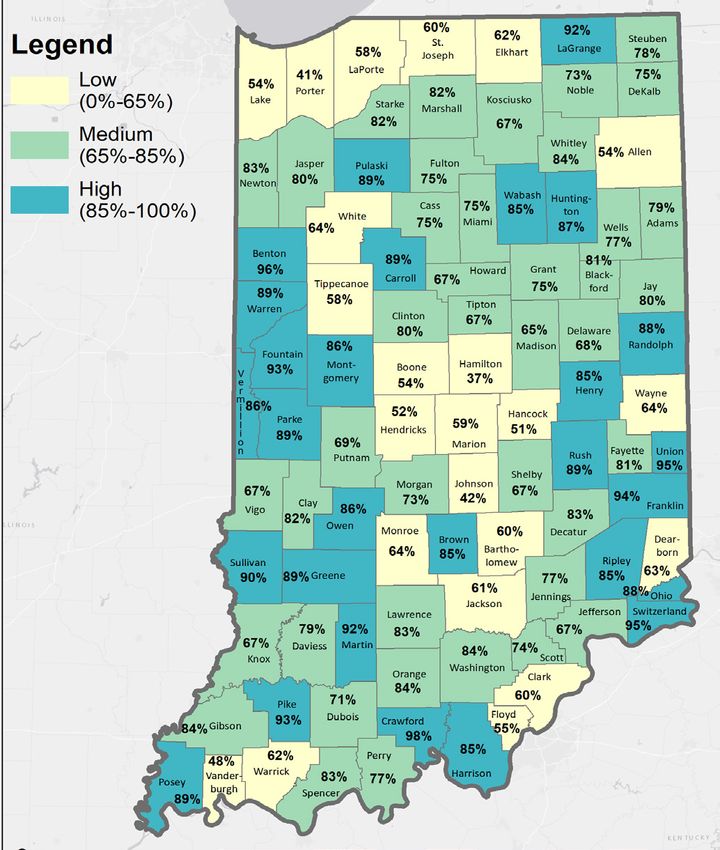
6

    Figure 10                                              Figure 11

An important topic related to digital inclusion is the
homework gap. The concept refers to children not
being able to complete homework assignments at
home due to lack of computers or internet, or both.
Figure 11 shows Census tracts (can include multiple
neighborhoods and data are more granular than
county-level) in the state based on the percent of
residents under 18 with access to a computer but
with no broadband subscription. Again, tracts are
grouped into low, medium, and high.

Any digital inclusion effort will try to address digital
inequities, especially when it comes to income.
Figure 12 shows Indiana Census tracts grouped
into low, medium, and high categories based on an
innovative metric called the internet income ratio or
IIR. This ratio is calculated by dividing the percent of
homes making less than $35,000 without internet
access by the percent of homes making $75,000 or
more without internet access. A higher IIR denotes
a higher inequality when it comes to internet access
                                                           Figure 12
based on income.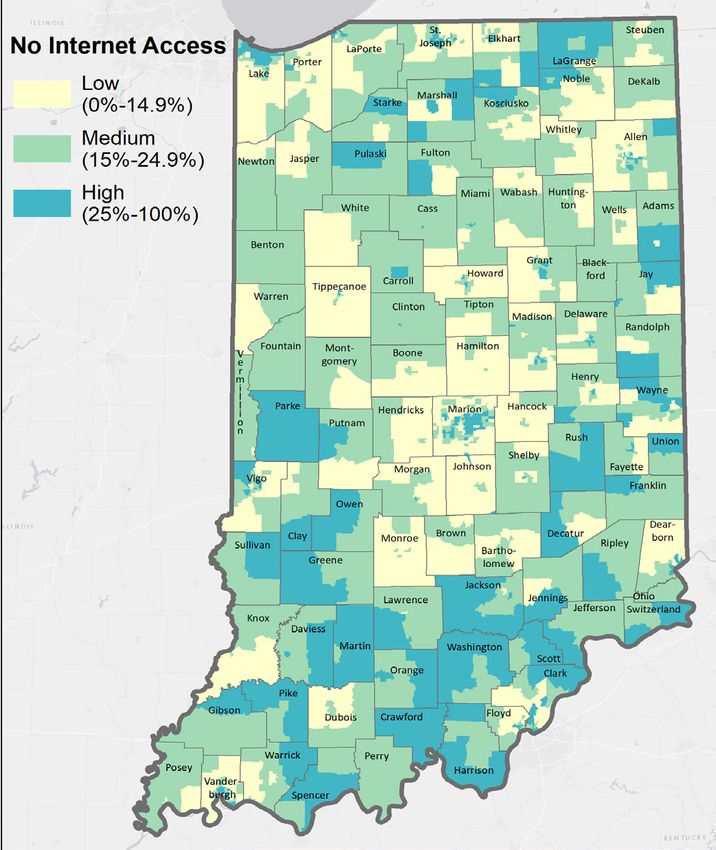
7

SECTION III. SOCIOECONOMIC IMPACTS

Like broadband availability, broadband adoption is
                                                             About 15% of the population living
measured in a variety of ways. The previous section
looked at multiple indicators that serve as proxies for      in high digital divide index score
broadband adoption and use. However, a key question          areas are children.
that arises is this: “What metrics should be used?”
While there is no singular metric that can be used to
describe a complex concept, a combination of metrics         The final metric analyzed is the digital divide index or
can provide a more robust understanding of the digital       DDI. The DDI compiles a mix of variables that measure
inclusion landscape.                                         availability, adoption, and equity, as well as key
                                                             socioeconomic characteristics that are known to affect
In this section, we review a combination of three
                                                             technology adoption, into a score ranging from 0 to 100,
innovative metrics: the remote work & e-Learning
                                                             where a higher number denotes a higher divide. Figure
vulnerability metric or ReV; the digital distress metric;
                                                             15 illustrates Census tracts in the state based on their
and the popular digital divide index. In addition, we
                                                             low, medium, or high digital divide index. About 15% of
examine trends regarding jobs and digital skills level as
                                                             the population living in high digital divide index score
a way of framing the nature and implications of digital
                                                             areas are children.
exclusion in Indiana.

The Purdue Center for Regional Development
developed the ReV metric during the early stages of the
pandemic to showcase the areas in the state that would
have a harder time implementing COVID-19 mitigation
strategies, such as remote work and e-learning. These
areas were deemed vulnerable due to 1) poor or
inadequate connectivity, 2) a higher homework gap,
and 3) a higher share of jobs/occupations that were
not remote work friendly9. Figure 13 shows the Census
tracts in the state with a low, medium, and high levels
of ReV. When all is said and done, roughly about 31% of
Hoosiers live in high vulnerability areas.

On a similar note, areas in digital distress have a higher
share of households with either no internet access
or relying solely on their cellular data connections, as
well as having no computer device or relying solely on
mobile devices. Cellular data plans and mobile devices
undermine the technology’s potential due to limited
data plans and smaller screens, whereas no computing
devices nor internet access places homes in “internet
darkness”. Therefore, these areas are in digital distress.
Figure 14 shows Census tracts in Indiana in low,                 Figure 13
medium, or high digital distress. Close to one-fifth of
Hoosier households lived in high digital distress areas.

9. Purdue Center for Regional Development (link)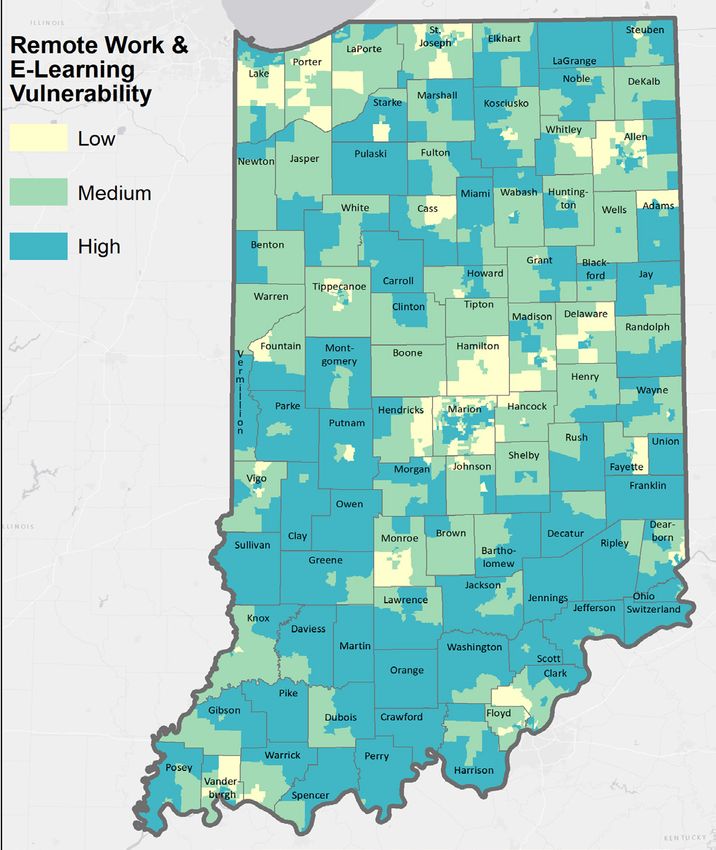
8

    Figure 14                                                           Figure 15

As discussed previously, digital exclusion varies depending on the metric utilized. However, the analysis undertaken
in this report highlights digital inequities and exclusion in various areas of the state. The matter of digital inclusion is
an important issue to address given the increasingly rapid pace at which the society and economy are digitizing. For
example, Figure 16 depicts that the state of Indiana had a net gain of jobs of 113,922 between 2010-2019—based on
occupations whose digital skill levels were identified. These constituted about 85% of all jobs10. On the other hand, job
requiring low digital skills decreased by 158,276 while those needing medium or high digital skills increased by 272,199.
In other words, all job gains in occupations whose digital skills were identified occurred in jobs requiring medium or high
digital skills over the past decade.

                                 Figure 16

                    Change in jobs by
                       digital skills level
                            (2010-2019).

10. Digitalization and the American workforce (brookings.edu) (link)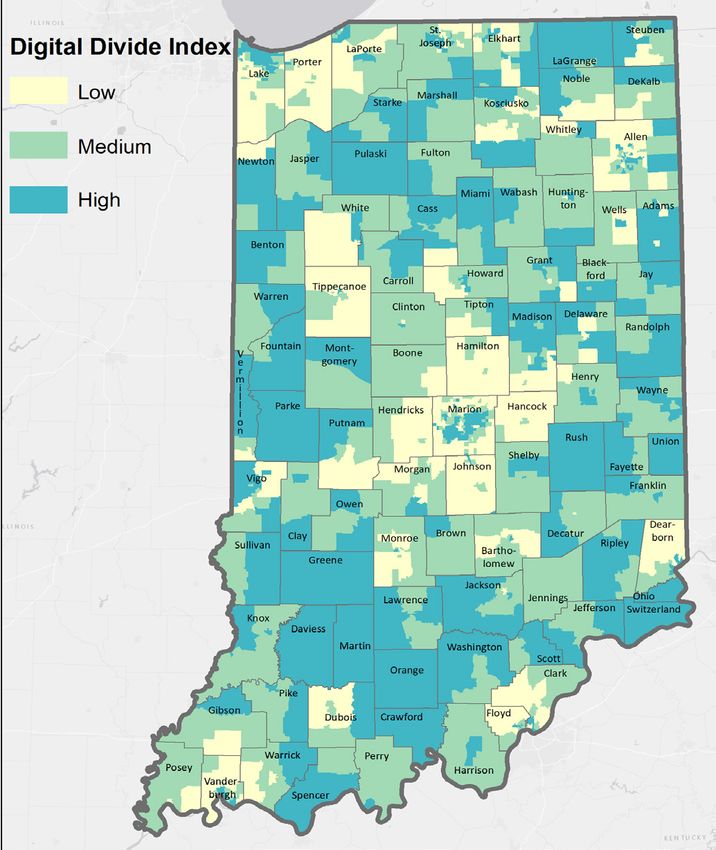
9

CONCLUSIONS

Although assets have been put in place and investments          3. Continue supporting devices and connectivity
are being made regarding broadband in the state                 for students.
of Indiana, much work remains to be done to ensure
Indiana is a digitally inclusive state. Below are a series of   The homework gap is one facet of digital exclusion.
conclusions and/or recommendations moving forward               However, the state has taken steps to address this with
that can help the state achieve this overarching goal:          programs such as the Governor’s Emergency Education
                                                                Relief (GEER). Efforts like these should continue and be
                                                                flexible enough to address issues as the technology and
                                                                applications evolve.
1. Gather more accurate data on broadband
availability.

As discussed in Section I of this report, broadband             4. Increase awareness of digital exclusion and
availability results vary significantly depending on the        its implications.
source being used. While existing federal data tend
to overestimate availability, conducting speed tests            COVID-19 has shed a bright light on the digital divide
alone are not the principal solution. A systematic effort       issue. While this is helpful, informing and educating
must be undertaken to gather and track more accurate            community leaders and residents about this issue
broadband data throughout the state, combining                  and potential solutions, is of paramount importance.
secondary as well as primary data sources (e.g.,
                                                                Moreover, embedding digital inclusion into larger
household surveys).
                                                                community and economic development planning is
                                                                essential.

2. Revise funding eligibility criteria.
                                                                5. Incentivize communities and regions to
Communities securing federal broadband dollars are              engage in digital inclusion planning.
excluded from receiving state broadband dollars under
the current law. While the intent is to avoid “overbuilding”,   Parallel to the awareness effort (see number 3),
the reality is that these networks are expensive and            communities and regions, especially in rural areas,
require multiple funding sources. If recommendation             need to be offered incentives to draft comprehensive
number one is in place, then unserved and underserved           digital inclusion plans and help jumpstart taskforces
areas will be easier to identify. If possible, increase the     and coalitions to address the issue. While digital
minimum speed threshold to ensure networks are                  inclusion is a social justice issue, it is a vital community
adequate for future—not current—digital applications.
                                                                and economic development issue as well. Thus, digital
Household surveys indicate quality (including speed
                                                                inclusion plans should be an important component
and cost) and not availability is more of an issue.
                                                                of any comprehensive community and/or economic
Likewise, establish a process where communities have
                                                                development plan.
a say in the selection and the planning process. This will
empower communities to put some skin into the game
and not rely entirely on data or timing defined by the
providers.
You can also read