Southern Area Fire Risk Assessment Spring 2021 - Southern Area Coordination Center
←
→
Page content transcription
If your browser does not render page correctly, please read the page content below
Southern Area Fire Risk Assessment

                           Spring 2021

                   Southern Area Coordination Center
                        Rapid Assessment Team

Rapid Assessment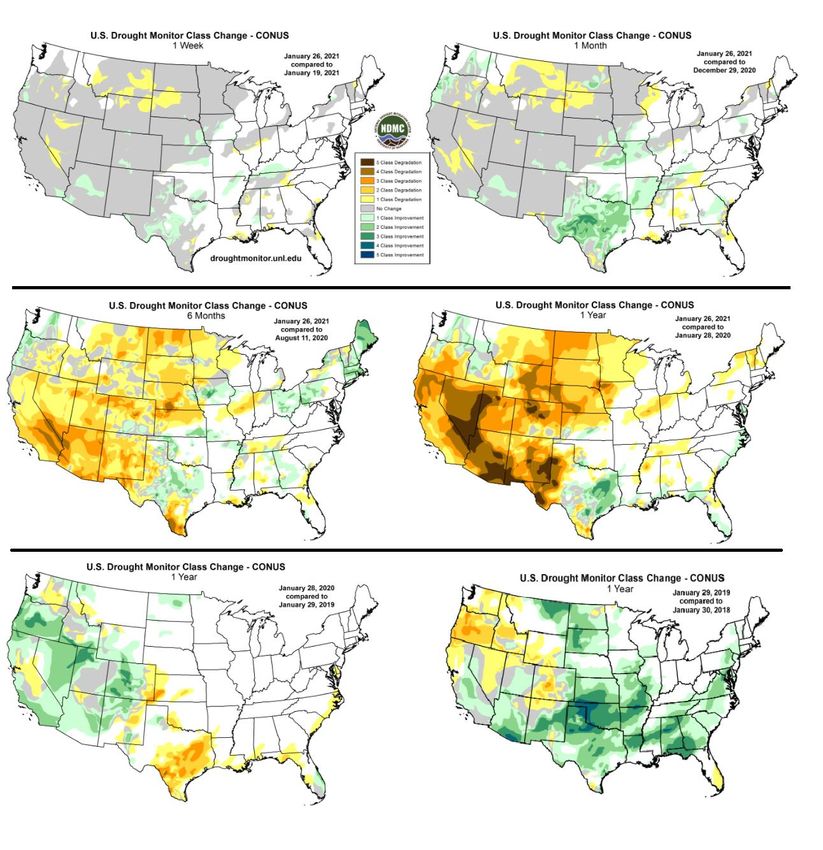
Table of Contents
Executive Summary .................................................................................................................................... 3
Analysis Findings and Recommendations .................................................................................................. 4
   Analysis Findings ...................................................................................................................................................4
   Recommendations ..................................................................................................................................................5
Introduction and Background ..................................................................................................................... 6
Risk Analysis .............................................................................................................................................. 8
   Weather ..................................................................................................................................................................8
   Fuel and Fire Danger Conditions .........................................................................................................................13
Summary ................................................................................................................................................... 21

                                                                                     2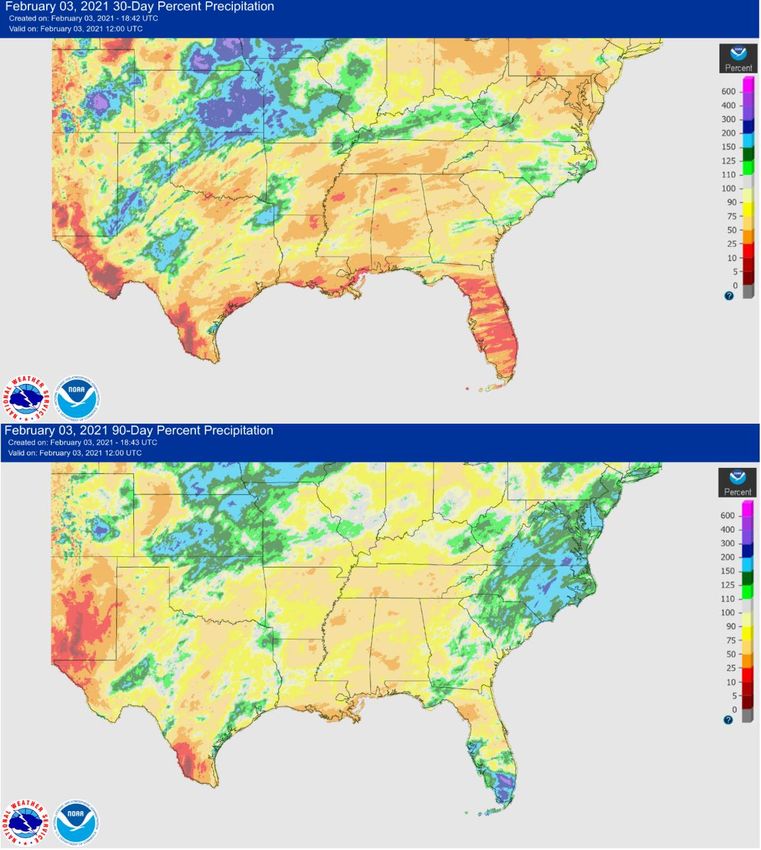
Executive Summary
In response to the combination of a normal wildland fire season, coupled with La Nina weather, a Fire
Risk Analysis was conducted to assess the potential and expected fire situation for the spring fire season
of 2021. The assessment period extends from mid-January through May. The analysis included a look at
the current weather situation and extended forecast, fuels compared to normal for the time of year,
National Fire Danger Rating System’s energy release component for each Southern Area Predictive
Service Area, and fire occurrence. Recommendations are provided based on the findings and
conclusions of the analysis.

The portion of the region in this analysis is entering their normal fire season. With the exception of the
western quarter of the Geographic Area, including Oklahoma, Arkansas, and Texas, the fire
environment has observed normal and average fire danger and fire weather over the past two years.

This rapid risk analysis was conducted to determine:

•   What is the probability of an above average spring fire season and what are the anticipated impacts?
•   Where are the critical locations in the Southern Area?
•   What are the key fire environment indicators and thresholds which demonstrate above normal fire
    potential?
•   Have drought conditions, observed over the past several years, improved?

Based on current fuel conditions and forecasted weather conditions, the most likely scenario is a normal
to below normal level of wildfire activity for the next month and beyond across the majority of the
Southern Area Geographic Area. The exception would be in the far western reaches of the area in both
western Oklahoma and Texas where drought conditions are established and trend worse in severity, and
in the longer term, Florida and the Coastal Plain of Mississippi and Alabama. Overall, normal firefighter
mobilization should occur within the Geographic Area. Minimal state to state and national mobilization
should occur. Overall, drought conditions observed over the past three years have significantly improved
and the spring fire season is setting up to be a good planned prescribed fire implementation season.

                                                     3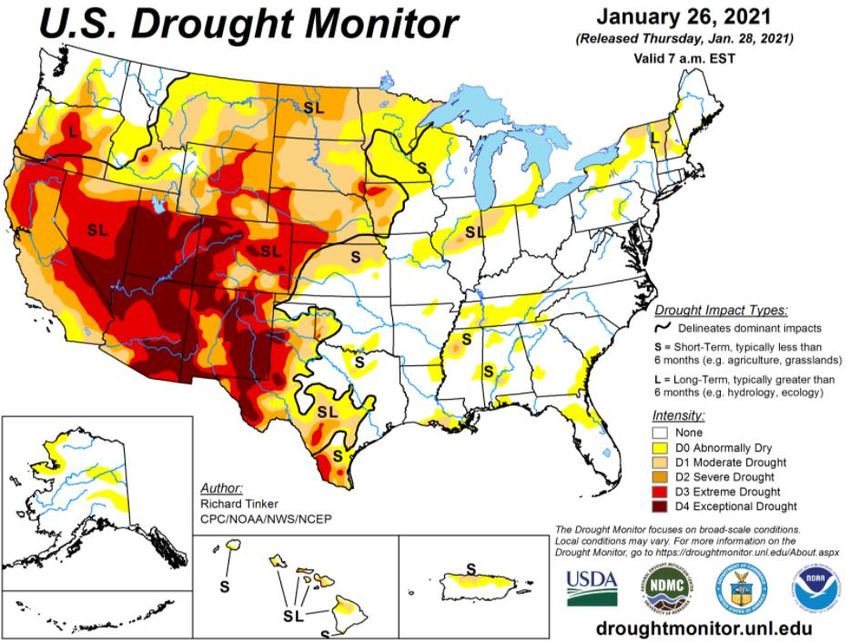
Analysis Findings and Recommendations
Analysis Findings
 The analysis findings indicate the following probabilities for the spring fire season for the analysis
area:
  Scenario Description for the 2021 Spring Fire Season                                          Southern
  (February through May)                                                                          Area
                                                                                               Probability
  Most Likely Case
  The Southern Area, overall, observes a normal to below normal spring wildfire
  season. A normal amount of initial attack activity is experienced for this time of the
  year; however, western portions of the Geographic area (including Oklahoma, Texas,
  Florida, and the Coastal Plain of Mississippi and Alabama) will see an uptick in                 75
  seasonal wildfire risk. Few Type III incidents occur at the same time in the
  geographic area. There will be the potential for the deployment of either Type 1 or
  Type 2 Incident Management Teams in Texas and Oklahoma.
  Best Case
  The observed wet trend continues and these systems bring frequent rainfall events and
  enough moisture to mitigate rainfall deficits and compact leaves after leaf drop. The
  normal spring time wildfire occurrence develops and very light to no initial attack is           15
  experienced. The availability of resources across the Geographic Area are sufficient
  to support normal wildfire and prescribed fire operations as well as supporting
  elevated wildfire risk in both Texas and Oklahoma.
  Worst Case
  The spring fire season rapidly escalates in severity extends deeper into spring than
  normal due to the unforeseen absence of forecast precipitation. A normal amount of
  initial attack activity is experienced for this time of the year; however, new ignitions
  would observe severe fire behavior and spread potential due to prolonged drought and
  minimal rainfall frequency (i.e., fires would get bigger faster). Some additional                10
  aviation and ground resources are required due to fire behavior. Several Type III
  incidents occur at the same time in the geographic area. However, no large scale
  mobilization of out of region resources are required due to at least some mitigating
  weather pattern (high humidity or periodic rainfall).
Table 1. Analysis findings for the Southern Area 2021 Spring Fire Season with Probability Rating

                                                         4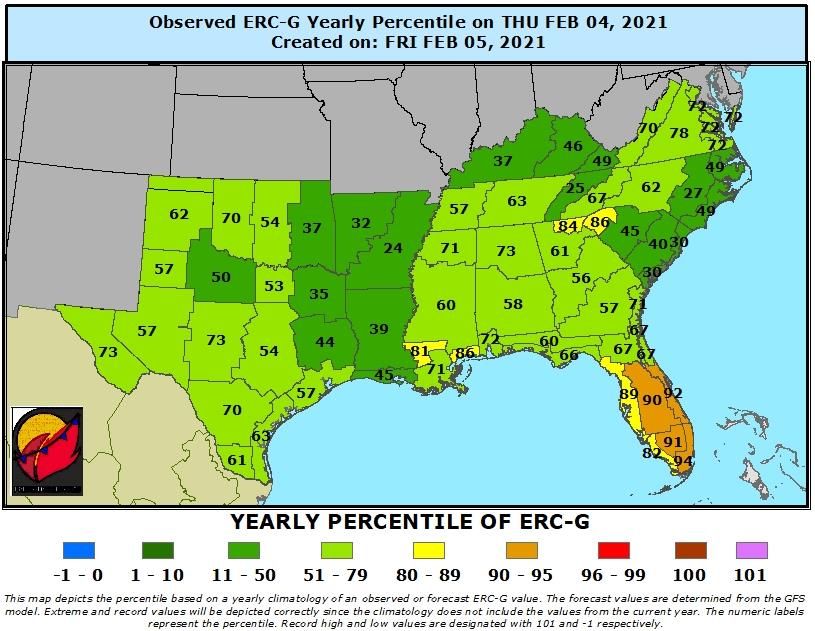
Recommendations

  •   The primary areas of concern as we transition into a spring wildfire season will be the far
      western reaches of the Geographic Area (Texas and Oklahoma).
         o In these areas fire managers must consider potential extreme fire behavior, which can be
           expected with the current drought conditions under moderate fire weather conditions. As
           fire danger indices exceed the 97th percentile, extreme fire behavior and rapid fire spread
           characteristics should be expected. Tactics should be altered to provide for firefighter
           and public safety. Appropriate management response may be point protection rather than
           direct attack.
         o Do not expect any fire in these western reaches to be routine. Be prepared to utilize
           indirect tactics with extended mop-up. Utilize aerial supervision to help direct crews and
           keep them informed on fire behavior. Ensure that LCES is in place before engaging on
           any fire. Remember to STOP, THINK, and TALK before you ACT… and actively look
           for ways to minimize risk to firefighters in what is forecast to be a period of very high
           fire danger.
         o Augmentation of initial attack resources will likely be required throughout the spring.
           This will result from increased fire behavior, fire spread, and longer mop-up times due to
           drought stressed fuels and soil.
         o Additional resources, both ground and aviation, may be needed.
  •   Florida and the Coastal Plain of Mississippi and Alabama started the season observing dry
      conditions, eventually received mitigating rain, and eventually should trend back to dry in the
      longer 2+ month outlook. Managers should continue to access these conditions and prepare for
      an uptick in wildfire risk in the coming months.
  •   Fire managers in those areas observing remnant drought condition should continue to assess
      these local conditions. These isolated areas have experienced fairly prolonged drought conditions
      that could observe increased fire spread and fire behavior as leaf drop occurs and in conjunction
      with wind events.
  •   Maintain capabilities to mobilize IMTs at the 1, 2, and 3 levels throughout the spring wildfire
      season.
  •   Ensure firefighter pocket cards are up-to-date and posted on the national website.
      http://fam.nwcg.gov/fam-web/pocketcards/
  •   Maintain national standardized predictive services products in a timely fashion. Produce new
      products as requested.

                                                   5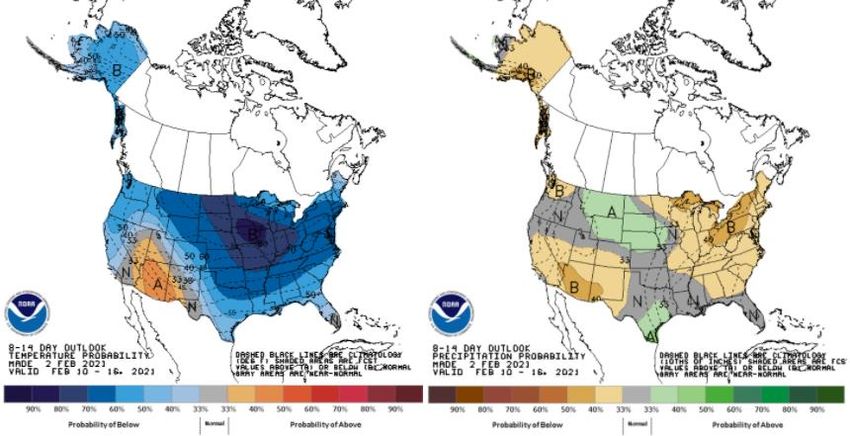
Introduction and Background
The majority of the Southern Area has observed normal to above normal precipitation over the past three
years. As evident in the U.S. Drought Monitor image below (Figure 1), areas of Extreme to Exceptional
Drought are limited to the far western reaches of the area along the Southern Area and Southwestern
Area Geographic Boundary. There are though several areas of Abnormally Dry and Moderate Drought
areas scattered across the central States of Tennessee, Louisiana, Mississippi, Alabama, Georgia, and
Florida.

Large portions of the Southern Area experienced Severe to Exceptional Drought starting in 2014 and
typically ending in the spring and
summer of 2017. During this period of
time, long duration drought conditions
have continued to improve thanks to
observed rainfall, especially in the past
year and a half, due to shifting weather
and several tropical systems.

The different levels of drought are
classified by percentiles, with
exceptional rating in the top 2-3% of the
historical record. It takes a several
seasons of dry weather to reach the
exceptional level and several seasons of
wet to reduce these drought conditions.
Figure 2 shows that drought conditions
have been subsiding in the central
portion of the Southern Region for the
past twelve months. The legend shows
direction of change over time and is
displayed as deteriorating (increasing drought) or improving (decreasing drought). Improving
(decreasing drought) conditions are indicated over most of the area since January of 2018. The
remaining areas on the west side of the
                                           Figure 1. The National Drought Monitor displays the size and severity of drought
region have seen generally improving       conditions across the United States. Source: National Drought Monitor website
(decreasing drought) conditions.

                                                       6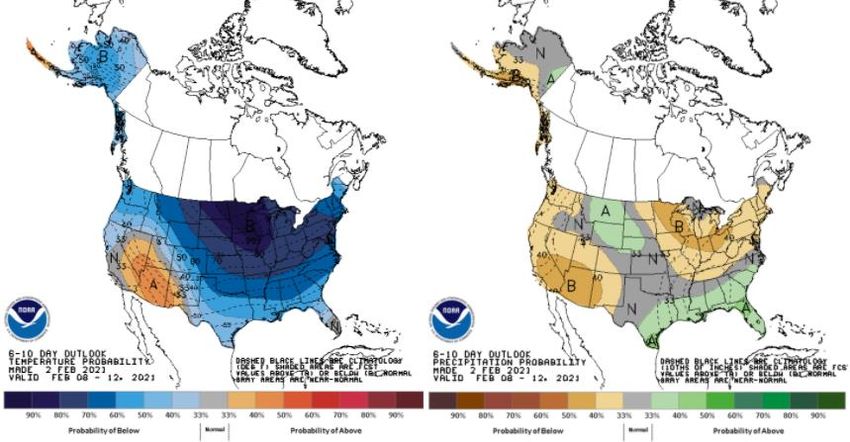
Figure 2. National Drought Monitor Class Change at 1 week, 1 month, 6 months, and 1 year. Source: National Drought
Monitor website

                                                           7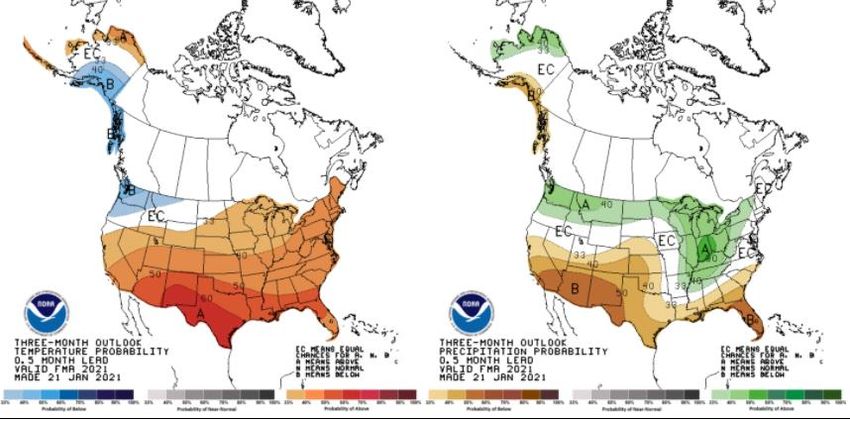
Figure 3 provides a general overview of Drought as percentiles
across the area. It is observed that the majority of the Geographic
Area has observed good drought response, with the exception of west
Texas.
Risk Analysis
Weather Figure 3. CPC Long Term Drought Indicator for the
United States for Jan 09, 2021. Source: WFAS.net
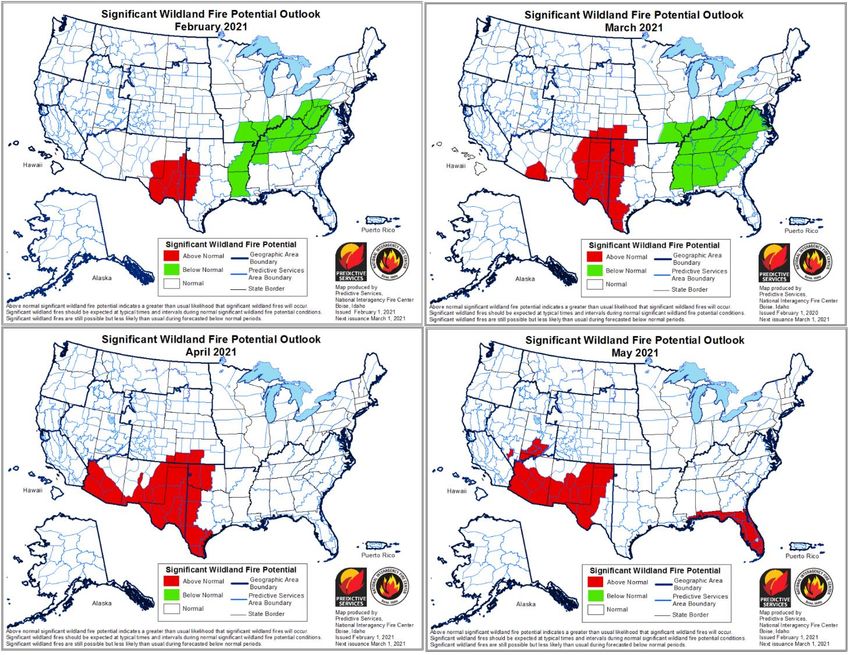
Weather and Climate Outlook for the next Four Months: February, March, April
Discussion of weather trends and fire potential outlook maps are posted on the SACC web site.
Outlook Summary: At least in the first half of the outlook period, the weather pattern still appears to
support a continuation of an unusual “wetter” biased La Nina pattern. As such, fire potential for a
broader area of the Southern Area should stay at below average to average levels with only limited and
short duration episodes of elevated initial attack. While west Texas and Oklahoma, areas generally
always subject to rapid fine fuel drying from combinations of low humidity’s and dryline windy
weather, the “wetter” condition this year will likely keep any extensive and wider spread critical
conditions from developing. This, however, based upon the outlook could be changing later February
and then into March. A much drier than average rain fall situation already entrenched across the Florida
peninsula (and spreading west along the southern Gulf coast) may be the forerunner to increasing fire
danger should the outlook for persisting below average rain fall and warmer than average temperatures
materialize before and through green-up.
Past Weather and Drought: The unusual high(er) frequency of rain producing storm systems remained
a fixture across the south from late last year and is keeping fuel moistures trending at high to very high
levels. Again, exceptions can be found in Texas/Oklahoma (short/long term D3/D4 drought in the Trans
Pecos and southern Panhandle) as well as emerging dryness in Florida. While significant drought is
missing from the south, there are minor areas of short term D0 drought scattered across the states. The
rain pattern and track with the weather systems, while lately more southerly based, varies by storm with
each event eventually, over time, producing overlapping and more complete coverage across the
Southern Area. This pattern is helping to keep fuel moistures, and especially the fine fuels, in a moist
and fire ignition limiting condition. One other condition which has not been very prevalent this year is
the lack of strong and gusty winds which has mitigated the potential for large fire.
Recent/Ongoing Fire Activity and Area Discussion (By exception): Fire activity remains minimal
and well below average with any periods of elevated initial attack being driven by short term and rapid
drying of fine fuels; mainly a phenomenon for Texas/Oklahoma.
8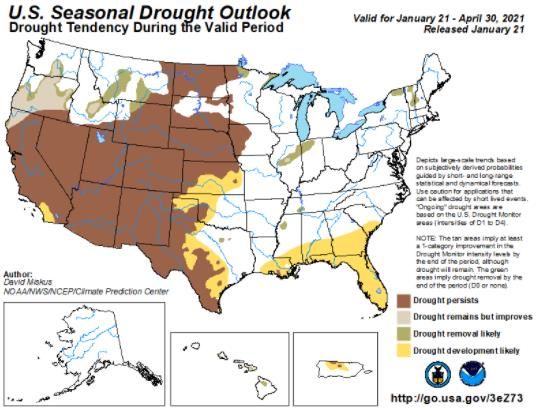
Fuel Conditions (by exception): Fuel moistures are currently very high (most near or better than 20%)
  with the only lower and/or marginal conditions (15% and below) occurring in the west and central-west
  Texas PSAs. Some drying in January has been occurring across our northeast states due to the more
  southerly track of storm systems. We expect the pattern will adjust, however, during February and will
  allow the 100 hour fuel moistures to once again increase above their current season low of 12 to 15
  percent. 1000 hour moistures continue to trend at very high, GTE 21 percent, levels.

  Outlook Discussion: In the near 1 to 2 month timeframe, a still fairly active storm tack and “wetter”
  pattern should continue to produce periodic rain events which, along with a persisting elevated humidity
  trend, should limit fine fuel drying and keep a rather moist fire environment in place for most areas of
  the south. The two main exceptions will be the desert areas of far western Texas (and to some extent
  west Oklahoma), and Florida which remain abnormally dry with a forecast which keeps these areas in a
  drier condition. While otherwise atypical “wetter” weather patterns associated with the current La Nina
  (right now more “Modoki-like” and an unusual variant) is likely to keep fire potential at bay, the pattern
  can become more variable as we move into spring and before green-up. As of now, and before May,
  mostly below average to average fire danger should be expected. Continued dry conditions for Florida
  would necessarily mean higher potential perhaps as early as April but primarily during May.

  PRECIPITATION AND TEMPERATURE OUTLOOK
  Both the 6 to 10 and 8 to 14 day precipitation probability maps from the Climate Prediction Center
  indicate a above normal temperatures and below normal to normal precipitation for the south, before

Figure 4. Map 1- Six to ten day outlook temperature probability, Map 2- Six to ten day outlook precipitation probability

  dryer conditions are projected to form over the Northeastern US and down into the eastern third of the
  Geographic Area.

                                                            9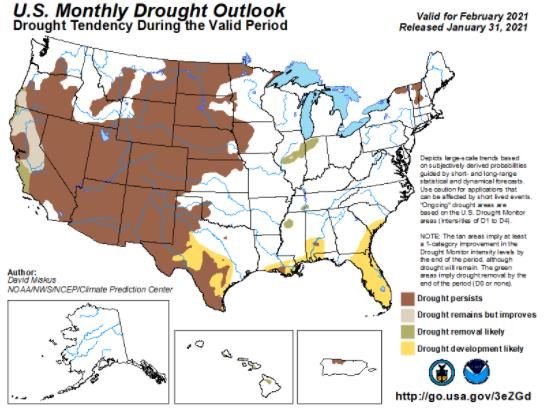
Figure 5. Map 1- 8 to 14 day outlook temperature probability, Map 2- 8 to 14 day outlook precipitation probability

The long-term three-month outlook projects above normal temperatures and below normal precipitation
across the southern half of the Geographic Area.

 Figure 6. Map 1- Three month outlook temperature probability, Map 2- Three month outlook precipitation
 probability

                                                         10
DROUGHT CONDITIONS
Over the past year and a half, overall, drought conditions have
improved across the Southern Area. Large fuel classes (100 hour
and 1000 hour) remain very moist and generally above critical
thresholds as we move through January and into February. These
fuel moistures should continue to trend as displayed on the map.
Maps of the most recent observed FM100 and FM1000 values
can be found on the Southern Area Coordination Center (SACC)
Predictive Services page
(http://gacc.nifc.gov/sacc/fire_weather.php). These maps are
typically updated daily and are generally available between 730
and 800 AM Eastern time. Additionally, maps of short-term
drought and the additional precipitation needed to bring the Figure 7. 100 Hour Fuel Moisture values for February
Palmer Drought Index (PDI) to -0.5 are also available. Each 1, 2021
image is hyperlinked to its original source to provide access to
the most recent depiction available.
February Drought Outlook
February will see persisting and developing drought
conditions in Texas and Oklahoma and developing
drought along the Coastal Plains of Louisiana,
Alabama, Florida, and South Carolina. Puerto Rico
continues to trend dry with periods of rain mitigating
drought severity.
Figure 7. Map of Monthly Drought Outlook for February
2021 for the United States
11March through April
Fire risks are expected to remain at seasonal levels as temperatures and precipitation hover near normal
levels. Southern Plains can be problematic, especially if there has been prolific grass growth in the
preceding months followed by dry. Short-term forecasts project above normal precipitation across the
entire geographic area over the
next two weeks. The isolated
pockets of drought currently
being experienced across the
southeastern reaches of the area
are forecast to continue
developing and broadening,
with those isolated dots
connecting into larger areas.
Figure 8. Map of Seasonal Drought
Outlook from January 21 through
April, 2021 for the United States
12Fuel and Fire Danger
Conditions
Figure 10 demonstrates the short-
term percent of normal
precipitation for the past 30-days.
Overall, the past 30-days have
observed below normal
precipitation with ranges of 90 to
50 percent of normal being
observed across the Geographic
Area. These areas are moderated by
Figure 10. And 11. Maps showing the
Advanced Hydrologic Precipitation
Analysis (AHPS), percent of normal
precipitation for the Southern Area.
fairly frequent precipitation events
and near normal precipitation over
the past 90 days (Figure 11), and
expected precipitation from over
the next two weeks.
Energy release component (ERC)
provides an index that is correlated
with flammability of fuel and
difficulty of suppression. ERC is
often referred to as an indicator of
fuel dryness. This index seems to
be most useful for characterizing
the seasonal severity of the fire
season across the Southern Area.
ERC for each Southern Area
Predictive Service Area (PSA) can be calculated based on weather measurements taken at Remote
Automatic Weather Stations (RAWS). The areas sampled by the assessment are noted in Figure 12.
Values above the 90th percentile are considered critical and represent fire danger that is only experienced
less than 10% of the time. Also, any ERC value that is close to the 97th percentile is closest to the record
high ERC value, signifying that those areas are at record high fire danger values for that time of the
year. The areas highlighted above the 80th percentile represent the most critical areas currently. Based
on these current conditions, as well as forecasted outlooks, it is expected that the region should remain
moderated.
The following hyperlinks display analysis products put out by the states of Texas and Oklahoma and
describe current conditions as well as local outlooks:
• http://ticc.tamu.edu/Documents/PredictiveServices/Outlooks/texas_fire_potential_update.pdf
• http://www.forestry.ok.gov/situation-reports
13SA
SA 28
SA
31B 30
SA SA23
17A
SA05
Figures 13-24 are samples of SA
ERC conditions across the 42
Southern Area Geographic Area.
The ERC graphs plot current SA
year values in relation to historic SA 48
SA SA
high values for comparison. 21B 44
09 SA
51
Figure 12. Map of energy release component percentiles in the Southern Area for
February 4, 2021. Predictive Service Areas (PSAs) used in the analysis below are
highlighted.
14Figure 13. ERC values for Predictive Service Area SA09, which covers the Trans-Pecos of far west Texas. 2021 values on the chart are
represented by the black hashed line. Both 2011 and 2016 were elevated years which trended at or above historic high records early
February and show potential tracks moving forward. It is observed that 2021 has trended below average however drought conditions
should be monitored as we move deeper into wildfire season.
Figure 14. ERC values for Predictive Service Area SA05, which covers a portion of northwest Texas. 2021 values on the chart are
represented by the black hashed line. Both 2011 and 2016 were elevated years which trended at or above historic high records for both
indices and has been overlaid for comparison purposes. It is observed that 2021 has trended below average however drought conditions
should be monitored as we move deeper into wildfire season.
15Figure 15. ERC values for Predictive Service Area SA17A, which covers eastern Oklahoma. 2021 values on the chart are
represented by the black hashed line. Both 2016 and 2019 were elevated years which trended at or above historic high records for
both indices held historic high trends during different periods of those spring fire seasons. It is observed that 2021 has trended
below average however drought conditions should be monitored as we move deeper into wildfire season.
Figure 16. ERC values for Predictive Service Area SA21B, which covers the coastal plain of Mississippi. 2021 values on the chart are
represented by the black hashed line. Both 2009 and 2011 were elevated years which trended at or above historic high records for both
indices and has been overlaid for comparison purposes. It is observed that 2021 has trended at or above average and longer-term drying
trends should be monitored over the next three months.
16Figure 17. ERC values for Predictive Service Area SA44, which covers the panhandle of Florida. 2021 values on the chart are
represented by the black hashed line. Both 2011 and 2018 were similar years which trended at or above historic high records for both
indices and has been overlaid for comparison purposes. 2021 closely resembles 2011 and this fire environment should be continually
monitored as we move into spring fire season.
Figure 18. ERC values for Predictive Service Area SA48, which covers south central Florida. 2021 values on the chart are represented by
the black hashed line. Both 2009 and 2017 were similar years which trended at or above historic high records for both indices and has been
overlaid for comparison purposes. Though 2021 at average ERC conditions, those levels are currently similar to 2017, which produced
historic high values through early May.
17Figure 19. ERC values for Predictive Service Area SA51, which covers south very southwest Florida. 2021 values on the chart are
represented by the black hashed line. Both 2009 and 2018 were similar years which trended at or above historic high records for both
indices and has been overlaid for comparison purposes. Though 2021 at average ERC conditions, those levels are currently similar to
both 2009 and 2018, which both trended well above average and at historic high through May.
Figure 20. ERC values for Predictive Service Area SA42, which covers southern Georgia. 2021 values on the chart are represented by the
black hashed line. Both 2011 and 2019 were similar years which trended at or average through the normal through March. 2011 is of
particular importance as this year mimics 2021, trends at average, and then breaks historic high levels from early May through June.
18Figure 21. ERC values for Predictive Service Area SA23, which covers northern Mississippi. 2021 values on the chart are represented by
the black hashed line. 2016 was an elevated year which fluctuated between average and historic high conditions and is overlaid in for
comparison purposes. It is observed that 2021 has trended at or above average through the winter with mitigating rainfall moderating
conditions.
Figure 22. ERC values for Predictive Service Area SA31B, which covers the mountains of Georgia. 2021 values on the chart are
represented by the black hashed line. The fall of 2016 ended up being a historic season, in terms of wildfire occurrence and growth, and
has been added just for that comparison context. Fairly request rainfall and some snow events have mitigated the overall wildfire risk in
this PSA.
19Figure 23. ERC values for Predictive Service Area SA28B, which covers the mountains of Virginia. 2021 values on the chart are
represented by the black hashed line. The fall of 2016 ended up being a historic season, in terms of wildfire occurrence and growth,
and has been added just for that comparison context. Fairly request rainfall and some snow events have mitigated the overall
wildfire risk in this PSA
Figure 24. ERC values for Predictive Service Area SA30, which covers the Coastal Plain of Virginia. 2021 values on the chart are
represented by the black hashed line. 2011 was a significant fire season in terms of occurrent and growth, with several long duration
complex fires. Forecast. ERC currently trends above average however, mitigating spring weather should keep ERCs from replicating
2011. Managers should definitely be aware of current conditions as they move into the spring fire season.
20Summary
• Western Texas and Oklahoma have significant drought conditions established with no fire
stalling or ending weather relief expected through their spring wildfire season.
• Northern Florida has observed some moderation thanks to recent precipitation. The southern half
of the state however has continued to trend higher in severity. Longer term 2–3-month outlooks
for temperature and precipitation both highlight warmer drying conditions throughout Florida
and extending west along the Coastal Plain of Alabama and Mississippi. These areas more than
likely will continue trending towards higher wildfire risk.
• Rainfall frequency has been normal to below normal across the remainder of the Geographic
Area over the past 3 months. There are isolated areas that are shown to be observing abnormally
dry conditions (U.S. Drought Monitor) and as we continue moving into the spring fire season
these areas should be continually assessed for fire danger.
o It is important to note that while the next 10 days are forecast to be wetter than normal,
the longer term 1–3-month outlook projects warm and dry weather to prevail. As we
continue to move into the spring fire season fire managers and personnel should continue
to assess current and forecast conditions and make decisions based on that analysis.
o The frequency of precipitation events is critical to staying out of an extended fire season.
These events need to take place on a five-to-seven-day cycle.
• Fire managers should continue to stay vigilant on fuel conditions coupled with daily fire weather
forecasts.
• An increased frequency of rain events coupled with more normal humidity levels will mitigate
the fuel dryness.
21You can also read