MR neurography of median nerve using diffusion tensor imaging (DTI) and its efficacy to diagnose carpal tunnel syndrome in Malaysian population ...
←
→
Page content transcription
If your browser does not render page correctly, please read the page content below
Neurology Asia 2018; 23(1) : 17 – 25

MR neurography of median nerve using diffusion tensor
imaging (DTI) and its efficacy to diagnose carpal tunnel
syndrome in Malaysian population
1
 Vikneswary Paniandi MBBchBAO, 1,2John George FRCR(UK)DMRD(Aberdeen), 3Khean Jin Goh
FRCP(Glasgow) MRCP (UK), 1Li Kuo Tan MEng(Biomedical Monash)

Biomedical Imaging Department, 2University of Malaya Research Imaging Centre, 3Department of
1

Medicine, Faculty of Medicine, University of Malaya, Kuala Lumpur, Malaysia.

Abstract

Objective: This study evaluates the feasibility of diffusion tensor imaging(DTI) in assessing median
nerve by measuring diffusion parameters such as fractional anisotropy (FA), mean diffusivity (MD),
axial diffusivity (AD) and radial diffusivity (RD) at different sites of median nerve and evaluating
their differences in patients with and without carpal tunnel syndrome (CTS) in local setting. Methods:
A prospective cross sectional study was performed with 9 female patients diagnosed with CTS by
clinical evaluation and nerve conduction study and 8 age and sex matched normal patients. Magnetic
resonance imaging (MRI) wrist was performed with pre-set axial PD and DTI protocol on a 3T
MRI, images post-processed using 3D SLICER software to generate median nerve tract and measure
diffusion parameters FA, MD, AD and RD in segments and focal points. Results: The FA values were
significantly lower in CTS patients, 0.454 (± 0.065), p< 0.002 and demonstrates negative correlation
with disease severity, r = - 0.510, p = 0.002.The mean MD, 1.090 (± 0.178) and mean RD, 0.834
(± 0.128) is higher in CTS patients, p = 0.041 and p = 0.014 respectively. They show an increasing
trend with increasing disease severity. Negative correlation was noted between the FA values and
age groups. FA cut of value of ≤ 0.487 with sensitivity 70.6 % and specificity 76.5%, is suggested
for diagnosing CTS.
Conclusion: MR neurography using DTI can be utilised to detect CTS. Patients with CTS demonstrate
lower FA and higher MD and RD values.

Keywords: Median nerve, carpal tunnel syndrome, MRI, diffusion

INTRODUCTION                                                              syndrome.8 A combination of positive symptoms,
                                                                          clinical tests and electro diagnostic tests are used
The median nerve arises from the brachial plexus
                                                                          as a mean of diagnosis.8
(C6–T1) and at the wrist, it passes under the
                                                                              MRI is not routinely used in the diagnosis
flexor retinaculum through the carpal tunneland
                                                                          of CTS as its sensitivity and specificity is low.
divides into digital and muscular branches
                                                                          Subjective signs such as nerve enlargement, nerve
distally.1Compression neuropathy of the median
                                                                          flattening, and increased nerve signal intensity are
nerve atthe carpal tunnel, results in decreased
                                                                          used for diagnosis.3Currently, a new subtype of
function of the nerve at this level giving rise to a
                                                                          diffusion weighted imaging in MRI which measure
constellation of symptoms and signs called carpal
                                                                          the molecular diffusion of water along different
tunnel syndrome (CTS).2
                                                                          directions in space, called diffusion tensor imaging
   CTS is not restricted by age, gender, ethnicity
                                                                          (DTI), is being used to study anisotropic tissues
or occupation. It occurs in 4% of the general
                                                                          which contain fibers that restrictthe diffusion of
population3,4, and approximately 7.5 to 22.5%
                                                                          water molecules along certain directions, such as
ofthe Malaysian population.5,6 Left untreated, it
                                                                          white matter tracts in the central nervous system9
can progress to muscle dysfunction, atrophy of
                                                                          and peripheral nerves such as sciatic, lumbar and
thenar muscles and irreversible damage to the
                                                                          median nerve.1,10
nerve.7 However, no gold standard is currently
                                                                              DTI enables measurements of quantifiable
available to accurately diagnose carpal tunnel
                                                                          values such as fractional anisotropy (FA), mean
Address correspondence to: Dr. Vikneswary Paniandi, Biomedical Imaging Department, University Malaya Medical Centre, Lembah Pantai, 59100 Kuala
Lumpur, Malaysia. Tel: +6017-4390776, e-mail: viki_187@yahoo.co.uk

                                                                                                                                           17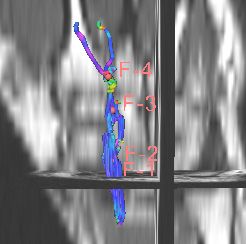
Neurology Asia                                                                                 March 2018

diffusivity (MD), axial diffusivity (AD) and radial    coil was used with subjects positioned prone
diffusivity (RD) to measure the integrity of the       and arms extended above the head (‘superman’
median nerve. Some studies show significant            position). The imaging protocol included axial
differences in the FA and MD of carpal tunnel          proton density weighted fast spoiled gradient echo
patients from the normal population.11,12 Some         (AX PD FSE) with parameters of TR = 2000ms,
studies also correlate DTI findings with nerve         TE = minimum (< 30)ms, FOV = 14mm, matrix
conduction studies to predict the nature of nerve      = 64 x 64, thickness = 3.0mm, number signals
damage that may have occurred.13 However, no           averaged = 2, and scan time of 4mins, 30s. The
standard values have been established to diagnose      DTI pulse sequence was done in axial plane with
CTS and its severity in a quantifiable manner          acquisition parameters of TR = 7650ms, TE =
inthe Malaysian population. The feasibility             10 m/sec) with        nerve tract using the fiducial locations as seed
normal median distal motor latency;Moderate:           points (Figure 2).
abnormal median sensory nerve conduction                  The parameters for fibre tractography were set
velocity and prolonged median distal motor             as following: Minimum path length : 10.0mm,
latency (more than 4.5 msec); Severe: absent           Maximum path length : 800.0mm, Stopping
median sensory responses.14]. Eight corresponding      FA value: 0.20, Stopping track curvature: 0.5,
age matched subjects were then recruited as            Integrating step length: 0.5mm, Fiducial seed
controls.                                              spacing: 2.0mm, Fiducial size: 2.5mm, Linear
   Bilateral hands were imaged in all subjects and     measure start threshold: 0.25
each hand was recorded as a separate sample. All          The fibre tract is then divided into 3 segments:
the CTS patients except one had bilateral hand         proximal (most proximal slice of the nerve tract
involvement. The normal hand was included as           until the level of lunate bone), within (level of
a sample in the control group making a total of        pisiform and scaphoid tubercle until the hook of
17 CTS and control hands respectively.                 hamate) and distal (above the hook of hamate
                                                       until the most distal slice of nerve tract) to carpal
Imaging                                                tunnel. The mean FA, MD, AD and RD were then
                                                       measured within the individual segments (Figure 3).
All MRI scans were performed on a clinical 3.0            These segments were then reduced to leave
Tesla MRI Systems (Signa® HDx GE Healthcare,           4 focal points (single slices) at the regions of
Milwaukee, Wisconsin, USA). A dedicated cardiac        lunate bone, pisiform and scaphoid tubercle,

18
(a) (b)
(c) (d)
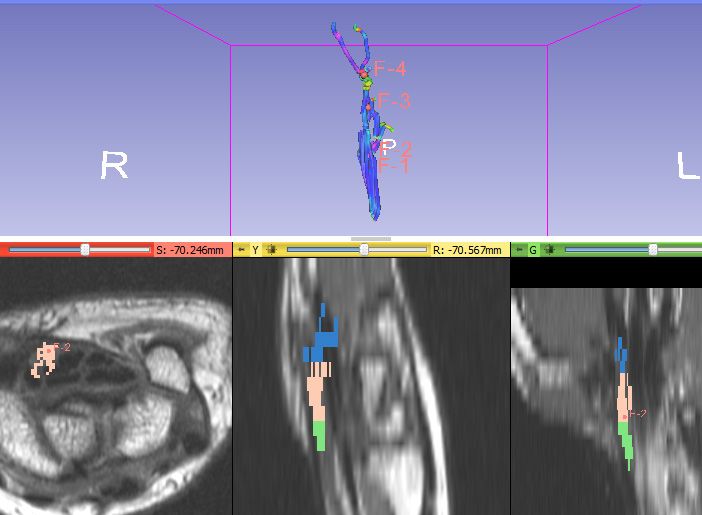
Figure 1. Fiducial points placed on the median nerve on axial PD slices overlaid on the axial DTI slices. The
fiducial points are placed at the region of lunate bone (a), pisiform and scaphoid tubercle (b), hook of
hamate (c), and distal to hook of hamate (d) to denote points proximal, entrance of carpal tunnel, exit
point of carpal tunnel and distal to carpal tunnel.
hook of hamate and distal to hook of hamate independent sample Mann Whitney-U test,
on the generated nerve tract (Figure 4). Focal and group comparisons for DTI parameter and
measurements of the mean FA, MD, AD and RD CTS severity (including control) were done
values were measured. using independent sample Kruskal-Wallis test.
Statistical analysis was performed using IBM Spearman’s Rho correlation coefficient was
SPSS (Statistical Package for the Social Sciences) utilized for assessment of correlations between
version 22.0. In view of small sample size non- 2 continuous data (DTI parameter and disease
parametric statistical tests were utilized. severity or age group).
Group comparisons for DTI parameter in CTS
versus control were done using non parametric
19Neurology Asia March 2018
Figure 3. Division of nerve tract into segments proximal,
within and distal to carpal tunnel.
Figure 2. Median nerve tract generated by 3D slicer
application
RESULTS in CTS using both segmental and focal point
measurements. The segmental measurements
Measurements with FA demonstrated stronger statistical significance
compared to focal points, with all segmental
Among all DTI measurements, the FA
values being significantly lower in CTS patients.
measurements demonstrated the most significant
Among the three different segments, the segment
differences between carpal and non-carpal
within tunnel demonstrates the lowest median
tunnel subjects. FA values were generally lower
FA value of 0.450 (± 0.068), p= 0.009 in CTS
(a) (b)
(c) (d)
Figure 4. Focal points at region of (a) lunate bone, (b) pisiform and scaphoid tubercle, (c) hook of hamate and
(d) distal to hook of hamate on the generated nerve tract to represent the region of proximal to carpal
tunnel, entrance of carpal tunnel, exit point of carpal tunnel and distal to carpal tunnel.
20Figure 5. Boxplot of mean FA of all segments in carpal Figure 6. Boxplot of FA values at different segments
and non-CTS patients. and different severity of CTS
Figure 7. Box plot showing correlation between FA of Figure 8. Box plot demonstrating correlation between
focal point at tunnel entrance and age group. FA mean of segments and age group.
patients. However the mean of all segments with disease severity classification, MD shows a
demonstrates the strongest significant difference weak positive correlation, r = 0.318, p= 0.07 but
p= 0.002, with median FA of 0.454 (± 0.065) in RD demonstrated good positive correlation, r =
CTS patients. Comparing with disease severity, 0.412, p = 0.026. Both the segmental and focal
the mean of all segments shows the strongest point AD values, as well as focal point values of
negative correlation, r = - 0.510, p = 0.002 and MD and RD showed mixed pattern in comparing
intergroup difference, p= 0.026. the CTS and non CTS group and none of the
Utilizing focal points, mixed pattern noted, measurements reached statistical significance.
only the point above hook of hamate demonstrated
statistical significance, p = 0.041 showing lower FA and age group
FA in subjects with CTS. No significant correlation
Control subjects were divided into three age
were noted with disease severity.
groups, 41-50, 51-60 and 61-70 years and their
DTI parameters compared. There is a generally
Measurements with MD, RD and AD
negative relationship between the FA values and
The segmental MD and RD values were noted age groups in all the measured segments and points.
to be higher in CTS than control group. Mean of The FA value of focal point at entrance showed
segment value demonstrated strongest statistical the strongest statistical significance, r = - 0.745,
significance in both MD and RD. Correlating p = 0.001. The mean FA of segments however
21Neurology Asia March 2018
(a) (b)
(c) (d)
Figure 9. ROC curve for Mean of all segments a) Mean of FA segments, b) mean of MD segments, c) mean of
AD segments, d) mean of RD segments
did not demonstrate significant correlation with characteristics of nerve fibers, for example
age. The MD, AD and RD measurements did not nerve demyelination, axonal damage and nerve
demonstrate statistical significance. integrity.15
High FA indicates good nerve integrity, while
ROC curve analysis high MD/ ADC reflects presence of axonal damage
and nerve demyelination. In order to hypothesize
Mean of segments were noted to demonstrate the
on the type of nerve damage that may be occurring,
most consistent results and were utilized for ROC
AD and RD values are measured whereby AD
curve analysis. FA measurement was the best
which measures parallel diffusivity reflects axonal
predictor with AUC : 803 (95% CI, 0.658 – 0.948),
integrity while RD which measures perpendicular
and a cut of value of ≤ 0.487 with sensitivity
diffusivity reflects integrity of the myelin.16,17
70.6 % and specificity 76.5% . Mean segments
Most studies of median nerve DTI have
of RD and MD were less useful with AUC of
generated median nerve tractography and made
0.744 and 0.706 respectively. AD demonstrated
measurements of the DTI parameters by measuring
poor accuracy with AUC of 0.606. The ROC
the value at a particular reference ROI in the
curve values are summarized in the table below.
generated tract or calculating whole tract values
using specific software.
DISCUSSION
We have proposed, to the best of our knowledge,
DTI parameters measure diffusivity of water a novel method of measuring FA value for median
molecules along the nerve fiber. It has been nerve by segmenting the nerve into proximal,
established from white matter DTI studies within tunnel and distal to tunnel, to assess the
that these parameters could reflect structural location of maximal nerve damage instead of at
22Table 1: FA values segments distal, within and proximal to carpal tunnel as well as mean of all
segments with significance testing in groups with and without carpal tunnel, correlation to
classification of disease severity and intergroup of disease severity significance testing
FA Median FA Median FA MW-U KW test, p Sp CC, r Sp Sig, p
SM In CTS Without CTS test sig
DS 0.486 (± 0.099) 0.533 (± 0.099) p = 0.041 p = 0.240 r = -0.329 p = 0.057
WT 0.450 (± 0.068) 0.495 (± 0.069) p = 0.009 p = 0.052 r = -0.365 p = 0.034
PT 0.456 (± 0.093) 0.519 (± 0.105) p = 0.034 p = 0.148 r = -0.402 p = 0.019
MS 0.454 (± 0.065) 0.515 (± 0.067) p = 0.002 p = 0.026 r = -0.510 p = 0.002
FA SM, FA values of segments measured; MW – U test sig, Mann Whitney-U test significance; KW test, Kruskal-Wallis
test; Sp CC - Spearmans rank correlation coefficient; Sp Sig - Spearmans rank significance; DS, distal segment; WT,
within tunnel; PT, proximal to tunnel; MS, mean of all segments
focal point. Specific bony landmarks as described with a decrease in FA with increasing severity
in methodology had been used for this purpose. of disease.20 This somewhat corroborates with
It was noted from our study that this segmental the studies of Naraghi et al.21, Ohana et al.22 and
measurements were more reliable in identifying Kwon et al.23 which demonstrate focal point at
CTS than focal point measurements. pisiform level to be the most sensitive compared
The median FA values of the segments in our to other locations.
study were significantly lower in CTS patients and However, the mean of all segments shows the
show negative correlation with severity of disease most consistent significant difference in CTS. It
in all the segments. This corroborates with other also demonstrated significant difference between
studies such as Barcelo et al.18, Brienza et al.11, different groups of severities of CTS disease
Tasdelen et al.19, and Guggenberger et al.10 (Kruskal Wallis test, p < 0.026) which is not
Among the three segments, segment within demonstrated with measurements from segment
the tunnel demonstrated the strongest significant within tunnel. Therefore our study demonstrates
decrease in FA in CTS. This signifies that the whole nerve measurements to be more reliable
median nerve becomes more isotropic in CTS, than any particular segment. This is noted by
maximally at the region within the tunnel. Tasdelen et al.19 in his study where his whole
It is hypothesized that in CTS the maximal nerve measurements showed significant difference
compression occurs at the level of carpal tunnel between groups of disease severity than focal
causing intraneural microcirculation disruption, points.
which results in nerve edema, increasing The increase in extracellular fluid at the region
extracellular fluid. This increases isotropic water affected by compression neuropathy also causes
diffusivity at this region and therefore correlates an increase in MD values as is seen in the studies
Table 2: DTI values of MD, AD and RD using mean of all segments with significance testing in groups
with and without carpal tunnel, correlation to classification of disease severity and intergroup
of disease severity significance testing
DTI of Median Median FA MW-U KW test, p Sp CC, r Sp Sig, p
MS In CTS Without CTS test sig
MD 1.090 (± 0.178) 0.957 (± 0.266) p = 0.041 p = 0.223 r = 0.318 p = 0.07
RD 0.834 (± 0.128) 0.741 (± 0.151) p = 0.014 p = 0.075 r = 0.412 p = 0.026
AD 1.701 (± 0.165) 1.645 (± 0.245) p = 0.306 p = 0.712 r = -0.147 p = 0.407
MS, mean of segments; CTS, carpal tunnel syndrome; FA values of segments measured; MW – U test sig, Mann
Whitney-U test significance; KW test, Kruskal-Wallis test; Sp CC - Spearmans rank correlation coefficient; Sp Sig -
Spearmans rank significance; MD, mean diffusivity; RD, radial diffusivity; AD, axial diffusivity
23Neurology Asia March 2018
Table 3: Cut off value of ROC curves of DTI values using mean of segments
DTI parameter Cut off value AUC ( 95% CI) Sensitivity Specificity
FA ≤ 0.487 0.803 0.658 – 0.948 0.706 0.765
MD ≥ 1.012 0.706 0.526 – 0.886 0.765 0.706
AD ≥ 1.650 0.606 0.411 – 0.800 0.647 0.53
RD ≥ 0.812 0.744 0.577 – 0.910 0.647 0.706
AUC, area under the curve; CI, confidence interval; FA values of segments measured; MD, mean diffusivity; AD, axial
diffusivity; RD, radial diffusivity
by Brienza et al.11 and Stein et al.12 with lower FA conduction parameters also did not show any
and increase in ADC in CTS patients. Barcelo et significant correlation in our study.
al.18 and Khalil et al.24 however obtained lower FA The small sample size limits accuracy and
with non-significant ADC values. This suggests reliability of our data. In addition, a cardiac coil
that in CTS, changes in FA probably occurs first was utilized for scanning due to the unavailability
before changes in ADC, therefore making FA a of a wrist coil at the time of study. This may have
more sensitive parameter to evaluate for CTS. lead to poor image quality, and might affect the
We had also obtained higher RD values in all the reliability of defining the nerve - requiring an axial
measured segments, with mean RD of segments PD image to be overlayed on DTI image to identify
showing most significant results. High RD is the nerve - a small degree of mismatch may exist in
believed to be caused by loss of myelin sheath this process. In addition, post processing in nerve
integrity in CNS nerves. This corroborates with tractography is an observer dependent process,
the pathology in CTS where nerve compression and assessment of inter-observer difference was
is believed to cause myelin sheath damage in not evaluated in this study.
the initial phases before progressing to axonal In conclusion, this study demonstrates that
damage. This is noted in studies by Stein et al.12 DTI is able to assess the median nerve and its
and Kwon et al.23 parameters such as FA, MD, AD and RD values
ROC curve analysis demonstrated highest at different locations. It also establishes the mean
area under the curve for FA followed by RD. whole nerve value as a more reliable method of
This suggests FA to be the best parameter to be measurement, and there is a significant reduction
used as a cut-off value as suggested by Kwon et of FA and increase in MD and RD in patients with
al.23 A cut-off value of 0.487 is proposed by our carpal tunnel syndrome. An FA cut off value of
study which shows a sensitivity of 70.6%andMalaya Medical Center, MREC ID NO: 20154- recurrent carpal tunnel syndrome - initial experience.
1243. Eur Radiol 2013;23(11):3115-23.
16. Budde MD, Kim JH, Liang HF, et al. Toward accurate
diagnosis of white matter pathology using diffusion
Conflict of interest: None tensor imaging. Mag Reson Med 2007;57(4):688-95.
17. Song SK, Sun SW, Ramsbottom MJ, Chang C, Russell
REFERENCES J, Cross AH. Dysmyelination revealed through MRI
as increased radial (but unchanged axial) diffusion
1. Kabakci N, Gürses B, Firat Z, et al. Diffusion
of water. NeuroImage 2002;17(3):1429-36.
tensor imaging and tractography of median nerve:
18. Barcelo C, Faruch M, Lapègue F, Bayol MA,
normative diffusion values. AJR Am J Roentgenol
Sans N. 3-T MRI with diffusion tensor imaging
2007;189(4):923-7.
and tractography of the median nerve. Eur Radiol
2. Fisher B, Gorsche R, Leake P. Diagnosis, causation
2013;23(11):3124-30.
and treatment of carpal tunnel syndrome: An evidence-
19. Tasdelen N, Gurses B, Kilickesmez O, et al. Diffusion
based assessment. A background paper prepared for
tensor imaging in carpal tunnel syndrome. Diagn
Medical ServicesWorkers’ Compensation Board.
Interv Radiol 2012;18(1):60-6.
WCB Alberta May 2004.
20. Aboonq MS. Pathophysiology of carpal tunnel
3. Andreisek G CD, Burg D, Marineek B, Weishaupt
syndrome. Neurosciences 2015;20(1):4.
D. Peripheral neuropathies of the median, radial and
21. Naraghi A, da Gama Lobo L, Menezes R, et al.
ulnar nerves: MR imaging features. Radiographics
Diffusion tensor imaging of the median nerve before
2006;26:1267-87
and after carpal tunnel release in patients with carpal
4. Atroshi I, Gummesson C, Johnsson R, Ornstein
tunnel syndrome: feasibility study. Skeletal Radiol
E, Ranstam J, Rosén I. Prevalence of carpal
2013;42(10):1403-12.
tunnel syndrome in a general population. JAMA
22. Ohana M, Moser T, Meyer N, Zorn PE, Liverneaux
1999;282(2):153-8.
P, Dietemann JL. 3T tractography of the median
5. Ithnin A, Dinnee K, Venkataraman S. Occupational
nerve: optimisation of acquisition parameters and
risk factors for carpal tunnel syndrome among nurses
normative diffusion values. Diagn Interv Imaging
in medical. Int J Public Health Res 2012;2(2):137-43.
2012;93(10):775-84.
6. Munirah M, Normastura A, Azizah Y, Aziah D.
23. Kwon BC, Koh SH, Hwang SY. Optimal parameters
Prevalence of probable carpal tunnel syndrome and
and location for diffusion-tensor imaging in the
its associated factors among dentists in Kelantan.
diagnosis of carpal tunnel syndrome: a prospective
International Journal of Collaborative Research on
matched case-control study. AJR Am J Roentgenol
Internal Medicine & Public Health 2014;6(8):247-59.
2015;204(6):1248-54.
7. Cantatore F, Dell’Accio F, Lapadula G. Carpal tunnel
24. Khalil C, Hancart C, Le Thuc V, Chantelot C,
syndrome: a review. Clin Rheumatol 1997;16(6):596-
Chechin D, Cotten A. Diffusion tensor imaging
603.
and tractography of the median nerve in carpal
8. Surgeons AAoO. Clinical practice guideline on the
tunnel syndrome: preliminary results. Eur Radiol
diagnosis of carpal tunnel syndrome. In: AAOS,
2008;18(10):2283-91.
editor. 2007.
9. Stieltjes B, Kaufmann WE, van Zijl PC, et al.
Diffusion tensor imaging and axonal tracking in the
human brainstem. NeuroImage 2001;14(3):723-35.
10. Guggenberger R, Markovic D, Eppenberger P,
et al. Assessment of median nerve with MR
neurography by using diffusion-tensor imaging:
normative and pathologic diffusion values. Radiology
2012;265(1):194-203.
11. Brienza M, Pujia F, Colaiacomo MC, et al. 3T
diffusion tensor imaging and electroneurography
of peripheral nerve: a morphofunctional analysis
in carpal tunnel syndrome. J Neuroradiology
2014;41(2):124-30.
12. Stein D, Neufeld A, Pasternak O, et al. Diffusion
tensor imaging of the median nerve in healthy and
carpal tunnel syndrome subjects. J Magn Reson
Imaging 2009;29(3):657-62.
13. Heckel A, Weiler M, Xia A, et al. Peripheral
nerve diffusion tensor imaging: Assessment
of axon and myelin sheath integrity. PloS one
2015;10(6):e0130833.
14. Stevens JC. AAEM minimonograph# 26: the
electrodiagnosis of carpal tunnel syndrome. Muscle
Nerve 1997;20(12):1477-86.
15. Lindberg PG, Feydy A, Le Viet D, Maier MA, Drape
JL. Diffusion tensor imaging of the median nerve in
25You can also read