Functional photoacoustic imaging to observe regional brain activation induced by cocaine hydrochloride
←
→
Page content transcription
If your browser does not render page correctly, please read the page content below
Functional photoacoustic imaging to
                 observe regional brain activation induced
                 by cocaine hydrochloride

                 Janggun Jo
                 Xinmai Yang

Downloaded From: https://www.spiedigitallibrary.org/journals/Journal-of-Biomedical-Optics on 31 May 2021
Terms of Use: https://www.spiedigitallibrary.org/terms-of-use
JBO Letters

                Functional photoacoustic                                                           (PAM) system is applied to detect the regional changes in the
                                                                                                   brain function induced by the injection of cocaine hydrochloride
                imaging to observe regional                                                        in small animals. With the PAM system, the brain images are
                                                                                                   shown at coronal views, and the regional changes in the total
                brain activation induced by                                                        hemoglobin (HbT) concentration are presented. Additionally,
                                                                                                   the regional changes in blood oxygenation are also imaged.
                cocaine hydrochloride
                                                                                                   2 Materials and Methods
                                                                                                   For PAM imaging,9 a tunable OPO laser (Surelite OPO
                Janggun Jo and Xinmai Yang                                                         PLUS; Continuum, Clara, California), pumped by a Q-switched
                The University of Kansas, KU Bioengineering Research Center,
                Department of Mechanical Engineering, 5109 Learned Hall, 1530                      Nd:yttrium–aluminum–garnet laser (Surelite III; Continuum,
                West 15th Street, Lawrence, Kansas 66045                                           Santa Clara, California) was used to generate laser light. Dur-
                                                                                                   ing the conduction of PAM, we used 680 and 797 nm optical
                Abstract. Photoacoustic microscopy (PAM) was used to de-                           wavelength light. At 797 nm wavelength, the absorptions of oxy-
                tect small animal brain activation in response to drug abuse.                      hemoglobin (HbO2 ) and deoxy hemoglobin (Hb) are the same,10
                Cocaine hydrochloride in saline solution was injected into                         and at 680 nm wavelength, the output power of the OPO laser
                the blood stream of Sprague Dawley rats through tail veins.                        research maximum. These two wavelengths were chosen for cal-
                The rat brain functional change in response to the injection                       culating the changes in blood oxygenation. The incident energy
                of drug was then monitored by the PAM technique. Images
                                                                                                   density of the laser that reached the surface of the rat head was
                in the coronal view of the rat brain at the locations of 1.2 and
                3.4 mm posterior to bregma were obtained. The resulted                             less than 20 mJ/cm2 , which complied with the safety limit for
                photoacoustic (PA) images showed the regional changes                              human skin exposure.11 During data collection, a laser beam
                in the blood volume. Additionally, the regional changes in                         was scanned across the surface, and subsequently generated PA
                blood oxygenation were also presented. The results demon-                          signals were detected by a 5-MHz focused ultrasonic transducer
                strated that PA imaging is capable of monitoring regional                          (SU-108-013, Sonic Concepts), which has a focal length of
                hemodynamic changes induced by drug abuse. C 2011 Society                         35 mm and diameter of 33 mm. The detected signals were am-
                of Photo-Optical Instrumentation Engineers (SPIE). [DOI: 10.1117/1.3626576]        plified by a preamplifier (5072PR; Olympus-NDT, Waltham,
                Keywords: photoacoustic microscopy; imaging, brain; rat, drug abuse;               Massachusetts), and collected through a multiple-channel data
                cocaine.                                                                           acquisition board (CS21G8-256MS; Gage, Lockport, Illinois)
                Paper 11148LRRR received Mar. 23, 2011; revised manuscript received                that used 8 bit resolution and 500 MS/s of sampling rate, and
                Jul. 27, 2011; accepted for publication Aug. 1, 2011; published online             then downloaded to a personal computer for post-analysis. Pho-
                Sep. 13, 2011.                                                                     toacoustic images were reconstructed by using the envelope of
                                                                                                   each scan line from each scan position of the transducer. Es-
                1 Introduction                                                                     sentially, the envelope of each signal at each scan position was
                The abuse of cocaine can cause insanity, strokes, seizures, and                    projected in the depth direction. The distance along the depth
                tremors.1–3 Imaging technologies have enabled the investiga-                       direction was calculated by multiplying the time of flight by the
                tion of the pharmacological effects of chronic drug usage of co-                   speed of sound in soft tissue.
                caine on the brain noninvasively. Small animals have been used                         Sprague Dawley rats (140 to 220 g body weight) were used
                as experimental models to understand the effects of acute and                      for brain imaging. A total of eight animals were used in the ex-
                chronic drug administration on regional brain function, neuroad-                   periments and the images presented here were from one of the
                aptations, and pharmacological interventions. Medical imaging                      animals. For the imaging procedure, the animals were initially
                methods, such as functional magnetic resonance imaging (MRI)                       anesthetized with a mixture of ketamine (87 mg/kg body weight)
                and positron emission tomography (PET), have been used to                          and xylazine (13 mg/kg body weight), and subsequent anesthesia
                globally map the effects of pharmacological actions on the cen-                    was maintained with the inhalation of 1.0% to 2.0% isoflurane
                tral nervous system in small animals.4, 5 However, these tech-                     mixed with pure oxygen. After shaving the rat head with an elec-
                niques are associated with either high cost or using ionizing                      tric shaver, the anesthetized rat was fixed on a custom-designed
                radiations.                                                                        surgical stereotaxic frame, and the head surface was coated with
                    Photoacoustic tomography (PAT) has been suggested as an                        ultrasonic gel, and placed under the acoustic coupling membrane
                imaging tool to detect the functional changes in the brain of small                in a water tank. The body temperature was maintained using a
                animal models for drug abuse/addiction.6 The administration of                     heating lamp and the heartbeat remained about 250 ± 10/min.
                cocaine hydrochloride causes a dose-dependent neuronal activa-                     For PAM images, the rat was injected cocaine hydrochloride
                tion with changes in brain metabolic rate. The changes in cere-                    (Sigma-Aldrich, St. Louis, Missouri) in 0.9% sterile saline at
                bral blood volume, which are affected by the level of dopamine                     the given dose of 5.0 mg/kg body weight. This dosage of co-
                and can be either increased or decreased,7, 8 can be detected                      caine hydrochloride was chosen because it can produce strong
                by PA detection. Previously, we showed the overall changes in                      hemodynamic effects. About 2 h after administering the initial
                blood volume on the brain cortex surface due to drug abuse                         anesthesia, the cocaine hydrochloride in sterile saline solution
                with a PAT system. In this paper, a photoacoustic microscopy                       was injected through the rat tail veins. During the experiment,
                                                                                                   the heart rate and blood oxygenation were monitored with a
                Address all correspondence to: Xinmai Yang, University of Kansas, Department
                                                                                                   pulse-oximeter (Nonin medical, PulseSense VET, Plymouth,
                of Mechanical Engineering, 1530 West 15th Street, Lawrence, Kansas 66045;
                                                                                                   1083-3668/2011/16(9)/090506/3/$25.00
                                                                                                                                        C 2011 SPIE
                Tel: 785-864-1753; Fax: 785-864-1742; E-mail: xmyang@ku.edu.

                Journal of Biomedical Optics                                              090506-1                                         September 2011 r Vol. 16(9)

Downloaded From: https://www.spiedigitallibrary.org/journals/Journal-of-Biomedical-Optics on 31 May 2021
Terms of Use: https://www.spiedigitallibrary.org/terms-of-use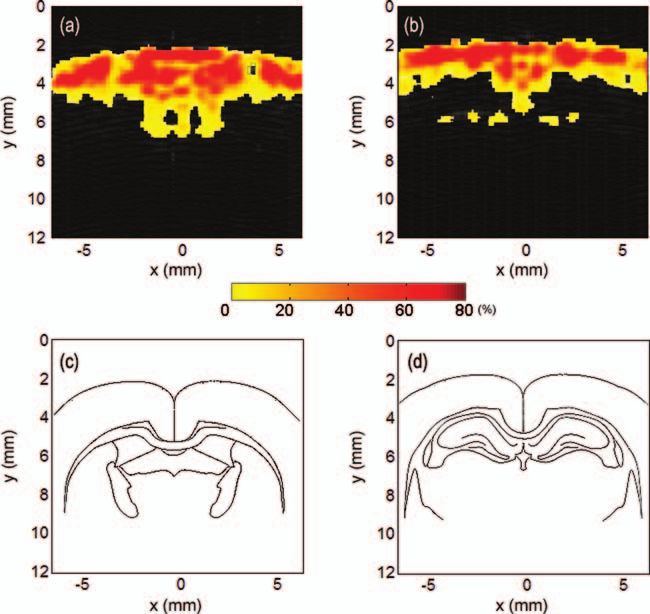
JBO Letters

                                                                                                   680 nm wavelength, the absorption of deoxy-hemoglobin is
                                                                                                   much higher than that of oxy-hemoglobin. As a result, IF is
                                                                                                   inversely proportional to changes in sO2 and independent of
                                                                                                   blood volume changes.12 Therefore, the functional change (IF )
                                                                                                   reflects the level of sO2 change. Before calculating IF , statis-
                                                                                                   tic analysis between images obtained at the same wavelength
                                                                                                   was performed. For the statistical significance, data (p-value of
                                                                                                   >0.05) were filtered to reduce noise. With the method, PA imag-
                 Fig. 1 PA B-scan image of a rat’s brain at 3.2 mm posterior to bregma.
                                                                                                   ing data from 680 and 797 nm were used to map sO2 changes
                 Minnesota). An initial PA image before the injection of cocaine                   by pixel-wise normalization of images.12 IF is able to signify
                 hydrochloride solution was obtained to serve as the reference                     region of interest for sO2 changes at two positions, 1.2 mm
                 image. Then the drug was injected and PAM was employed                            posterior to bregma and 3.4 mm posterior to bregma.
                 to monitor the brain activation continuously. From the initial                        Furthermore, PA imaging data were acquired to investigate
                 image, we could identify the coronal suture and confirm the                       the spatiotemporal distribution of relative HbT concentration
                 position of bregma with ± 0.2 mm error. All animal handling                       changes due to the pharmadynamic effects of cocaine hydrochlo-
                 procedures are approved by the Institutional Animal Care and                      ride. At 797 nm, the reference signals and the subsequent sig-
                 Use Committee of the University of Kansas.                                        nals 30 min after the cocaine injection were collected with
                     After the injection of cocaine hydrochloride, the rat brain                   noise-filtering and 0.8 mm spatial smoothing. Changes in HbT
                 was scanned with 680 and 797 nm wavelengths. Reference im-                        were calculated by 1 + HbT/HbT. On the B-scan image which
                 ages at 797 nm for a before-injection and an after-injection were                 showed the anatomical distribution of the HbT changes, posi-
                 acquired and compared with respective images at 680 nm for                        tive HbT responses were used to indicate HbT increases between
                 the same region. The respective images at 680 nm were ob-                         before and after cocaine injection.
                 tained about 1 min after the reference images at 797 nm. We
                 assumed the changes in brain activation were small during this                    3 Results and Discussion
                 1 min because cocaine-induced brain activation is a relatively                    PA B-scan images on coronal view of rat brain at two positions of
                 slow process. To sense the changes in blood oxygenation (sO2 ),                   1.2 and 3.4 mm posterior to bregma were monitored throughout
                 functional changes (IF ) were calculated with the following                      the experiment for imaging cortical functional changes. Figure 1
                 equation:12                                                                       shows an example of the coronal view of a rat brain when 680
                               I(680 nm) after injection     I(680 nm) before injection            nm light wavelength was used.
                      IF =                              −                                            The functional images (IF ) show the changes of HbO2 and
                               I(797 nm) after injection     I(797 nm) before injection     (1)
                                                                                                   Hb on cerebral cortex (Fig. 2). The PA functional signals de-
                            = I F after injection − I F before injection ,
                                                                                                   tected every 10 min after the injection of cocaine hydrochloride
                 where I denotes the amplitude of PA signals, and IF denotes the                   are shown. Because IF is the ratio of PA imaging signals at
                 ratio of PA signals at 680 and 797 nm. At 797 nm wavelength,                      680 nm to PA imaging signals at 797 nm, and at 680 nm, the
                 which is an isospectral point for blood, the photoacoustic sig-                   optical absorption of Hb is dominant, a lower value of IF means
                 nal is proportional to the changes in HbT concentration.13 At                     a lower concentration of Hb. Furthermore, a negative value in

                 Fig. 2 Functional images (IF ) at 1.2 mm posterior to bregma, and 3.4 mm posterior to bregma. sO2 changes are observed at 10, 20, and 30 min.
                 The negative values in IF indicated the increases in sO2 levels, and vice versa.

                 Journal of Biomedical Optics                                                090506-2                                   September 2011 r Vol. 16(9)

Downloaded From: https://www.spiedigitallibrary.org/journals/Journal-of-Biomedical-Optics on 31 May 2021
Terms of Use: https://www.spiedigitallibrary.org/terms-of-use
JBO Letters
brain in vivo. The regional change in HbT, which can be de-
tected by PA imaging system effectively, was observed from the
result of injecting cocaine hydrochloride. PA imaging on coronal
view also shows the changes in the distribution of oxygenated
hemoglobin in the rat brain. The results demonstrate that PA
imaging can be used to monitor regional hemodynamic changes
induced by drug abuse.
Acknowledgments
This work was supported by NIH Grant No. 1R03DA026987.
References
1. J. C. Anthony and K. R. Petronis, “Early-onset drug-use and risk of
later drug problems,” Drug Alcohol Depend. 40(1), 9–15 (1995).
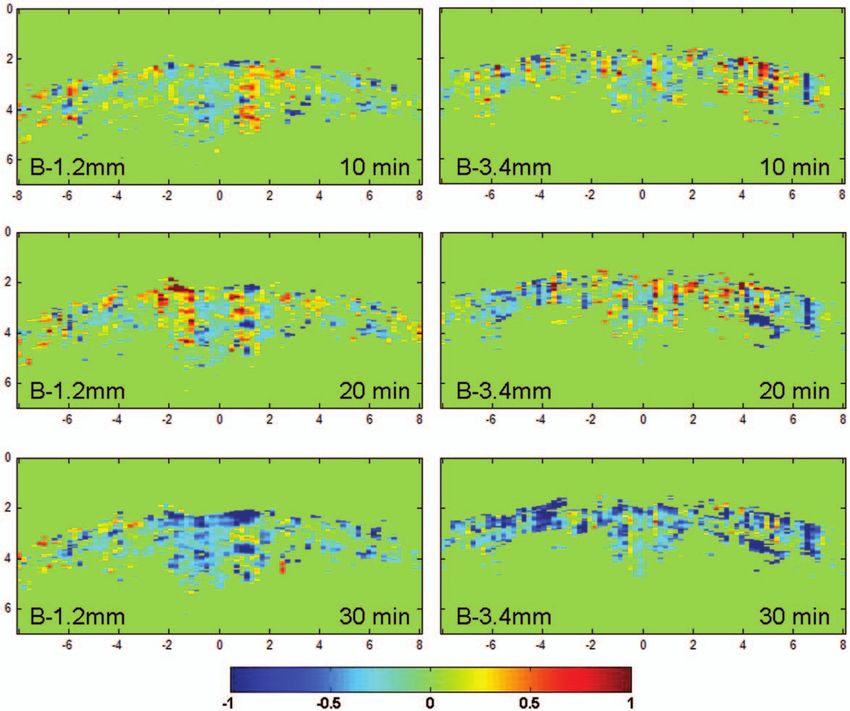
Fig. 3 The difference in HbT between 0 min and 30 min after 5 mg/kg 2. B. G. Schwartz, S. Rezkalla, and R. A. Kloner, “Cardiovascular effects
of cocaine administration at (a) 1.2 mm posterior to bregma and (b) of cocaine,” Circulation 122(24), 2558–2569 (2010).
3.4 mm posterior to bregma. (c) and (d) are the corresponding rat brain 3. L. L. Cregler and H. Mark, “Medical complications of cocaine abuse,”
atlas referent lines. They correspond to (a) and (b), respectively. New England J. Med. 315(23), 1495–1500 (1986).
4. H. Lu, Z. X. Xi, L. Gitajn, W. Rea, Y. Yang, and E. A. Stein, “Cocaine-
induced brain activation detected by dynamic manganese-enhanced
IF indicates the increase in sO2 , and a positive value means
magnetic resonance imaging (MEMRI),” Proc. Natl. Acad. Sci. U.S.A.
the decrease in sO2 . In Fig. 2, the negative area becomes broader 104(7), 2489–2494 (2007).
as time increases, indicating an increase in HbO2 concentration. 5. N. D. Volkow, N. Mullani, K. L. Gould, S. Adler, and K. Krajewski,
Meanwhile, Hb concentration decreased gradually until 30 min “Cerebral blood flow in chronic cocaine users: a study with positron
after injecting cocaine. This change in sO2 indicates the activa- emission tomography,” Br. J. Psychiatry 152, 641–648 (1988).
6. J. Jo and X. Yang, “Detection of cocaine induced rat brain activation
tion of the rat brain after the injection of cocaine hydrochloride.
by photoacoustic tomography,” J. Neurosci. Methods 195(2), 232–235
As a result, the increase of blood oxygenation level after cocaine (2011).
injection indicates the change in the rat brain, which is consis- 7. M. J. Kuhar, M. C. Ritz, and J. W. Boja, “The Dopamine Hypothesis of
tent with the higher sO2 at 30 min than 10 min from previous the Reinforcing Properties of Cocaine,” Trends Neurosci. 14(7), 299–
studies.14, 15 Further, regions with the decreased sO2 were also 302 (1991).
8. F. Luo, K. F. Schmidt, G. B. Fox, and C. F. Ferris, “Differential responses
observed at 10 and 20 min. The result may suggest that there are in CBF and CBV to cocaine as measured by fMRI: Implications for
regions experiencing decreases in sO2 temporarily. pharmacological MRI signals derived oxygen metabolism assessment,”
Figure 3 illustrates the percentage change in HbT concentra- J. Psychiatr. Res. 43(12), 1018–1024 (2009).
tion, and stereotaxic atlas reference lines are shown below the 9. H. Cui, J. Staley, and X. Yang, “The integration of photoacoustic imag-
images for reference. We can confirm the increase in regional ing and high intensity focused ultrasound,” J. Biomed. Opt. 15, 021312
(2010).
HbT concentration and the activated region in the rat brain cortex 10. C. Kim, C. Favazza, and L. H. V. Wang, “In vivo photoacoustic tomog-
due to the effect of cocaine. The increase in HbT concentration is raphy of chemicals: high-resolution functional and molecular optical
not uniform, with a maximum increase of 80% in some regions. imaging at new depths,” Chem. Rev. 110(5), 2756–2782 (2010).
From these results, we are able to identify the regional response 11. Laser Institute of America, “American National Standard for Safe Use of
Lasers ANSI Z136.1-2000,” I. American National Standards Institure,
of the brain to the injection of cocaine hydrochloride by iden-
Ed. (2000).
tifying the anatomical region from stereotaxic atlas reference 12. L. D. Liao, M. L. Li, H. Y. Lai, Y. Y. I. Shih, Y. C. Lo, S. N. Tsang, P. C.
lines. A change in HbT implies a change in relative cerebral P. Chao, C. T. Lin, F. S. Jaw, and Y. Y. Chen, “Imaging brain hemody-
blood volume (rCBV). The conspicuous changes of rCBV on namic changes during rat forepaw electrical stimulation using functional
cortical layers have been shown by a previous study by Marota photoacoustic microscopy,” Neuroimage 52(2), 562–570 (2010).
13. X. D. Wang, X. Y. Xie, G. N. Ku, and L. H. V. Wang, “Noninva-
et al. with MRI (Ref. 16) and the increase in rCBV was shown
sive imaging of hemoglobin concentration and oxygenation in the rat
to be as high as 49% with a 1 mg/kg concentration of cocaine. brain using high-resolution photoacoustic tomography,” J. Biomed. Opt.
When PA imaging is used to detect brain activation, PA imag- 11(2), 024015 (2006).
ing does not directly measure changes in neuronal and glial 14. C. W. Du, M. Tully, N. D. Volkow, W. K. Schiffer, M. Yu, Z. C. Luo,
signaling. Instead, PA imaging detects changes in hemodynamic A. P. Koretsky, and H. Benveniste, “Differential effects of anesthetics
on cocaine’s pharmacokinetic and pharmacodynamic effects in brain,”
activities, and normal neurovascular coupling is assumed. Al- Eur. J. Neurosci. 30(8), 1565–1575 (2009).
though it is believed that blood flow and cell activities are cou- 15. K. F. Schmidt, M. Febo, Q. Shen, F. Luo, K. M. Sicard, C. F. Ferris, E. A.
pled under normal conditions, recent reports, however, described Stein, and T. Q. Duong, “Hemodynamic and metabolic changes induced
that neurovascular coupling may be compromised during pro- by cocaine in anesthetized rat observed with multimodal functional
gression of certain diseases or in response to certain drugs.17, 18 MRI,” Psychopharmacology 185(4), 479–486 (2006).
16. J. J. A. Marota, J. B. Mandeville, R. M. Weisskoff, M. A. Moskowitz,
These results may limit the direct application of PA imaging B. R. Rosen, and B. E. Kosofsky, “Cocaine activation discriminates
on neuroimaging. A better solution may be to directly detect dopaminergic projections by temporal response: An fMRI study in rat,”
the metabolic rate by combining PA imaging and PA Doppler Neuroimage 11(1), 13–23 (2000).
detection in the future. 17. Z. J. Yuan, Z. C. Luo, N. D. Volkow, Y. T. Pan, and C. W. Du, “Imaging
separation of neuronal from vascular effects of cocaine on rat cortical
4 Conclusions brain in vivo,” Neuroimage 54(2), 1130–1139 (2011).
18. M. D’Esposito, L. Y. Deouell, and A. Gazzaley, “Alterations in the bold
We used the PAM technique to monitor the pharmacological FMRI signal with ageing and disease: A challenge for neuroimaging,”
effect with photoacoustic functional detection in small animal Nat. Rev. Neurosci. 4(11), 863–872 (2003).
Journal of Biomedical Optics 090506-3 September 2011 r Vol. 16(9)
Downloaded From: https://www.spiedigitallibrary.org/journals/Journal-of-Biomedical-Optics on 31 May 2021
Terms of Use: https://www.spiedigitallibrary.org/terms-of-useYou can also read