Comparison of the triglyceride glucose index and blood leukocyte indices as predictors of metabolic syndrome in healthy Chinese population
←
→
Page content transcription
If your browser does not render page correctly, please read the page content below
www.nature.com/scientificreports
OPEN Comparison of the triglyceride
glucose index and blood leukocyte
indices as predictors of metabolic
syndrome in healthy Chinese
population
Hai‑Yan Lin, Xiu‑Juan Zhang, Yu‑Mei Liu, Ling‑Yun Geng, Li‑Ying Guan & Xiao‑Hong Li*
Triglyceride glucose (TyG) index and inflammatory markers are reported to have a positive association
with metabolic syndrome (MetS). However, no previous study has assessed the value of TyG index
and inflammatory markers as predictors of metabolic syndrome in the same study. This study looks
at the comparison of the triglyceride index and blood leukocyte indices as predictors of metabolic
syndrome in the Chinese population. The study cohort involved 1542 Chinese population without
metabolic syndrome. The subjects underwent comprehensive routine health examination in 2011 and
returned for a follow-up examination in 2016. Metabolic syndrome was defined according to Chinese
Diabetes Society criteria, using body mass index for the replacement of waist circumference. TyG
index, total leukocytes, neutrophils, lymphocytes, and neutrophil-to-lymphocyte ratio (NLR) were
measured. Adjust d logistic models were used to assess the relationship between TyG index, blood
leukocyte indices, and incident MetS. Receiver operating characteristic (ROC) curves were performed
to determine the predictive value of TyG index and blood leukocyte indices for MetS. Results from
multivariate logistic regression analysis showed that, in the adjusted model, the subjects with the
highest quartile of TyG index and neutrophils had a 3.894- and 1.663-fold increased incidence of
MetS (P < 0.0001 and P = 0.027), respectively. No significant association was observed between total
leukocytes, lymphocytes, NLR with incident MetS. ROC analysis showed that the AUC of TyG index
and neutrophils were 0.674 and 0.568 for incident MetS, respectively. TyG index rather than blood
leukocyte indices may have the strongest predictive value in MetS development over a 5-year period.
Metabolic syndrome (MetS), a cluster of metabolic abnormalities characterized by obesity, hypertension, dys-
lipidemia, and glucose dysregulation, is associated with the risk of diabetes, cardiovascular disease, and overall
mortality1,2. Insulin resistance plays a major role in the progression of Metabolic s yndrome3. Chronic inflam-
mation and oxidative stress also have been implicated in the underlying pathogenesis4,5.
The triglyceride glucose (TyG) index, which is calculated from fasting measurements of triglyceride and
glucose, has been suggested as a reliable surrogate marker of IR6–8. Previous studies have found that a high base-
line TyG index was related to the development of diabetes and coronary a therosclerosis9–11. To our knowledge,
although a cross-sectional study has recently shown that TyG index was positively correlated with MetS12, the
relationship between TyG and MetS development has not been evaluated in the longitudinal study.
Leukocytes are common, inexpensive, and broadly utilized marker of inflammation. Numerous studies have
demonstrated increased total leukocytes, neutrophils, lymphocytes, and neutrophil to lymphocyte ratio (NLR)
were significantly associated with M etS13–16. However, conclusions from some studies are i nconsistent15,17,18. For
example, Meng et al.15 reported that total leukocytes, neutrophils, and lymphocytes, but not NLR were associ-
ated with MetS, whereas Vahit et al.17 and Liu et al.18 reported that NLR had a significant association with MetS.
However, compared with the control group, there were no changes in the level of total leukocytes and neutrophils
except lymphocytes were significantly higher in the MetS group. Therefore, it is worthwhile to further evaluate
the temporal association between the blood leukocyte indices and the risk of MetS. In addition, although the
Health Management Center, Shandong Provincial Hospital Affiliated to Shandong First Medical University,
Jinan 250021, Shandong, China. *email: xiaohongly@hotmail.com
Scientific Reports | (2021) 11:10036 | https://doi.org/10.1038/s41598-021-89494-9 1
Vol.:(0123456789)www.nature.com/scientificreports/
blood leukocyte indices and TyG index are associated with MetS, few studies have compared their predictive
values in MetS development within one population.
Therefore, in this prospective study, as a primary outcome, we aimed to analyze the potential predictor value
of the blood leukocyte indices in MetS development. Furthermore, the secondary outcome of this study was to
compare the clinical utility of TyG index and the blood leukocyte indices in predicting incident MetS among
healthy Chinese population during the 5 years of the follow-up period.
Methods
Study subjects. The study comprised 2585 Chinese population who had undergone routine health exami-
nation at Health Management Center of Shandong Provincial Hospital affiliated to Shandong First Medical Uni-
versity, China in 2011 and who had returned for a follow-up examination in 2016. Among them, the individuals
(n = 628) who had an acute inflammatory disease or recent infection, renal dysfunction, liver problems, or all
types of cancer, and those who (n = 241) with missing data on the questionnaire or smoking history question-
naire, anthropometric measurements, or biochemical parameters were excluded. In addition, subjects (n = 178)
with MetS were further excluded at baseline. Therefore, a total of 1542 subjects (1056 men and 486 women)
with a mean age of 44.8 ± 12.6 years (range: 22–85 years) remained. The study was approved by the institutional
review board of Shandong Provincial Hospital affiliated to Shandong First Medical University. Written informed
consents were obtained from all subjects prior to the health check-up when they visited the Health Management
Center.
Study measurement. The physical examination comprised blood pressure (BP) and anthropometric
measurements, including height, weight, and body mass index (BMI). BMI was calculated as weight (kg) divided
by height (m)2. The BP was measured by well-trained nurses two times in the left arm of seated participants using
an automated electronic device (OMRON model HEM-752 Fuzzy, Omron Company, Dalian, China) after 5-min
sitting. The average of the two readings was calculated to determine the reported BP. Blood samples were col-
lected from subjects who had fasted for ≥ 12 h. The levels of fasting blood glucose (FBG), lipids including triglyc-
eride (TG), total cholesterol (CH), high-density lipoprotein cholesterol (HDL-C), low-density lipoprotein cho-
lesterol (LDL-C) were measured using an Olympus AU5400 system. The TyG index was calculated as ln[fasting
triglycerides (mg/dl) x fasting glucose (mg/dl)/2]19. Total leukocytes, including neutrophils and lymphocytes
count analysis, were performed in the hematology laboratory of our hospital, and NLR values were calculated.
Smoking habit was defined by having ≥ 5 cigarettes per day.
According to the guidelines for Type 2 Diabetes in China by Diabetes Branch of the Chinese Medical
Association20, using BMI for the replacement of waist circumference, the MetS was defined as having any three
or more of the following factors: (a) overweight and/or obesity: BMI ≥ 25.0 kg/m2; (b) raised FPG: ≥ 6.1 mmol/L or
2-h plasma glucose (2hPG) level ≥ 7.8 mmol/L or previously diagnosed as type 2 diabetes and taking anti glycemic
medication; (c) raised BP: ≥ 130/85 mmHg, or previously diagnosed as hypertension and taking antihypertensive
medication; (d) raised TG: ≥ 1.7 mmol/L; and/or (e) reduced HDL-C: < 1.04 mmol/L.
Statistical analysis. SPSS19.0 was used for data analysis, and PASS11 was used to estimate the sample size
and analyze the statistical power of the results. A value of less than 0.05 was deemed statistically significant. The
distribution of the different variables was examined for normality by the Kolmogotov-Smirnov test. Categori-
cal variables were expressed in percentages and continuous variables in mean (SD) or geometric mean (95%
confidence interval).
Between-group differences with respect to categorical variables were assessed using a Chi-square test.
Between-group differences with respect to continuous variables of normal distribution were assessed using
Student test or one-way ANOVA, and continuous variables of non-normal distribution were assessed using
Mann–Whitney U test or Kruskal–Wallis test.
Multivariate logistic regression analysis was used to calculate the odds ratios (ORs) and 95% confidence
intervals (CI) of incident MetS for each investigated indicator quartile compared with the lowest quartile, with
adjustment for baseline age, sex, smoking status (yes, no), BMI, SBP, DBP. The age, BMI, SBP, DBP were treated
as continuous variables. A receiver operating characteristic (ROC) curve analysis, which was quantified by the
area under the ROC curve (AUC), was used to assess the value of indicators for predicting incident MetS. The
area under ROC curve was compared by the nonparametric Z test. Youden’s index (sensitivity + specificity − 1)
was used to determine the optimal cutoff point of each indicator.
All above methods were carried out in accordance with relevant guidelines and regulations.
Ethical approval. The study was approved by the institutional review board of Shandong Provincial Hospi-
tal affiliated to Shandong First Medical University.
Results
A total of 1542 metabolic syndrome-free participants at baseline were enrolled in this study. Of these, 179 (11.4%)
subjects who developed MetS during the 5 years follow-up period were categorized as positive for MetS (MS),
while 1363 (88.6%) subjects free of MetS were categorized as NMS. The baseline demographic characteristics
and laboratory parameters of the population are shown in Table 1. A significant between-group difference in
TyG index was observed in the subjects with MetS compared to subjects free of MetS (8.75 (8.68, 8.82) vs 8.45
(8.43, 8.48); P < 0.0001). Compared with subjects free of MetS, those with MetS were tend to have higher levels
of total leukocytes, neutrophils, and lymphocytes. In addition, a higher BMI, SBP, DBP, CH, TG, LDL-C, and
fasting blood glucose, the proportion of male subjects smokers, along with a lower level of HDL-C were observed
Scientific Reports | (2021) 11:10036 | https://doi.org/10.1038/s41598-021-89494-9 2
Vol:.(1234567890)www.nature.com/scientificreports/
Characteristic NMS MS P-Value
Subjects 1363 179
Age (years) 44.9 (44.2, 45.6) 45.0 (44.3, 46.7) 0.655
Gender (male-n-%) 902(67.0%) 154 (86.0%) < 0.0001
Smoking (n-%) 232 (17.2%) 44 (24.6%) 0.01
Body mass index (kg/m2) 24.0 (23.9, 24.2) 26.2 (25.8, 26.6) < 0.0001
Systolic blood pressure (mmHg) 119.5 (118.7, 120.4) 125.8 (123.7, 128.0) < 0.0001
Diastolic blood pressure (mmHg) 70.2 (69.6, 70.7) 75.4 (73.8, 77.0) < 0.0001
Leukocytes (× 109/L) 5.21 (6.14, 6.28) 6.60 (6.39 6.81) 0.001
Neutrophils (× 109/L) 3.39 (3.33, 3.44) 3.60 (3.46, 3.75) 0.003
Lymphocytes (× 109/L) 2.25 (2.22, 2.28) 2.39 (2.30, 2.49) 0.003
NLR 1.59 (1.56, 1.62) 1.57 (1.50, 1.65) 0.736
High-density lipoprotein (mmol/L) 1.38 (1.36, 1.39) 1.22 (1.19, 1.25) < 0.0001
Low-density lipoprotein (mmol/L) 3.28 ± 0.02 3.44 ± 0.82 < 0.0001
Total cholesterol (mmol/L) 5.13 ± 0.25 5.21 ± 0.78 < 0.0001
Triglyceride (mmol/L) 1.24 (1.20, 1.28) 1.62 (1.48, 1.75) < 0.0001
Fasting blood glucose (mmol/L) 5.41 (5.37, 5.45) 5.53 (5.43, 5.64) < 0.0001
TyG index 8.45 (8.43, 8.48) 8.75 (8.68, 8.82) < 0.0001
Table 1. Participant baseline demographic characteristics and laboratory parameters by metabolic syndrome
status (n = 1542).
in subjects with MetS (P < 0.01 for all). No significant differences were observed on NLR (P = 0.736) and age
(P = 0.655) between MS and NMS groups.
To determine independent variables for the incidence of MetS, multivariate logistic regression analysis was
performed and results showed in Table 2. Subjects with the higher TyG index, total leukocytes, neutrophils, and
lymphocytes significantly increased the incidence of MetS (P < 0.05 for all). After adjusting for age, sex, and
smoking habits, total leukocytes and lymphocytes were no longer independent predictors of MetS (model 1),
whereas the associations between TyG index, neutrophils, and incident MetS had no change, and continued to
maintain even after further adjustments were made for BMI and blood pressure levels (model 2). In the final
model, the subjects with the highest quartile of TyG index and neutrophils had a 3.894- and 1.663-fold increased
incidence of MetS (P < 0.0001 and P = 0.027), respectively.
The accuracy of TyG index and neutrophils and their sensitivity and specificity in predicting incident MetS
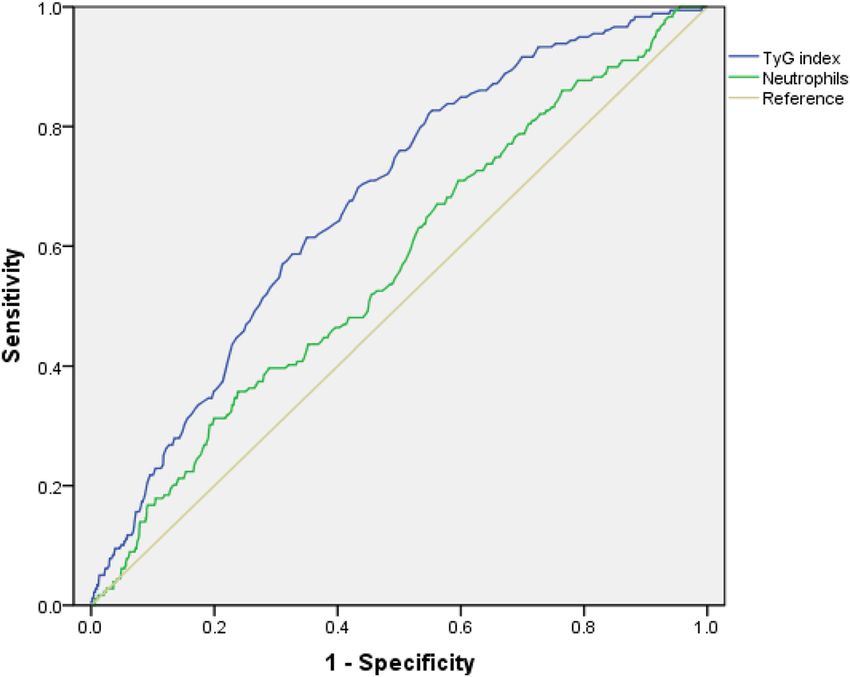
were compared and the results showed in Fig. 1 and Table 3. The AUC of TyG index and neutrophils were 0.674
and 0.568 for incident MetS, respectively. Further Z test was performed to compare the area under ROC curve,
results showed that the difference was statistically significant (Z = 3.56 P < 0.05). The statistical power for two
ROC curves was 0.98 with β = 0.0165. The optimal cutoff value of TyG index, neutrophils based on Youden’s
index in predicting incident MetS was 8.52, 3.26 × 10⁹/L, with a sensitivity and specificity of 70.4% and 55.9%,
55.3%, and 50.3%, respectively.
Discussion
The current study examined associations between TyG index, blood leukocyte indices (total leukocytes, neutro-
phils, lymphocytes, NLR), and incident MetS, moreover compared their predicting values in MetS development
in a normal check-up adult population during the 5 years of follow-up period. The results have demonstrated
that, of the blood leukocyte indices, although total leukocytes, neutrophils, and lymphocytes were each associated
with the incident MetS, neutrophils were the most strongly associated with MetS after adjusting for potential
confounding factors (including age, sex, BMI, smoking status, and blood pressure). The most importantly, a
ROC curve analysis in this study indicated that TyG index was more useful for predicting individuals who were
most likely to develop MetS than neutrophils. To our knowledge, this study is the first prospective study to assess
the predicting value of TyG index and blood leukocyte indices in incident MetS within one healthy population.
TyG index has been reported to be closely correlated with insulin resistance, the presence of coronary artery
complications in type 2 diabetes and healthy adults. For example, previous cross-sectional studies suggested
that TyG index was a useful marker for early identification of insulin resistance individuals6, and the predic-
tive value of the TyG index for insulin resistance was even better than that of the HOMA-IR21,22. A 4-year
retrospective longitudinal study in non-diabetic adults indicated that high baseline TyG index was related to
diabetes development9. Moreover, it was confirmed that a high TyG index was associated with an increased
risk of microalbuminuria and cerebrovascular disease among type 2 diabetes p atients23. Previous studies have
shown that TyG index was associated with coronary a therosclerosis10,11, and was also a useful marker for pre-
dicting subclinical coronary in healthy individuals with a low CV risk burden24. Results from the most current
cross-sectional study showed that TyG index increased with the number of MetS c omponents12. In our present
longitudinal study, it is further confirmed that a high baseline TyG index is associated with the development of
MetS in the healthy population.
Scientific Reports | (2021) 11:10036 | https://doi.org/10.1038/s41598-021-89494-9 3
Vol.:(0123456789)www.nature.com/scientificreports/
Quartiles
Q1 Q2 Q3 Q4 P for trend
TyG index
Range ≤ 8.14 8.15–8.48 8.49–8.81 > 8.82
MS cases/total number of each quartile (%) 12/386 39/387 55/394 73/375
No adjusted 1 3.496 (1.799–6.780) 5.057 (2.662–9.604) 7.534 (4.016–14.132) < 0.0001
Model 1 1 3.015 (1.542–5.896) 4.127 (2.146–7.936) 5.924 (3.113–11.275) < 0.0001
Model 2 1 2.316 (1.169–4.588) 2.713 (1.389–5.300) 3.894 (2.011–7.537) < 0.0001
Total leukocytes
Range ≤ 5.30 5.31–6.12 6.13–7.03 > 7.04
MS cases/total number of each quartile (%) 32/389 43/384 45/385 59/384
No adjusted 1 1.407 (0.870–2.276) 1.477 (0.916–2.379) 2.025 (1.284–3.195) 0.021
Model 1 1 1.252 (0.769–2.038) 1.255 (0.773–2.037) 1.692 (1.064–2.689) 0.147
Model 2 1 1.187 (0.721–1.956) 1.102 (0.671–1.809) 1.298 (0.806–2.092) 0.730
Neutrophils
Range ≤ 2.72 2.73–3.28 3.28—3.95 > 3.96
MS cases/total number of each quartile (%) 31/387 50/384 36/387 62/384
No adjusted 1 1.719 (1.072–2.757) 1.178 (0.713–1.946) 2.211 (1.400–3.491) 0.002
Model 1 1 1.707 (1.059–2.752) 1.044 (0.628–1.735) 2.090 (1.317–3.317) 0.002
Model 2 1 1.606 (0.985–2.618) 0.971 (0.579–1.630) 1.663 (1.034–2.672) 0.027
Lymphocytes
Range ≤ 1.85 1.86–2.20 2.21–2.62 > 2.63
MS cases/total number of each quartile (%) 33/390 46/383 40/387 60/382
No adjusted 1 1.477 (0.922–2.366) 1.247 (0.769–2.023) 2.016 (1.284–3.164) 0.015
Model 1 1 1.378 (0.854–2.224) 1.066 (0.650–1.750) 1.663 (1.048–2.639) 0.089
Model 2 1 1.301 (0.796–2.126) 0.959 (0.578–1.592) 1.283 (0.797–2.064) 0.421
NLR
Range ≤ 1.17 1.18–1.47 1.48–1.88 > 1.89
MS cases/total number of each quartile (%) 42/390 48/388 45/386 44/378
No adjusted 1 1.170 (0.753–1.817) 1.093 (0.700–1.708) 1.092 (0.697–1.710) 0.762
Model 1 1 1.155 (0.740–1.801) 1.102 (0.702–1.730) 1.186 (0.752–1.869) 0.888
Model 2 1 1.148 (0.728–1.810) 1.094 (0.689–1.736) 1.174 (0.736–1.873) 0.908
Table 2. Associations of TyG index, inflammatory markers and risk of metabolic syndrome incidence (odds
rations and 95% confidence intervals). Data are expressed as ORs (95% CI). Model 1: adjusted for age, sex,
smoking; model 2: Model 1 adjusted further for body mass index, blood pressure.
Figure 1. Receiver operating characteristic (ROC) curves of TyG index and neutrophils in predicting incident
metabolic syndrome.
Scientific Reports | (2021) 11:10036 | https://doi.org/10.1038/s41598-021-89494-9 4
Vol:.(1234567890)www.nature.com/scientificreports/
AUC (95%CI) Cutoff Sensitivity (%) Specificity (%)
TyG index 0.674 (0.635, 0.713) 8.52 70.4 55.9
Neutrophils (× 109/L) 0.586 (0.560, 0.612) 3.26 55.3 50.3
Table 3. Areas under the ROC Curve (AUC), sensitivity and specificity by the optimized cutoff points for TyG
index and neutrophils in predicting metabolic syndrome.
Total leukocytes, neutrophils, and lymphocytes are common, inexpensive, and broadly utilized markers of
inflammation. They activate major cell types involved in acute and chronic inflammation. Similar to previous
studies15, increased total leukocytes, neutrophils, and lymphocytes were observed in the subjects of developed
MetS in the present study. Previous studies presented that systemic inflammatory markers were associated with
age, gender, smoking history, body weight, and disease of h ypertension25–29. Therefore, confounding factors
including age, sex, smoking status, BMI, and blood pressure were taken into account in our analysis. After adjust-
ing for the multiple potential confounding factors, the associations between total leukocytes and lymphocytes
with incident MetS no longer existed. However, neutrophils continued to have a strong association with incident
MetS. These findings are consistent with previous findings that neutrophils is a useful biomarker of inflamma-
tion in nascent M etS30.
The neutrophil-to-lymphocyte ratio (NLR), calculated by dividing the neutrophil by the lymphocyte, has
been found to be a reliable indicator of inflammation and correlates with the presence and severity of M etS18,31.
It is interesting that the previous cross-sectional studies have reported a positive association between NLR and
MetS, in contrast, our study did not find this association. A most recent study showing a no-significant increase
in NLR in patients with nascent MetS30, which may explain why our findings did not show a positive correlation
between NLR and the development of MetS.
It is noteworthy that the present study provides beneficial data for comparing the value of TyG index and
leukocyte indices in predicting incident MetS in one report. A high AUC of the TyG index was expected, as the
TyG index includes triglyceride and glucose, the main components of the metabolic syndrome. As determined
based on the AUC of the ROC curve and a further Z test, TyG index had a greater predictive power for incident
MetS than neutrophils.
The present study showed the optimal TyG index cutoff for incident MetS in Chinese adults was 8.52. Shin
et al12 reported the optimal cutoff of TyG index to be 8.81 for MetS in middle-aged and older Korean populations.
Based on the findings, it is suggested there might be a standardized cut-off value for TyG index in estimating the
development of MetS, as well as initial e valuation12. Due to the importance of early lifestyle intervention in the
treatment of MetS, elevated TyG index levels can provide a significant clue for the assessment of the high-risk
MetS population. Given the variability of triglyceride levels according to ethnicity, further studies are needed to
assess the TyG index in other populations.
There are several limitations of the present study that need to be noted. First, the objects of study and analy-
sis were those who visited the health management center and were annually follow-up examination, therefore,
the findings of this study might not be representative of the general population. Second, the diagnostic criteria
for MetS in this study were not the most commonly used International Diabetes Federation and the National
Cholesterol Education Adult Treatment Panel III-R, but the Diabetes Branch of the Chinese Medical Association
based on the study of MetS in China. However, which is more consistent with the Chinese characteristics. Third,
instead of waist circumference, BMI was used in the definition of MetS due to a lack of corresponding data. This
lack of data might have led to a miss estimation of the actual prevalence of MetS. Fourth, our study population
was relatively small, therefore the statistical power may be limited due to the small number of incident cases.
In conclusion, compared with the total leukocytes, lymphocytes, and NLR, neutrophils appear to be a robust
cost-effective marker of inflammation in predicting the incidence of MetS in healthy people. Furthermore, TyG
index appears to be superior to the neutrophils in predicting the risk of incident MetS in this group. Additional
large and long-term prospective studies are required to establish the role of TyG index in the MetS development.
Received: 27 November 2020; Accepted: 21 April 2021
References
1. Laaksonen, D. E. et al. Metabolic syndrome and development of diabetes mellitus: application and validation of recently suggested
definitions of the metabolic syndrome in a prospective cohort study. Am. J. Epidemiol. 156, 1070–1077. https://doi.org/10.1093/
aje/kwf145 (2002).
2. Isomaa, B. et al. Cardiovascular morbidity and mortality associated with the metabolic syndrome. Diabetes Care 24, 683–689.
https://doi.org/10.2337/diacare.24.4.683 (2001).
3. Gluvic, Z. et al. Link between metabolic syndrome and insulin resistance. Curr. Vasc. Pharmacol. 15, 30–39. https://doi.org/10.
2174/1570161114666161007164510 (2017).
4. Houstis, N., Rosen, E. D. & Lander, E. S. Reactive oxygen species have a causal role in multiple forms of insulin resistance. Nature
440, 944–948. https://doi.org/10.1038/nature04634 (2006).
5. Lugrin, J., Rosenblatt-Velin, N., Parapanov, R. & Liaudet, L. The role of oxidative stress during inflammatory processes. Biol. Chem.
395, 203–230. https://doi.org/10.1515/hsz-2013-0241 (2014).
6. Du, T. et al. Clinical usefulness of lipid ratios, visceral adiposity indicators, and the triglycerides and glucose index as risk markers
of insulin resistance. Cardiovasc. Diabetol. 13, 146. https://doi.org/10.1186/s12933-014-0146-3 (2014).
Scientific Reports | (2021) 11:10036 | https://doi.org/10.1038/s41598-021-89494-9 5
Vol.:(0123456789)www.nature.com/scientificreports/
7. Guerrero-Romero, F. et al. Fasting triglycerides and glucose index as a diagnostic test for insulin resistance in young adults. Arch.
Med. Res. 47, 382–387. https://doi.org/10.1016/j.arcmed.2016.08.012 (2016).
8. Van der Walt, A., Baatjies, R., Singh, T. & Jeebhay, M. F. Environmental factors associated with baseline and serial changes in
fractional exhaled nitric oxide (FeNO) in spice mill workers. Occup. Environ. Med. 73, 614–620. https://doi.org/10.1136/oemed-
2015-103005 (2016).
9. Lee, D. Y. et al. Predictive value of triglyceride glucose index for the risk of incident diabetes: a 4-year retrospective longitudinal
study. PLoS ONE 11, e0163465. https://doi.org/10.1371/journal.pone.0163465 (2016).
10. Kim, M. K. et al. Relationship between the triglyceride glucose index and coronary artery calcification in Korean adults. Cardiovasc.
Diabetol. 16, 108. https://doi.org/10.1186/s12933-017-0589-4 (2017).
11. Won, K. B. et al. The relationship of insulin resistance estimated by triglyceride glucose index and coronary plaque characteristics.
Medicine 97, e10726. https://doi.org/10.1097/MD.0000000000010726 (2018).
12. Shin, K. A. & Kim, Y. J. Usefulness of surrogate markers of body fat distribution for predicting metabolic syndrome in middle-aged
and older Korean populations. Diabetes Metab. Syndr. Obes. Targets Ther. 12, 2251–2259. https://doi.org/10.2147/DMSO.S217628
(2019).
13. Babio, N. et al. White blood cell counts as risk markers of developing metabolic syndrome and its components in the PREDIMED
study. PLoS ONE 8, e58354. https://doi.org/10.1371/journal.pone.0058354 (2013).
14. Yang, H. et al. Positive association between the metabolic syndrome and white blood cell counts in Chinese. Asia Pac. J. Clin. Nutr.
26, 141–147. https://doi.org/10.6133/apjcn.102015.13 (2017).
15. Meng, G. et al. Comparing the diagnostic ability of inflammatory markers in metabolic syndrome. Clin. Chim. Acta 475, 1–6.
https://doi.org/10.1016/j.cca.2017.09.023 (2017).
16. Sun, S. et al. Subnormal peripheral blood leukocyte counts are related to the lowest prevalence and incidence of metabolic syn-
drome: Tianjin chronic low-grade systemic inflammation and health cohort study. Med. Inflamm. 2014, 412386. https://doi.org/
10.1155/2014/412386 (2014).
17. Vahit, D., Akboga, M. K., Samet, Y. & Huseyin, E. Assessment of monocyte to high density lipoprotein cholesterol ratio and
lymphocyte-to-monocyte ratio in patients with metabolic syndrome. Biomark Med. 11, 535–540. https://doi.org/10.2217/bmm-
2016-0380 (2017).
18. Liu, C. C. et al. Neutrophil-to-lymphocyte ratio as a predictive marker of metabolic syndrome. Med. (Baltimore) 98, e17537. https://
doi.org/10.1097/MD.0000000000017537 (2019).
19. Guerrero-Romero, F. et al. The product of triglycerides and glucose, a simple measure of insulin sensitivity. Comparison with the
euglycemic-hyperinsulinemic clamp. J. Clin. Endocrinol. Metab. 95, 3347–3351. https://doi.org/10.1210/jc.2010-0288 (2010).
20. Fan, L. et al. Non-linear relationship between sleep duration and metabolic syndrome: a population-based study. Medicine 99,
e18753. https://doi.org/10.1097/MD.0000000000018753 (2020).
21. Vasques, A. C. et al. TyG index performs better than HOMA in a Brazilian population: a hyperglycemic clamp validated study.
Diabetes Res. Clin. Pract. 93, e98–e100. https://doi.org/10.1016/j.diabres.2011.05.030 (2011).
22. Lee, S. H. et al. Predicting the development of diabetes using the product of triglycerides and glucose: the Chungju metabolic
disease cohort (CMC) study. PLoS ONE 9, e90430. https://doi.org/10.1371/journal.pone.0090430 (2014).
23. Chiu, H. et al. Associations between triglyceride-glucose index and micro- and macro-angiopathies in type 2 diabetes mellitus.
Nutrients https://doi.org/10.3390/nu12020328 (2020).
24. Park, G. M. et al. Triglyceride glucose index is a useful marker for predicting subclinical coronary artery disease in the absence of
traditional risk factors. Lipids Health Dis. 19, 7. https://doi.org/10.1186/s12944-020-1187-0 (2020).
25. Franceschi, C. et al. Inflamm-aging. An evolutionary perspective on immunosenescence. Ann. N. Y. Acad. Sci. 908, 244–254.
https://doi.org/10.1111/j.1749-6632.2000.tb06651.x (2000).
26. Cartier, A. et al. Sex differences in inflammatory markers: what is the contribution of visceral adiposity?. Am. J. Clin. Nutr. 89,
1307–1314. https://doi.org/10.3945/ajcn.2008.27030 (2009).
27. Strohacker, K., Wing, R. R. & McCaffery, J. M. Contributions of body mass index and exercise habits on inflammatory markers: a
cohort study of middle-aged adults living in the USA. BMJ Open https://doi.org/10.1136/bmjopen-2013-002623 (2013).
28. Frohlich, M. et al. Independent association of various smoking characteristics with markers of systemic inflammation in men.
Results from a representative sample of the general population (MONICA Augsburg Survey 1994/95). Eur. Heart J. 24, 1365–1372.
https://doi.org/10.1016/s0195-668x(03)00260-4 (2003).
29. Dunkley, A. J., Taub, N. A., Davies, M. J., Stone, M. A. & Khunti, K. Is having a family history of type 2 diabetes or cardiovascular
disease a predictive factor for metabolic syndrome?. Prim Care Diabetes 3, 49–56. https://d oi.o
rg/1 0.1 016/j.p
cd.2 009.0 2.0 02 (2009).
30. Adams-Huet, B. & Jialal, I. The neutrophil count is superior to the neutrophil/lymphocyte ratio as a biomarker of inflammation
in nascent metabolic syndrome. Ann. Clin. Biochem. 56, 715–716. https://doi.org/10.1177/0004563219866221 (2019).
31. Buyukkaya, E. et al. Correlation of neutrophil to lymphocyte ratio with the presence and severity of metabolic syndrome. Clin.
Appl. Thromb. Hemost. 20, 159–163. https://doi.org/10.1177/1076029612459675 (2014).
Acknowledgements
We thank all doctors, nurses, and other staff members of the Health Management Center, Shandong. Provincial
Hospital affiliated to Shandong First Medical University for their involvement in the project.
Author contributions
X.-H.L. designed the study. H.-Y.L., X.-J.Z., Y.-M.L., L.-Y.G. and L.-Y.G. collected the data. Y.-M.L. and L.-Y.G.
performed the analyses, H.-Y.L. and X.-J.Z. wrote the first draft of the manuscript. X.-H.L. provided language
help and writing assistance. All authors contributed to and approved the final manuscript.
Competing interests
The authors declare no competing interests.
Additional information
Correspondence and requests for materials should be addressed to X.-H.L.
Reprints and permissions information is available at www.nature.com/reprints.
Publisher’s note Springer Nature remains neutral with regard to jurisdictional claims in published maps and
institutional affiliations.
Scientific Reports | (2021) 11:10036 | https://doi.org/10.1038/s41598-021-89494-9 6
Vol:.(1234567890)www.nature.com/scientificreports/
Open Access This article is licensed under a Creative Commons Attribution 4.0 International
License, which permits use, sharing, adaptation, distribution and reproduction in any medium or
format, as long as you give appropriate credit to the original author(s) and the source, provide a link to the
Creative Commons licence, and indicate if changes were made. The images or other third party material in this
article are included in the article’s Creative Commons licence, unless indicated otherwise in a credit line to the
material. If material is not included in the article’s Creative Commons licence and your intended use is not
permitted by statutory regulation or exceeds the permitted use, you will need to obtain permission directly from
the copyright holder. To view a copy of this licence, visit http://creativecommons.org/licenses/by/4.0/.
© The Author(s) 2021
Scientific Reports | (2021) 11:10036 | https://doi.org/10.1038/s41598-021-89494-9 7
Vol.:(0123456789)You can also read