Q1 Economic & Market Review - First Quarter 2020 - Gould Asset Management
←
→
Page content transcription
If your browser does not render page correctly, please read the page content below
Q1
Economic & Market Review
             First Quarter 2020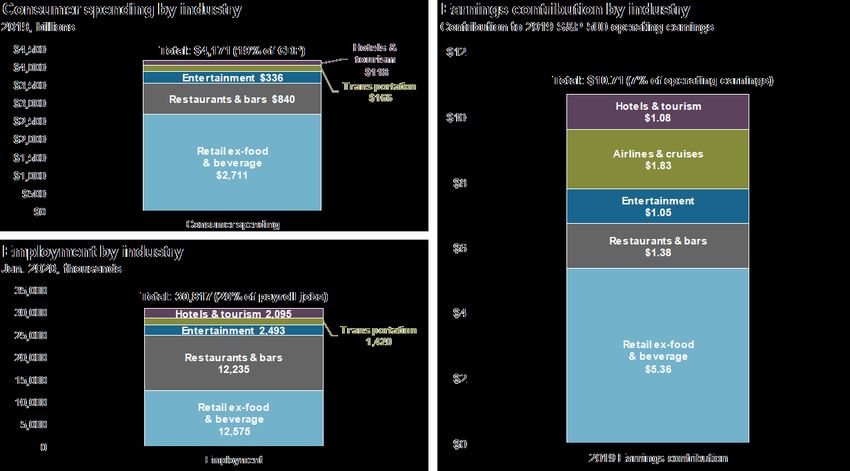
Economic Review
First Quarter 2020

US Comes to Grips with Coronavirus                                       Government Vows “Whatever it Takes”
The US economy grew at a 2.2% annualized rate in the                     The Fed and Congress agreed to sweeping fiscal and
fourth quarter of 2019 before the coronavirus outbreak hit the           monetary stimulus measures to alleviate the gargantuan
country. Estimates for first quarter GDP generally indicate a single-    economic burden caused by social distancing.
digit-percentage contraction. Looking ahead to the second quarter, it
is possible we see year-on-year GDP declines in the 20%-30%              Congress passed the CARES Act, easily America’s largest
range.                                                                   stimulus bill in history ($2.3T, with potentially more coming soon)
                                                                         that provides additional unemployment benefits, direct stimulus
Jobless claims in the US skyrocketed to unprecedented                    checks to qualifying individuals, forgivable loans to small
levels as over 10 million people filed for unemployment benefits in      businesses, and other forms of relief.
the last two weeks of March. The beginning of April saw an
additional 6.6 million jobless claims, bringing the thee-week total to   The Fed also quickly moved to stabilize financial
an astonishing 16.8 million, or 10% of the American workforce. The       markets. In just weeks, the Fed cut rates to near zero,
previous one-week peak in jobless claims was 695,000 in October          implemented programs to purchase unprecedented amounts of
1982.                                                                    bonds (some in the form of ETFs), and even began lending
                                                                         directly to businesses.
Manufacturing activity fell less than expected in March but
still signaled the sector is in contraction. New orders received by      Fed Chair Jerome Powell said the Fed could inject almost
factories dropped to an 11-year low, supporting the view that the US     unlimited relief into capital markets if the Treasury
is already in recession.                                                 Department continues to provide a backstop for bad loans.
Economic Review
First Quarter 2020
A Grim Outlook for Foreign Developed Countries Emerging Markets at Different Stages of the
Fight
The Euro area expanded 0.1% over the fourth quarter,
slowing from its third quarter rate of 0.3%. With France and Italy China’s economic activity remains severely disrupted
already contracting, Europe is expecting a full-blown amid the coronavirus outbreak. Transportation is still restricted,
recession now that most of the area is on lockdown. and consumption and manufacturing have been hit hard. Like in
the US and Europe, China’s government began fiscal and
The European Central Bank also ramped up its monetary monetary stimulus in an attempt to prop up activity.
stimulus measures, announcing its most aggressive sovereign
bond-purchasing program ever, as governments borrow to support In contrast to China, India appears to be at the beginning
their economies. stages of its battle with coronavirus. GDP growth is
expected to fall to a multi-decade low as the full effects of the
Japan’s economy shrank 1.8% during the fourth quarter pandemic become apparent.
as a sales tax hike weighed on private consumption. Like the rest of
the developed world, Japan also faces a severe recession. The Crude oil prices plummeted in March amid a price war
Bank of Japan passed measures to help companies obtain loans between Saudi Arabia and Russia after negotiations broke down.
and increased its purchases of Japanese stock funds. While this was good news at the pump for consumers, it was bad
news for all oil exporting nations, as well as oil-related industries
and the banks who lend to them. The two countries appeared to
be nearing agreement in principle in early April to cut production
and reduce the global crude glut.Market Review: Stocks
First Quarter 2020
Stocks Fall Sharply to Begin 2020 as Coronavirus International developed stocks (down 22.7%) and emerging
Pandemic Batters World Markets markets (down 23.6%) fell a little more than US equities, with
China and the eurozone at the epicenter of the virus’ early spread. A
strong US dollar (up 7.1%) proved to be an additional headwind for
The first quarter of 2020 will be forever remembered for
foreign stocks on the quarter.
the COVID-19 global health crisis and the heavy toll it
took on world economies and markets. Stocks suffered As markets tumbled, market volatility, as measured by the
steep declines as countries went on lockdown, businesses were VIX volatility index, surged to remarkable levels. During
shuttered, and millions of employees were furloughed or laid off. some of the worst days in March, VIX peaked above 80—levels not
seen since the worst of the 2008 financial crisis. At quarter-end,
In the US, large cap stocks, as measured by the S&P 500
markets were still highly volatile with VIX at 53.5, a far cry from the
stock index, fell 19.6% on the quarter. The decline felt all the
sleepy 13.8 reading at the end of 2019.
more jarring, since the S&P 500 had just reached a new all-time
high on February 19th before unraveling as the magnitude of the Returns for the Quarter (%)
virus’s impact became clear.
US Large Cap Stocks -19.60
At its worst point in March, the US stock market was down
33.9% from its mid-February high, a stunning and rapid US Mid/Small Cap Stocks -27.91
end to a 10+ year bull market run, which had been the longest International Developed Stocks -22.72
in history. Emerging Markets Stocks -23.57
Global Stocks -21.26
Every US sector declined in the first quarter, with financials
(down 31.9%), industrials (down 27.1%), and materials (down Period Returns (%) * Annualized
26.3%) the hardest hit (we consider energy an alternative asset and Asset Class 1 Year 3 Years* 5 Years*
discuss it in more detail in our Alternative Assets section below).
US Large Cap Stocks -6.98 5.10 6.73
Technology and healthcare were the lone relative bright
US Mid/Small Cap Stocks -20.53 -1.86 1.53
spots, declining a more modest 11.9% and 12.7%, respectively on
the quarter. International Developed Stocks -13.92 -1.33 -0.13
Emerging Markets Stocks -17.36 -1.25 0.01
Global Stocks -10.76 2.05 3.41
Past performance is not a guarantee of future results. Returns for periods longer than one year are annualized. Indices are not available for direct investment. Index performance does not reflect the expenses
associated with the management of an actual portfolio. Market segment (index representation) as follows: US Large Cap (S&P 500 Index), US Mid/Small Cap (Wilshire 4500 Completion Index), International Developed
(MSCI Europe Australasia Far East Index), Emerging Markets (MSCI Emerging Markets Index), and Global Stocks (MSCI All Country World Index). Growth of $1,000 chart market segmentations as follows: US Stocks (Wilshire
5000 Index) and Foreign Stocks (All Country World Index ex US)Market Review: Bonds
First Quarter 2020
US Government and Other High-Quality Bonds index. This illustrates why maintaining a small allocation to long-
Move Higher as Fed Enacts Emergency Measures duration bonds (as we do in many of our portfolios) can provide
positive diversification benefits during periods of stock market
The Fed threw the proverbial “kitchen sink” at markets, turbulence.
cutting short-term interest rates to their lower bound and
restarting and expanding asset purchase programs (aka Returns for the Quarter (%)
Quantitative Easing). US government and high-quality corporate
bonds responded favorably, with the Bloomberg Barclays
US Total Bond Market 3.15
Aggregate Bond index rising 3.2% on the quarter.
Short-Term Investment Grade Bonds 2.17
Like the stock market, however, it was a volatile quarter for Long-Term Investment Grade Bonds 6.21
bonds as a race for safety and liquidity created Municipal Bonds -0.63
conditions that required the Fed to step in to ensure the Mortgage-Backed Bonds 2.82
orderly functioning of fixed income markets. And not all bond Treasury Inflation-Protected Bonds 1.69
sectors were winners. High yield corporate bonds, for example, fell Foreign Bonds -1.88
12.7%, while the Bloomberg Barclays Municipal Bond index
declined a more modest 0.6%.
Period Returns (%) *Annualized
US Treasury bond yields fell across the yield curve in
Asset Class 1 Year 3 Years* 5 Years*
response to the Fed’s actions and expectations of a
global recession and subdued inflation. The 3-month T-bill US Total Bond Market 8.93 4.82 3.36
yield declined from 1.55% at the end of 2019 to 0.11% on March Short-Term Investment Grade Bonds 5.58 3.08 2.27
31st, while the yield on the 10-year US Treasury dropped from Long-Term Investment Grade Bonds 19.32 9.68 5.99
1.92% to 0.70% over the quarter. Municipal Bonds 3.85 3.96 3.19
Mortgage-Backed Bonds 7.03 4.04 2.94
As is often the case in a falling yield environment, long-
term bonds were the best performers, rising 6.2%, as Treasury Inflation-Protected Bonds 6.85 3.46 2.67
measured by the Bloomberg Barclays Govt/Credit Long-Term Bond Foreign Bonds 1.79 3.14 2.39
Past performance is not a guarantee of future results. Returns for periods longer than one year are annualized. Indices are not available for direct investment. Index performance does not reflect the expenses
associated with the management of an actual portfolio. Market segment (index representation) as follows: US Total Bond Market (Bloomberg Barclays US Aggregate Index), Short-Term Investment Grade (Bloomberg
Barclays US Govt/Credit 1-5 Year Index), Long-Term Investment Grade (Bloomberg Barclays US Govt/Credit Long Index), Municipal (Bloomberg Barclays Municipal Index), Mortgage Backed (Bloomberg Barclays US MBS
Index), Treasury Inflated-Protected (Bloomberg Barclays US TIPS Index), and Foreign (Citi World Govt Bond Non USD Index).Market Review: Alternatives
First Quarter 2020
Oil and Energy Pummeled as Alternative Assets Returns for the Quarter (%)
Tumble; Gold Volatile but Finishes Higher
Somewhat overlooked amid the myriad other COVID-19 US Real Estate Investment Trusts -26.99
crises, oil prices collapsed in early March, dropping over
US Energy Stocks -50.75
75% from their peak in early January. An agreement between
OPEC and other oil producers (most notably Russia) to cut Commodities -23.29
production fell through, right as global demand softened, resulting in
Gold 6.49
a massive glut of crude. With oil prices in freefall, US energy
stocks plummeted, declining 50.8% on the quarter.
Commodities also declined (down 23.3%) in anticipation of Period Returns (%) * Annualized
a global recession, but to a far lesser extent than US energy
Asset Class 1 Year 3 Years* 5 Years*
stocks.
US Real Estate Investment Trusts -20.99 -3.02 -0.42
REITs (down 27.0%) weren’t spared from the broader US Energy Stocks -52.54 -21.72 -14.44
market’s carnage either, as investors fretted over Commodities -22.31 -8.61 -7.76
shuttered businesses and missed retail rental payments. Gold 21.59 10.49 5.36
Typically, a decline in interest rates helps REITs, but not last
quarter, as markets anticipated reduced earnings and cuts to
dividends. Commercial mortgage rates also rose as banks and other
financial institutions became more cautious in how they lend and to
whom.
Gold rose 6.5% and was one of the best performing asset
classes on the quarter. Often considered a “safe haven,” the
precious metal proved volatile on the period, gyrating along with the
broader market, but ultimately finishing higher. Gold is another
example of an asset that historically has provided diversification
benefits during market dislocations.
Past performance is not a guarantee of future results. Returns for periods longer than one year are annualized. Indices are not available for direct investment. Index performance does not reflect the expenses
.
associated with the management of an actual portfolio. Market segment (index representation) as follows: US Real Estate Investment Trusts (MSCI US REIT Index), US Energy Stocks (S&P 500 Energy), Commodities
(Bloomberg Commodity Index), and Gold (London Bullion Market Association Gold P.M. Price). Gold spot price data obtained from Federal Reserve Economic Data.Market Summary
Index Returns
US US International Emerging US US
Large Cap Mid/Small Cap Developed Markets Bond Market Dollar
Q1 2020 STOCKS BONDS/DOLLAR
-19.60% -27.91% -22.72% -23.57% 3.15% 7.07%
Since Jan. 2001
Avg. Quarterly Return 1.7% 2.3% 1.2% 2.4% 1.2% 0.2%
Best 15.9% 21.4% 25.8% 34.8% 4.6% 7.1%
Quarter Q2 2009 Q2 2003 Q2 2009 Q2 2009 Q3 2001 Q1 2020
Worst -21.9% -27.9% -22.7% -27.6% -3.0% -5.4%
Quarter Q4 2008 Q1 2020 Q1 2020 Q4 2008 Q4 2016 Q2 2009
Past performance is not a guarantee of future results. Indices are not available for direct investment. Index performance does not reflect the expenses associated with the management of an actual portfolio.
Market segment (index representation) as follows: US Stock Market (Russell 3000 Index), International Developed Stocks (MSCI World ex USA Index [net div.]), Emerging Markets (MSCI Emerging Markets Index [net div.]),
Global Real Estate (S&P Global REIT Index [net div.]), US Bond Market (Bloomberg Barclays US Aggregate Bond Index), and Global Bond Market ex US (Bloomberg Barclays Global Aggregate ex-USD Bond Index [hedged to
USD]). S&P data © 2020 S&P Dow Jones Indices LLC, a division of S&P Global. All rights reserved. Frank Russell Company is the source and owner of the trademarks, service marks, and copyrights related to the Russell
Indexes. MSCI data © MSCI 2020, all rights reserved. Bloomberg Barclays data provided by Bloomberg.World Stock Market Performance
MSCI All Country World Index with selected headlines from Q1 2020
300
280
260
240
220
200
180
Dec 31 Jan 31 Feb 29 Mar 31
“Foreign Investment “Dow, S&P, Nasdaq All Drop “Dow Soars
“Eurozone “Coronavirus
Falls to Near-Decade More than 4% in Largest One- More Than
Growth Hits Declared
Low as Globalization Day Point Declines on Record” 11% In “US Stocks
6-Year Low” Pandemic by
Slows” World Health Biggest One- Turn in
“Drop in Energy Prices Slowed Organization” Day Jump Worst
“US Trade Deficit US Inflation in January” Since 1933” Quarter
“New Virus Discovered by Since
Chinese Scientists Narrows for First
Time in Six Years” “Oil Prices Collapse “ECB to Buy Bonds 2008”
Investigating Pneumonia “Dow Closes at Record
After Saudi Pledge to Combat Economic
Outbreak” as Worries Abate”
to Boost Output” Slowdown”
“Refinancing Boom “Robust US Payroll “Record Rise in
Fuels Mortgages to Gain Points to “Fed Cuts Rates to Near Unemployment
Post-Crisis Record” Continued Healthy Zero and Will Relaunch Claims Halts Historic
Labor Market” Bond-Buying Program” Run of Job Growth”
These headlines are not offered to explain market returns. Instead, they serve as a reminder that investors should view daily events from a long-term perspective and avoid making
investment decisions based solely on the news.
Graph Source: MSCI ACWI Index [net div.]. MSCI data © MSCI 2020, all rights reserved.
It is not possible to invest directly in an index. Performance does not reflect the expenses associated with management of an actual portfolio. Past performance is not a guarantee of future results.Federal Finances First Quarter 2020 A breakdown of the $2.3 trillion CARES Act passed last month is shown in the left table. The top right chart shows the resulting anticipated spike in the annual federal budget deficit. The chart below right shows the national debt as a percentage of GDP, comparing an estimate of the impact of the CARES Act to the Congressional Budget Office’s (CBO) previous baseline projection of future growth of the deficit. Source: JP Morgan Asset Management
The Fed and Interest Rates
First Quarter 2020
The chart below shows the federal funds rates (the short-term interest rate set by the Federal Reserve) over time, with the dotted line
representing market forecasts. The table lists some the actions the Fed is taking to shore up markets and the economy in response to the
pandemic crisis. In just weeks, the Fed slashed rates to near-zero, purchased trillions of dollars in bonds (including municipal and high yield
corporate bonds), and even agreed to lend to businesses. To date, markets have responded quite positively to the Fed’s extraordinary actions.

 Source: JP Morgan Asset Management
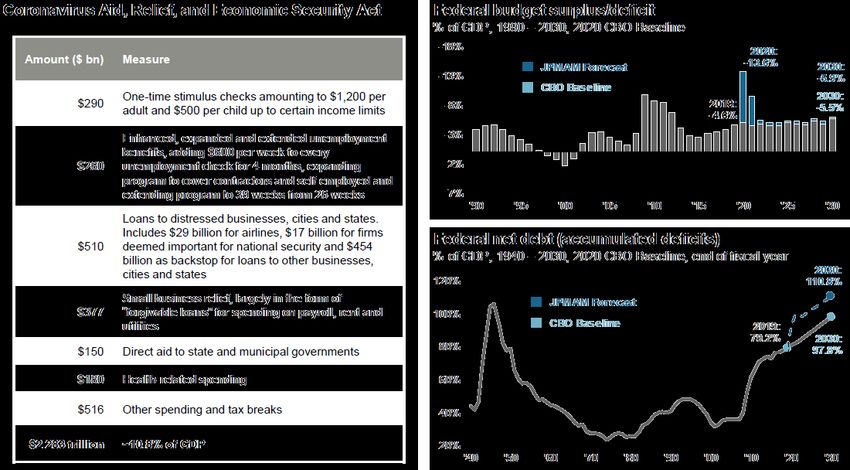
Social Distancing – Most Vulnerable Sectors
First Quarter 2020
These charts take a closer look at the people-facing industries expected to be hardest hit by social distancing measures. The charts on the left
show that these sectors account for 19% of GDP and 20% of payroll jobs, highlighting the lockdown’s huge impact on the economy and
employment. The right chart shows that these sectors account for 7% of total S&P 500 earnings, reflecting their lower-than-average profit
margins. Many other industries are also suffering both directly and indirectly from the lockdown.

 Source: JP Morgan Asset Management
Oil Markets
First Quarter 2020

                                     This chart shows the price of crude oil over the past
                                     20 years. In early 2020, growing supply and
                                     weakening demand were already putting downward
                                     pressure on the prices of oil and other commodities.
                                     A breakdown in negotiations among major oil
                                     exporting nations led both Saudi Arabia and Russia
                                     to announce big production boosts, launching a
                                     price war. Prices fell to their lowest level in 20
                                     years.

                                     This was good news for energy consumers, but bad
                                     news for oil exporting nations and oil-related
                                     industries, as well as the banks and bondholders
                                     who have lent them money.

                                     In April, Saudi Arabia, Russia and others agreed in
                                     principle to cut production, reducing but not
                                     eliminating the global crude oil glut.

Source: JP Morgan Asset Management
You can also read