Journal of Interdisciplinary Cycle Research - JICR!
←
→
Page content transcription
If your browser does not render page correctly, please read the page content below
Journal of Interdisciplinary Cycle Research ISSN NO: 0022-1945
 3 Most Consistent Blue-Chip Shares of the Indian Stock Market during the
 COVID-19 Situation- What and Why
 Stuti Saria1, Dr, Priyanka Raheja2
 Economics, New York University1, Economics, G.D Goenka2
 1
 stutisaria@gmail.com
 2
 p.raheja111@gmail.com

 Abstract— The worldwide stock market has a history of crash and recovery and the Indian stock market is no different from
 that. Sensex plunged 53% in 1992 because of the “Harshad Mehta Scam” but recovered 127% in one and a half years. Due to the
 “Asian Crisis” of 1996, it dipped 40% in four years but recovered 115% in one year. During “Tech Bubble” (2000), it crashed
 56% in one and a half years but recovered 138% in two and a half years. The current market has crashed around 30% in less
 than three months. Due to COVID-19, it cannot be predicted when the economy will be back on track. Some experts even
 compare this meltdown of economies with the “Great Depression” of the 20th century. [5] Accordingly, the purpose of this
 research is to identify the 3 most consistent blue-chip shares of the Indian stock market during the COVID-19 situation and
 address the reasons behind their consistency. The research is a descriptive and correlating studyand it involves the regression
 analysis. The statistical population of the research consists of all the companies listed in the National Stock Exchange (NSE) in
 2020 and systematic elimination has been used to determine the most consistent blue-chip stocks from the population. Selected
 stocks have been classified in the relevant industries. Results of hypothesis 1 show that 90% variation in close value is dependent
 on open value of the NSE. The results of hypotheses 2 and 3 show that there is a correlation between the high value and shares
 traded, and between the low value and shares traded of the NSE, respectively.

 Keywords— High value, low value, open value, close value, shares traded.

 I. INTRODUCTION

 The coronavirus pandemic has hit us all hard. The coming few months are expected to be difficult to navigate as global
 trade has dwindled and all financial markets have witnessed a swift meltdown. The global economy has witnessed a huge
 meltdown during the past few months. The coming few months are expected to be difficult to navigate as global trade has
 dwindled and all financial markets have witnessed a swift meltdown. At present, the financial markets in India are
 witnessing sharp volatility as a result of the fallout in global markets. The study focuses on identifying those blue-chip
 stocks which have been consistent through this situation.

 A blue-chip stock is a huge company with an excellent reputation. These are typically large, well-established and
 financially sound companies that have operated for many years and that have dependable earnings, often paying dividends
 to investors. [7]

 In this study, companies that meet the following criteria as on 31 st March 2020 have been referred to as blue-chip stocks-
1. Market Capitalisation is more than Rs. 50,000 crores
2. Debt to Equity ratio is less than 2
3. Interest Coverage Ratio is greater than 3
4. Average Return on Equity for the past 5 years is greater than 15%.

 There are around 1600 companies listed on the National Stock Exchange (NSE). Out of these, around 1328 companies are
 in active status.

 Out of these 1328 active companies, 44 companies have a market capitalisation of more than Rs. 50,000 crores as on 31 st
 March 2020. Among these 44 companies, 40 have a Debt to Equity ratio of less than 2. 1 company that has a negative Debt
 to Equity ratio has been eliminated. Further, out of these 39 companies, 34 companies have an Interest Coverage Ratio of
 more than 3. Out of these, 20 companies have an average ROE of greater than 15%. Finally, we arrive at a population of 20
 blue chip stocks, which are listed below-

Volume XII, Issue VIII, August/2020 Page No:1136
Journal of Interdisciplinary Cycle Research ISSN NO: 0022-1945

 TABLE I
 IDENTIFIED BLUE-CHIP STOCKS

 S.No. Company Name Basic EPS
 Growth Rate
 (%)
 1 Tata Consultancy Services Ltd. 11.72
 2 Hindustan Unilever Ltd. 11.62
 3 HDFC Bank Ltd. -38.95
 4 Infosys Ltd. 7.96
 5 ITC Ltd. 21.00
 6 Asian Paints Ltd. 24.47
 7 Avenue Supermarts Ltd. 43.27
 8 Maruti Suzuki India Ltd. -24.67
 9 HCL Technologies Ltd. -44.61
 10 Wipro Ltd. 17.44
 11 Coal India Ltd. 8.54
 12 Titan Company Ltd. 10.4
 13 Pidilite Industries Ltd. 12.5
 14 Hindustan Zinc Ltd. -14.45
 15 Britannia Industries Ltd. 32.19
 16 SBI Life Insurance Company Ltd. 7.16
 17 Bajaj Auto Ltd. 9.10
 18 Tech Mahindra Ltd. 5.18
 19 Godrej Consumer Products Ltd. -32.79
 20 Divi's Laboratories Ltd. 3.00

 Out of the 20 companies listed above, we observe that only 5 have a Basic Earnings per Share (EPS) growth rate (from
 2019 to 2020) of greater than 15%. However, only 3 of these blue chips show consistent price trends during the period of
 study i.e. from 6th February 2020 to 6th May 2020. These are listed as follows-

 A. Asian Paints Ltd.

1) Background:Asian Paints Ltd. is engaged in manufacturing, selling and distribution of paints, coatings, home decor
 products, bath fittings and providing of related services. Their big and experienced R&D team has managed to develop
 high quality finishes, which have replaced imports. The company had been performing quite well and its stock reported no
 major price fluctuations until March 2020. It dropped somewhat during the end of March but quickly regained its prices.

 TABLE II
 Date Open value
 (Rs.)
 05-Feb-2020 1889
 24-March- 1446.5
 2020
 05-May-2020 1681

2) Criteria met:

1. Market Capitalisation = Rs. 1,59,850.31 crores, which is greater than Rs. 50,000 crores.
2. Debt to Equity ratio = 0, which is less than 2.
3. Interest Coverage Ratio = 44.97, which is greater than 3.
4. Average Return on Equity for the past 5 years = 26.8%, which is greater than 15%.

 B. Avenue Supermarts Ltd.

1) Background:Avenue Supermarts Ltd. is chain of hypermarkets that does business as DMart in India. It was founded in
 2002 and has grown well since then. The company is engaged in offering various products like food, toiletries, beauty
 products, stationery, garments, kitchenware, toys, home appliances, etc. The stock had been consistent until February 2020,
 when it showed a sudden price hike. However, it started dipping towards March end and managed to regain its prices by
 mid-April.

Volume XII, Issue VIII, August/2020 Page No:1137
Journal of Interdisciplinary Cycle Research ISSN NO: 0022-1945

 TABLE III
 Date Open value
 (Rs.)
 05-Feb-2020 2160
 25-March- 1798.7
 2020
 05-May-2020 2320

2) Criteria met:

1. Debt to Equity ratio = 0.02, which is less than 2.
2. Interest Coverage Ratio = 29.41, which is greater than 3.
3. Market Capitalisation = Rs.1,41,700.71 crores, which is greater than Rs. 50,000 crores.
4. Average Return on Equity for the past 5 years = 15.87%, which is greater than 15%.

 C. Britannia Industries Ltd.

1) Background: Britannia Industries is a well-established Indian food company. It manufactures various food brands that are
 household names in the country. Britannia Bread, having an annual turnover of over 1 lakh tonnes in volume, is the largest
 brand in the organized bread market. The company’s stock showed excellent stability throughout the first 3 months of
 2020. It dipped during March end but the stock quickly regained its position in May.

 TABLE IV
 Date Open value
 (Rs.)
 05-Feb-2020 3269.8
 24-March- 2117
 2020
 05-May-2020 3107

2) Criteria met:

1. Debt to Equity ratio = 0.28, which is less than 2.
2. Interest Coverage Ratio = 29.99, which is greater than 3.
3. Market Capitalisation = Rs. 64,660.72 crores, which is greater than Rs. 50,000 crores.
4. Average Return on Equity for the past 5 years = 33.7%, which is greater than 15%.

 II. PROBLEM STATEMENT
 “To identify the 3 most consistent blue-chip shares of the Indian stock market during the COVID-19 situation and analyse
 the reasons behind their consistency.”

 III. OBJECTIVES
1. To identify the 3 most consistent blue-chip shares of the Indian stock market during the COVID-19 situation.
2. To study the trends of the chosen blue-chip shares of the Indian stock market.
3. To analyze the reasons for the observed trends in the stocks.

 IV. HYPOTHESES

A. Hypothesis 1

 Null Hypothesis(H0): “There is no correlation between the means of open value and close value of the stock exchange.”

 Alternative Hypothesis(H1): “There is a correlation between the means of open value and close value of the stock
 exchange.”

B. Hypothesis 2

 Null Hypothesis(H0): “There is no correlation between the high value and shares traded of the stock exchange.”

Volume XII, Issue VIII, August/2020 Page No:1138
Journal of Interdisciplinary Cycle Research ISSN NO: 0022-1945
 Alternative Hypothesis(H1): “There is a correlation between the high value and shares traded of the stock exchange.”

C. Hypothesis 3

 Null Hypothesis(H0): “There is no correlation between the low value and shares traded of the stock exchange.”

 Alternative Hypothesis(H1): “There is a correlation between the low value and shares traded of the stock exchange.”

 V. RESEARCH METHODOLOGY

 The study is based on secondary data collected about the 3 blue-chip NSE stocks over a period of 3 months i.e. from 6 th
 February 2020 to 6th May 2020. The sources of the data are https://in.finance.yahoo.com/ and https://www.nseindia.com.
 Data has been collected about the open value, high value, low value, close value and shares traded in the National Stock
 Exchange. A descriptive study has been done to analyze the data. The tools used to analyze the data are regression and
 correlation.

 A. Regression

 = + + , where:

 Y = close value (dependent variable)
 X = open value (independent variable)

 ( − ) ( − )
 b= ( − )2

 = −

 ∈ = residual (error)

 B. Correlation

 ( − ) ( − )
 r=
 ( − )2 ( − )2

 Correlation coefficient and p value have been calculated for the following sets of variables-

1. High value and shares traded
2. Low value and shares traded

 VI. REVIEW OF LITERATURE

 Gunaseelan, S &Kesavan, N., April 2020, suggest that an economic recession may be rebuilt in 2021-22. They explore the
 impact of COVID-19 on international trade; the inconsistency of the gold market during COVID-19; stock market during
 COVID-19; industrial progress during COVID-19; the service sector of the economy and its impact on business recession
 during the COVID-19; and agricultural produces and the role of social quarantine. The social distancing and quarantine of
 people and the efforts of the departments are helping to succeed the stringent situations. The authors have requested the
 government to improve the national income. [1]

 Sankararaman, G., Suresh, S., Thomas, T.C. &Vishnupriya, April 2019, study the share market unpredictability
 performance between the Nifty index and Sector index i.e. Nifty FMCG, Nifty Bank, Nifty IT, and Nifty Financial Services.
 They study the stock performance of NSE during the year 2015-2018 to know the performance of stock during the budget
 period and the growth level of stock after volatility. They conclude that the estimation of the return of various instructions
 is not sufficient in making economic decisions. To increase the market depth, the information about the markets should be
 permitted to surge unimpeded and nonaggressive trading on a plethora of securities. [2]

 Santhi, V., Ojha, P &Preetha, S., March 2017, highlight the seventeen companies showing fluctuating trends in the stock
 market for a period of six months. They also suggest the investors make a wise decision before investing in stock markets.
 They support the motto in the stock market from the investor's point of view i.e. "Buy when the prices of the scripts are low,
 and sell when the prices of the scripts are high". They conclude that investors should be very careful before making
Volume XII, Issue VIII, August/2020 Page No:1139
Journal of Interdisciplinary Cycle Research ISSN NO: 0022-1945
 investments in stocks. It is better to go for a portfolio i.e., investment in a combination of securities is the most preferable
 option. [3]

 Pushpalatha, M., Srinivasan, J. &Shanmugapriya, G., October 2019, determine the share price movements and its volatility
 of the selected ten companies of the financial service sector, which are in nifty fifty companies list. It is noted that Nifty
 and NSE Nifty and Nifty fifty Selected Companies of Financial Service Sector were not normally distributed. It is found
 that the return series of the selected Nifty and Nifty fifty selected companies of the financial service sector is not
 homogenous during the study period. Their results showed that during the period, the Indian stock market followed a
 random walk which means the market is weak-form efficient and investors can take benefit based on past information. It is
 suggested that the companies should take necessary steps to maintain its financial health and increase the market share in
 India. [4]

 VII. DATA ANALYSIS

 In the following graph (Fig. 1), we can see the historic prices of the chosen stocks over a period of 6 months i.e. from
 December 2019 (when the first case of COVID-19 was reported in Wuhan, China) until May 2020. It can be conclusively
 observed that the stocks under study had been performing quite well and reported few or no major price fluctuations during
 the pre- COVID-19 time. All major fluctuations are clustered around the time of the outbreak of the pandemic and the
 subsequent imposition of a nation-wide lockdown.

 FIG. 1- TRENDS IN THE STOCK PRICES OF THE CHOSEN STOCKS (6 DECEMBER 2019- 6 MAY 2020)

 The next graphs show a more recent price history that ranges from February 2020 (the time around which the coronavirus
 began spreading in India) until May 2020. It can be clearly observed that all of the stocks dipped towards the end of March,
 a time when the lockdown was imposed for the first time in the country. However, all the 3 stocks under study started
 regaining their prices around mid-April. In fact, Avenue Supermarts Ltd. and Britannia Industries Ltd.reached their highest
 2 month stock prices during that time (as can be observed from Table 1 and Fig. 2).

Volume XII, Issue VIII, August/2020 Page No:1140
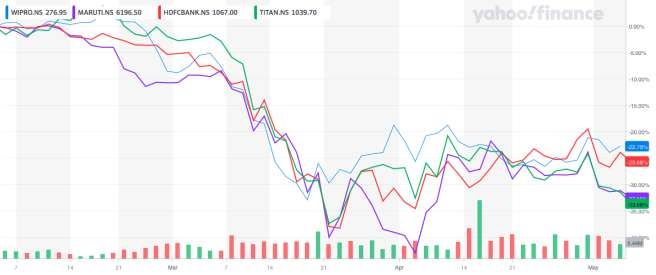
Journal of Interdisciplinary Cycle Research ISSN NO: 0022-1945

 FIG. 2- ASIAN PAINTS LTD. PRICE HISTORY (6TH FEBRUARY 2020- 6TH MAY 2020)

 FIG. 3- AVENUE SUPERMARTS LTD. PRICE HISTORY (6TH FEBRUARY 2020- 6TH MAY 2020)

 FIG. 4- BRITANNIA INDUSTRIES LTD. PRICE HISTORY (6TH FEBRUARY 2020- 6TH MAY 2020)

 TABLE V
 HIGHEST AND LOWEST PRICES OF THE CHOSEN STOCKS (MARCH 2020- MAY 2020)

 Asian Paints Ltd. Avenue Supermarts Britannia Industries
 Ltd. Ltd.
 HIGH LO HIGH LOW HIGH LOW
 W
 P 1,915.9 143 2,389. 1,729. 3289.8 2100.0
 RI 0 1.20 75 30 5 0
 C
 E
 D 09-Mar 19- 30-Apr 24- 28- 23-
 A Mar Mar Apr Mar
 T
 E

 Fig. 3 shows the performance of 4 other prominent blue-chip stocks of the National Stock Exchange (NSE) i.e. Wipro Ltd.,
 Maruti Suzuki India Ltd., HDFC Banks Ltd., and Titan Company Ltd. It can be seen that, like the prices of the 3 stocks
 under study, the prices of these stocks have also dipped tremendously around late March. But the fact worth underscoring
 here is that although the chosen blue chips have managed to regain their pre-COVID-19 prices, others such as the ones
 shown below have failed to do so.

Volume XII, Issue VIII, August/2020 Page No:1141
Journal of Interdisciplinary Cycle Research ISSN NO: 0022-1945

 FIG. 5- TRENDS IN THE STOCK PRICES OF SOME OTHER BLUE-CHIP STOCKS (MARCH 2020- MAY 2020)

 VIII. ANALYSIS

 A. Hypothesis 1

 Null Hypothesis(H0): “There is no correlation between the means of open value and close value of the stock exchange.”

 Alternative Hypothesis(H1):“There is a correlation between the means of open value and close value of the stock exchange.”

 TABLE VI
 ANALYSIS OF VARIATION (ANOVA) MODEL SUMMARY

 Dependent Independent R R p
 Square value*
 Close Open Value 0.957 0.915 0.000
 Value
 *at 0.05 level of significance

 Since the p value is 0.000, which is a value less than 0.05, we reject the null hypothesis and accept the alternative
 hypothesis- that there is a correlation between the means of open value and close value of the stock exchange.

 Taking close value as the dependent variable and open value as the independent variable, the R square stands at 0.91,
 which shows approximately 90% of variation in close value being dependent on open value.

 B. Hypothesis 2

 Null Hypothesis(H0): “There is no correlation between the high value and shares traded of the stock exchange.”

 Alternative Hypothesis(H1):“There is a correlation between the high value and shares traded of the stock exchange.”

 TABLE VII
 CORRELATIONS

 Variable 1 Variable 2 Correlation p value *
 coefficient
 High value Traded 0.464 0.002
 *at 0.05 level of significance

Volume XII, Issue VIII, August/2020 Page No:1142
Journal of Interdisciplinary Cycle Research ISSN NO: 0022-1945

 Since the p value is 0.002, which is a value less than 0.05, we reject the null hypothesis and accept the alternative
 hypothesis- that there is a correlation between the high value and shares traded.

 The correlation stands at 0.464, which is approximately 50%.

 C. Hypothesis 3

 Null Hypothesis(H0): “There is no correlation between the low value and shares traded of the stock exchange.”

 Alternative Hypothesis(H1):“There is a correlation between the low value and shares traded of the stock exchange.”

 TABLE VIII
 CORRELATIONS

 Variable 1 Variable 2 Correlation p value *
 coefficient
 Low value Traded 0.319 0.037
 *at 0.05 level of significance

 Since the p value is 0.037, which is a value less than 0.05, we reject the null hypothesis and accept the alternative
 hypothesis- that there is a correlation between the low value and shares traded.

 The correlation stands at 0.319, which is approximately 30%.

 IX. CAUSES OF THE CONSISTENCY

 As it can be observed from Figure 2, on 6 th May 2020, the prices of the stocks under study were more or less similar to the
 prices in November or December (the months that we can consider free of the pandemic’s impact). It is also evident that
 there haven’t been any major price fluctuations during the COVID-19 period. Therefore, these blue-chip stocks, i.e. Asian
 Paints Ltd, Avenue Supermarts Ltd., and Britannia Industries Ltd., can be deemed consistent during the pandemic. This
 consistency has occurred due to numerous factors, some of which are as follows-

 A. Causes Of Consistency In The Essential Products Industry

 In this section, the reasons behind the consistency of the following 2 stocks are discussed-

1. Avenue Supermarts Ltd.
2. Britannia Industries Ltd.

 Due to the disruption of China’s food supply chain earlier this year, there has been a major spike in demand for essential
 commodities such as rice, wheat, and pulses from India. According to The Trade Promotion Council of India (TPCI), other
 food categories like- confectioneries, sweets, organic processed food, and spices have also witnessed 15-20% rises. This
 demand has been coming majorly from the US, Europe, Australia, New Zealand, Israel, Palestine, and Egypt. [6]

 The food processing industry is clearly in the centre of what we call the essential goods and services. Taking this into
 account, numerous notifications have been issued by the ministry of food processing, Department for Promotion of
 Industry and Internal Trade (DPIIT), the ministry of home affairs and by different entities to construct the lockdown and
 facilitate the movements of raw materials, finished products, and of people as best as can be. [8] These measures include
 the exemption of food and food processing industries from the nationwide lockdown imposed in India since 25 th March
 2020. Due to these reasons, a majority of the food industries in India (manufacturing and processing foodstuffs, including
 edible oilseeds and oils) have continued to operate in a pre-coronavirus manner. As of now, disruptions are minimal as
 food supply has been adequate and markets have remained stable so far. The lockdown exemption also included shops,
 ration shops, which are dealing in food, groceries, fruits, and vegetables, and other food products as essential commodities.

 B. Causes Of Consistency In Asian Paints Ltd.’s Stock Prices

 Although Asian Paints Ltd. does not fall into the category of defensive and staple businesses like the Fast Moving
 Consumer Goods (FMCG) line, it has much potential for an exponential recovery in the post coronavirus economy.

Volume XII, Issue VIII, August/2020 Page No:1143
Journal of Interdisciplinary Cycle Research ISSN NO: 0022-1945

 Moreover, Asian Paints has an immensely strong ability to withstand the coronavirus shock owing to its leadership, strong
 balance sheet with a cash-surplus position, a higher share of variable costs, strong brand recall, and its pricing power.

 Although the company has shut all the manufacturing operations amid the COVID-19 lockdown in India, it is believed that
 its effective distribution network, strong inventory management, etc, will help it sail through this tough time. Also, lower
 input costs due to the correction of crude oil prices are likely to benefit the paint industry. Paint demand in the country is
 expected to recover from Diwali (November 2020), although some experts believe demand will see faster growth from
 December 2020. [9]
 X. CONCLUSION

 Although the Indian stock market has been hard hit by the ongoing pandemic, the impact is not uniform. We can observe a
 sector-wise diversity in the impact i.e. some sectors have suffered more than others. Results of the study show that
 approximately 90% variation in close value is dependent on the open value. There is a 50% correlation between the high
 value and shares traded of the stock exchange, and a 30% correlation between the low value and shares traded of the stock
 exchange. The stocks under study have been identified as the most consistent ones during the outbreak. The ‘essential
 industry’ status has shielded the players, viz. Avenue Supermarts Ltd, and Britannia Industries Ltd. It is noteworthy that
 Asian Paints, despite being a part of the non-essential industry, has maintained its consistency due to its strong financial
 and managerial position. Considering the above factors and the effects of COVID-19, although many companies are facing
 huge losses, these three companies have managed to maintain their blue-chips and are likely to be helpful for the recovery
 of the economy when things get to normal. Based on these results, it may be reasonably concluded that any smart investor
 or fund manager can benefit even during adverse circumstances such as theCOVID-19 situation and the consequent
 lockdown. It must be noted that this study is based during a pandemic which led to a global medical emergency and its
 findings might not be applicable in other circumstances.

 REFERENCES

[1] Gunaseelan, S &Kesavan, N.,(2020), Business and economic recessions in India during the COVID-19-A review, Journal of Xi'an University of
 Architecture & Technology, XII. 356-366. 10.37896/JXAT12.04/781.
[2] Sankararaman, G., Suresh, S., Thomas, T.C. &Vishnupriya (2019), A study on volatility in stock market (NSE) based on select sectoral indices during
 union budget period of India, International Journal of Recent Technology and Engineering, Vol. 7 Issue 6S5, April 2019, pp. 1205-1211.
[3] Santhi, V., Ojha, P &Preetha, S. (2017), A transitory map of stock market volatility in India, International Journal of Research in Finance and Marketing,
 Vol. 7 Issue 3, March 2017, pp. 25-33.
[4] Pushpalatha, M., Srinivasan, J. &Shanmugapriya, G. (2019), A research on volatility in the Indian stock market with special reference to nifty and
 selected companies of financial service sector of NSE, International Journal of Innovative Technology and Exploring Engineering, Volume-8 Issue-12S,
 October 2019, pp. 541-544.
[5] Ram, A.R. (2020), Covid-19 impact on stock market, Outlook Money, Retrieved from
 https://www.outlookindia.com/outlookmoney/equity/covid-19-impact-on-stock-market-4666
[6] Suneja, K. (2020), Huge demand for food products in global markets due to COVID-19 outbreak, India can tap it: TPCI, The Economic Times, Retrieved
 from
 https://economictimes.indiatimes.com/news/economy/foreign-trade/huge-demand-for-food-products-in-global-markets-due-to-covid-19-outbreak-india-
 can-tap-it-tpci/articleshow/74775766.cms?from=mdr
[7] Chen, J. (2019), Blue-chip stock, Investopedia, Retrieved from
 https://www.investopedia.com/terms/b/bluechipstock.asp
[8] ET Now (2020), Food processing industry not facing any paucity of men or material: Suresh Narayanan, The Economic Times, Retrieved from
 https://economictimes.indiatimes.com/markets/expert-view/food-processing-industry-not-facing-any-paucity-of-men-or-material-suresh-
 narayanan/articleshow/75135016.cms
[9] Aute, S.S. (2020), Analysts see Asian Paints gaining market share once demand recovers, Business Standard, Retrieved from
 https://www.business-standard.com/article/companies/analysts-see-asian-paints-gaining-market-share-once-demand-recovers-120040101311_1.html

Volume XII, Issue VIII, August/2020 Page No:1144
You can also read