HAKE - GSA 7 Reference Year: 1998 - 2017 Reporting Year: 2018 - Stock Assessment Form
←
→
Page content transcription
If your browser does not render page correctly, please read the page content below
Stock Assessment Form
     Demersal Species

      HAKE – GSA 7

Reference Year: 1998 – 2017
Reporting Year: 2018

             1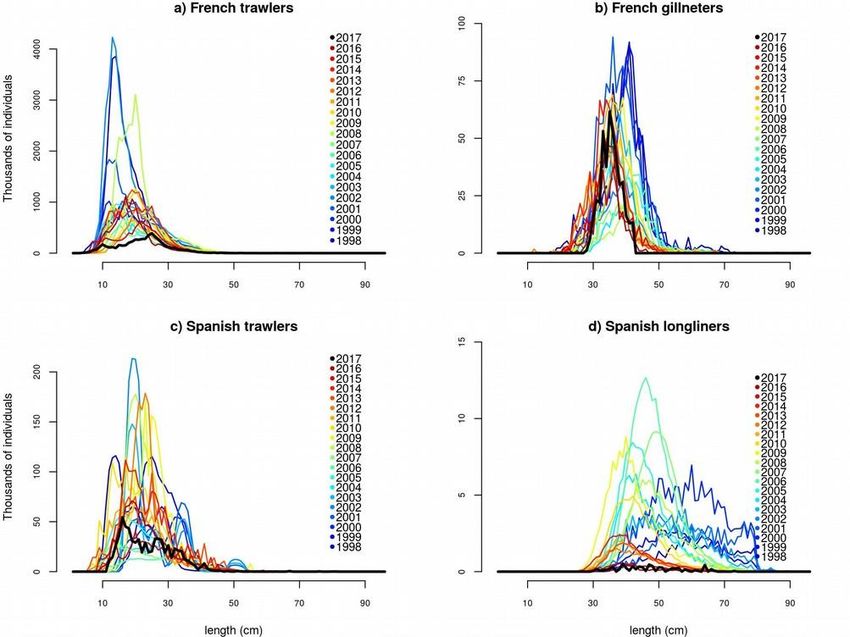
Stock Assessment Form version 1.0 (November 2018)
        Uploader: Grégoire Certain*, Angélique Jadaud*, Beatriz Guijarro**, Norbert Billet*, Enric
Massutí*
        * IFREMER, 1 rue Jean Monnet, BP 171, 34203 Sète (France); **IEO- Centre Oceanogràfic de les
Balears; Moll de Ponent s/n; 07015 Palma de Mallorca (Spain)

      1    Basic Identification Data ................................................................................................. 3
      2    Stock Identification and biological information ................................................................ 4
          2.1Stock unit........................................................................................................................... 4
          2.2 Growth and maturity ......................................................................................................... 4
      3    Fisheries Information ...................................................................................................... 7
          3.1 Description of the fleet ...................................................................................................... 7
      4    Management Regulations ............................................................................................. 11
          4.1 French trawlers ............................................................................................................... 11
               4.1.1 Temporal bans depending on years……………………………………………….11
              4.1.2 Biological ban .................................................................................................. 11
          4.2 Spanish trawlers ............................................................................................................. 11
      5    Fisheries independent information ................................................................................ 13
          5.1.1 Brief description of the direct method used ................................................................. 13
          5.1.2 Spatio-temporal distribution of Hake – GSA 7 ............................................................. 13
      6    Ecological information .................................................................................................. 16
      7    Stock assessment ........................................................................................................ 17
          7.1 XSA ................................................................................................................................ 17
           7.1.1 Model assumptions............................................................................................ 17
           7.1.2 Scripts ............................................................................................................... 17
           7.1.3 Input data and parameters ................................................................................ 17
           7.1.4 Results .............................................................................................................. 19
           7.1.5 Sensitivity analysis ............................................................................................ 23
           7.1.6 Retrospective analysis ....................................................................................... 29
      8 STOCK PREDICTIONS ................................................................................................ 30
        8.1 Short-term predictions 2018-2020 .................................................................................. 30
          8.2 Multi-fleet short-term predictions .................................................................................... 31
          8.3 Long-term predictions ..................................................................................................... 31
      9    Draft Scientific Advice ................................................................................................... 32
          9.1 Management advice and recommendations: Reduce fishing mortality .......................... 33
      10 Explanation of codes .................................................................................................... 34
        10.1 Trend categories .......................................................................................................... 34
          10.2 Stock Status ................................................................................................................. 34
            10.2.1 Based on Fishing mortality related indicators ................................................ 34
            10.2.2 Based on Stock related indicators ................................................................. 34
      11 Literature cited .............................................................................................................. 36

                                                                            2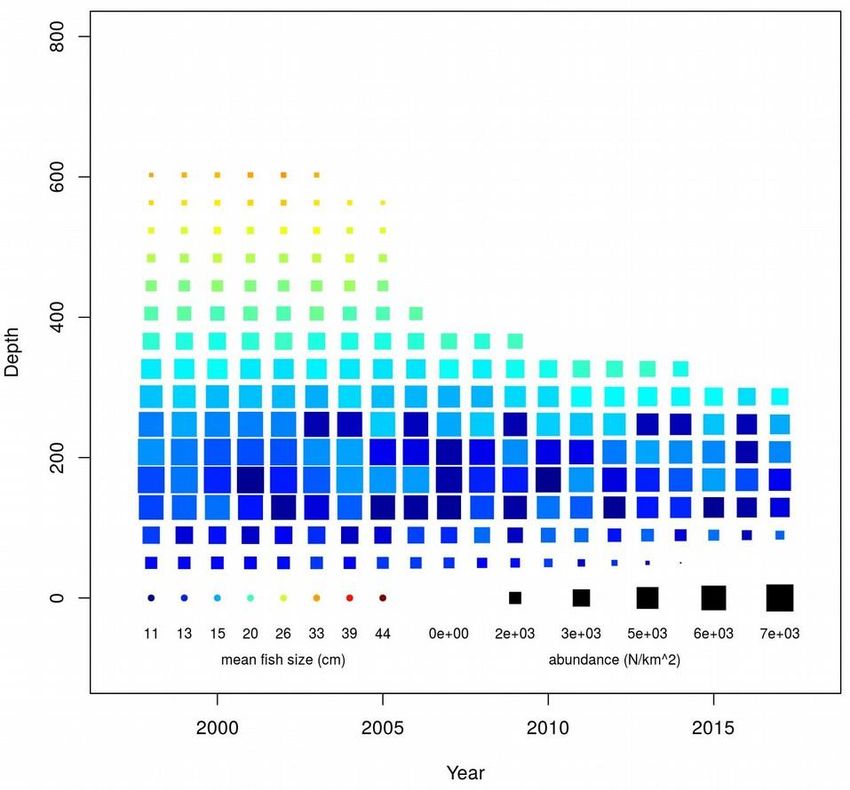
1 Basic Identification Data
Table 1: Stock assessment meta-data

         The ISSCAAP code is assigned according to the FAO 'International Standard Statistical
Classification for Aquatic Animals and Plants' (ISSCAAP) which divides commercial species into 50 groups
on the basis of their taxonomic, ecological and economic characteristics. This can be provided by the GFCM
secretariat if needed. A list of groups can be found here:
         http://www.fao.org/fishery/collection/asfis/en
         Direct methods (you can choose more than one):
         Acoustics survey
         Egg production survey
         Trawl survey
         SURBA
         Other (please specify)
         Indirect method (you can choose more than one):
         XSA
         A4a

                                                       3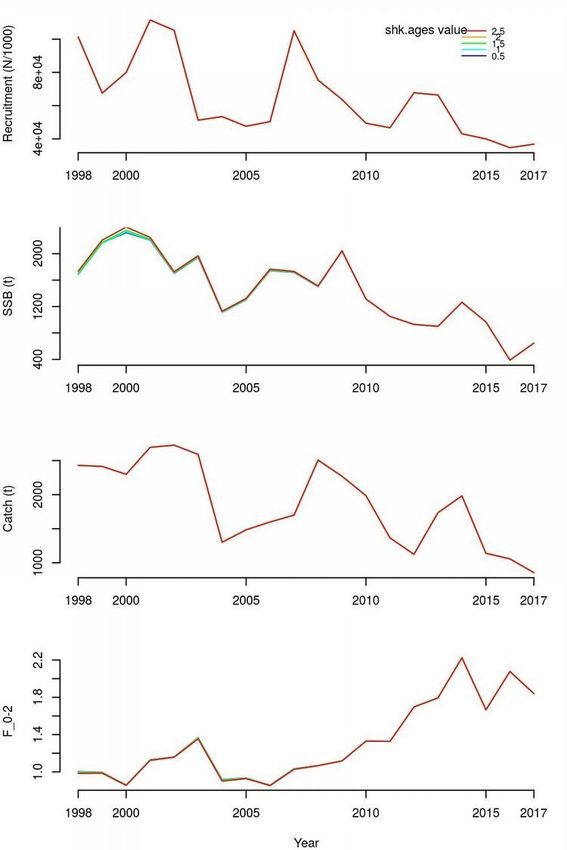
2 Stock Identification and biological information
2.1 Stock unit
Hake (Merluccius merluccius) in the Gulf of Lions (GSA 7) is a shared stock exploited by both
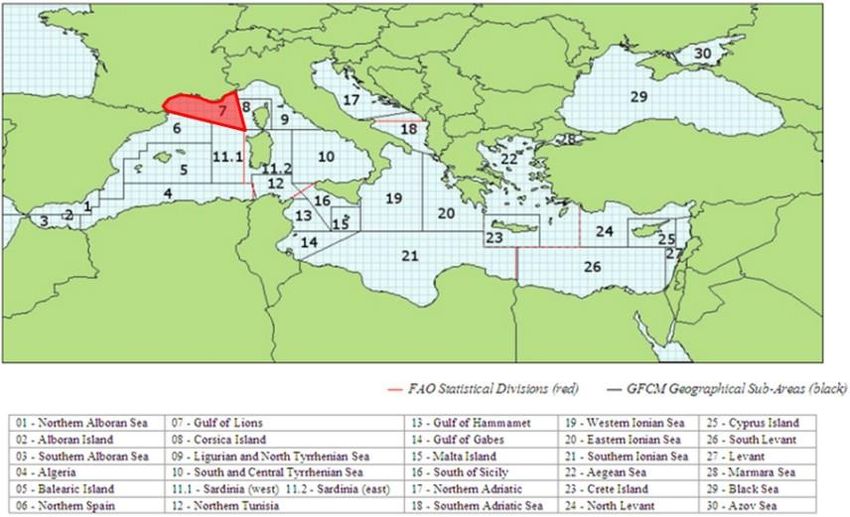
Spanish and French trawlers, French gillnetters and Spanish longliners (Figure 1). The Gulf of Lions (GSA
7) is used as an individualized area for the assessment and management of red mullet in the western
Mediterranean. However, recent studies stated that the hake of the Gulf of Lions might be connected to
concomitant areas, for instance from the GSAs 05 and 06.
Figure 1: Geographical location of GSA 7 - Gulf of Lions
2.2 Growth and maturity
The growth of European Hake (Merluccius merluccius) in the Gulf of Lions was re-estimated from
tagging experiments carried out by IFREMER (Mellon-Duval et al. 2010). The new parameters have not
been yet compared to a re-analysis of otoliths readings. Therefore, the data sent to the data call were in
length and were converted in age using the length-to-age slicing functions available in R. The growth
parameters used are indicated in the table 2.3. The maturity (Table 4) was calculated using data collected in
GSA 7 over the period 2004-2017 by IFREMER within the DCF (since 2002), using inbio for 2004-2012 and
COST tools for 2013-2017. Natural mortality estimate (Table 6) was obtained from the PRODBIOM model
(Abella et al. 1998).
4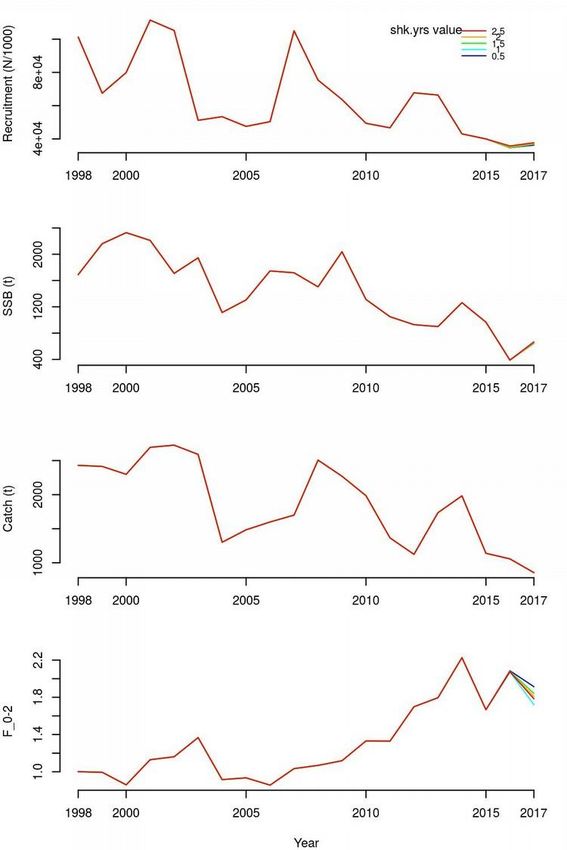
Table 2: Maximum size, size at first maturity and recruitment

         Table 3: Growth and Length-Weight parameters

                     Table 4: Maturity at age (both sexes)

                                                                5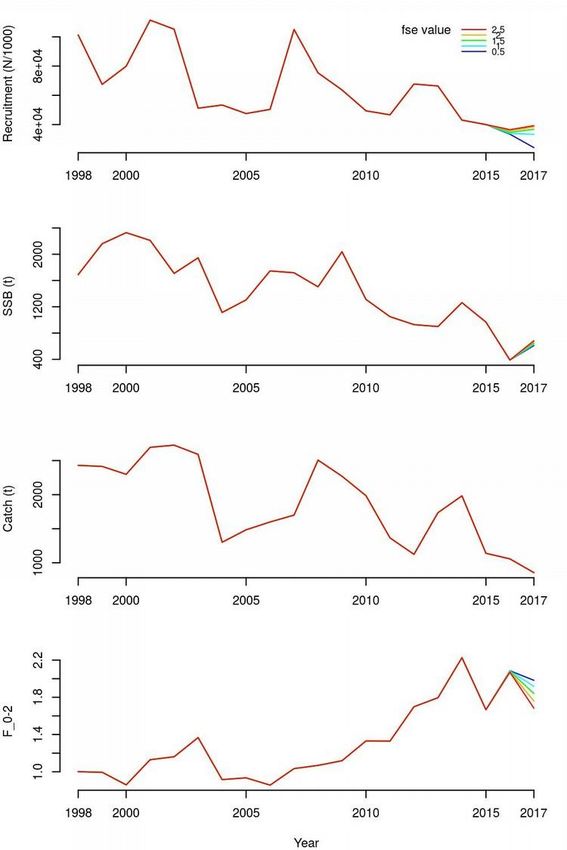
Table 5: Sex-ratio at length

                               Table 6: Hake Natural mortality at age estimated by
                               Prodbiom model.

                                                                6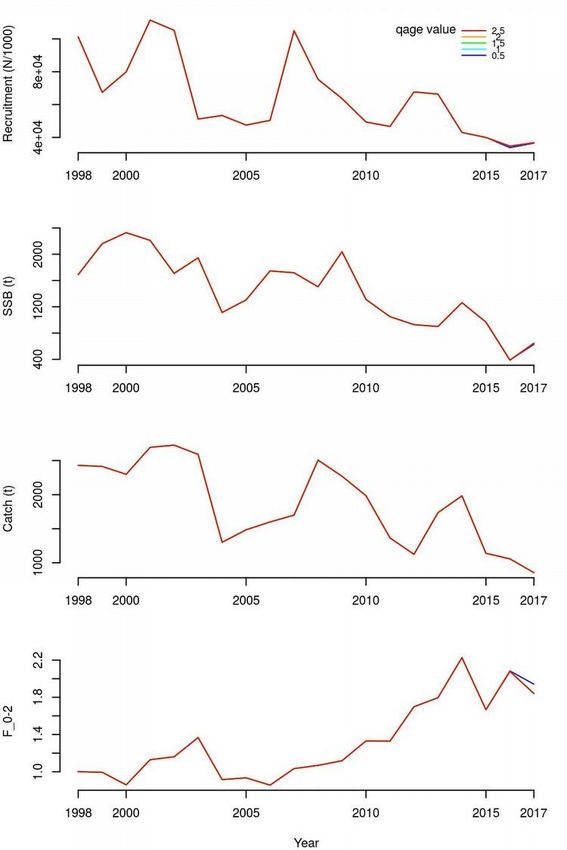
3 Fisheries Information

3.1 Description of the fleet
         Hake is one of the most important demersal target species for the commercial fisheries in the Gulf of
Lions (GSA 7). In this area, hake is exploited by French trawlers, French gillnetters, Spanish trawlers and
Spanish longliners. An average of 241 boats are involved in this fishery and, according to official statistics,
the total annual catches for the period 1998-2017 have oscillated around an average value of 1862 tons (855
tons in 2017). French trawlers are harvesting the major part of the catch (72% on average since 1998),
targeting hake ranging from 3 and 92 cm total length (TL), with an average size of 21 cm TL. Since 2002,
the size of that fleet has decreased. This decrease has been further accentuated by the small pelagic crisis in
2009, when the french trawlers fishing small pelagic fish have re-directed their effort on the demersal
species, resulting in an over-capacity situation. The second most important fleet is the french gillnetters (14%
of the catch, range 13-86 cm TL and average size 39 cm TL), followed by the spanish trawlers (9,5% of the
catch, range 5-88 cm TL and average size 24 cm TL), and the spanish longliners (4,5% of the catch, range
22-96 cm TL and average size 50 cm TL).
          In addition to Hake, the trawlers exploit a highly diversified species assemblage including (but not
restricted to) striped red mullet (Mullus surmuletus), red mullet (M. barbatus), angler fish (L. piscatorius),
blackbellied angler fish (L. budegassa), european conger (Conger conger), poor-cod (Trisopterus minutus
capelanus), fourspotted megrim (Lepidorhombus boscii), soles (Solea spp.), horned octopus (Eledone
cirrhosa), squids (Illex coindetii), gilthead seabream (Sparus aurata), European seabass (Dicentrarchus
labrax), seabreams (Pagellus spp.), blue whiting (Micromesistius poutassou), tub gurnard (Chelidonichtys
lucerna).

  Table 7: Description of operational units exploiting the stock.

                                                               7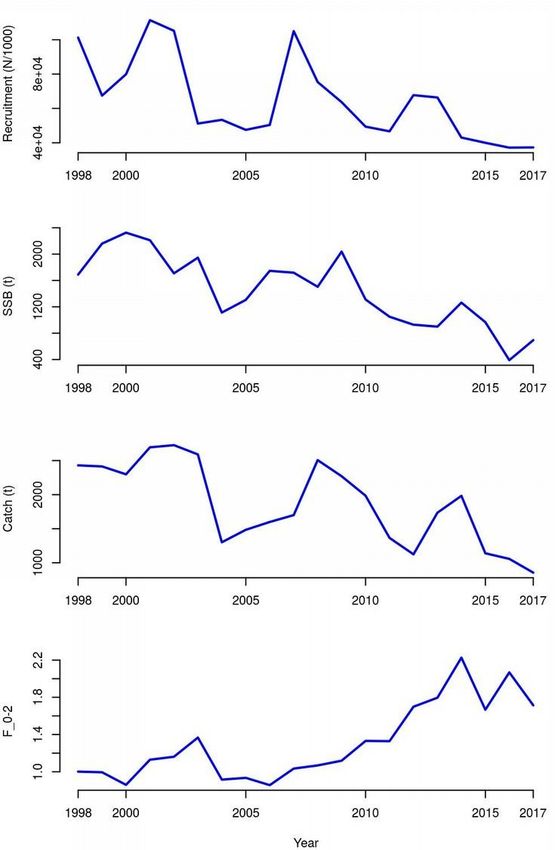
Table 8: Description of operational units exploiting the stock

                             Table 9: Historical landings per fleet

                                                                 8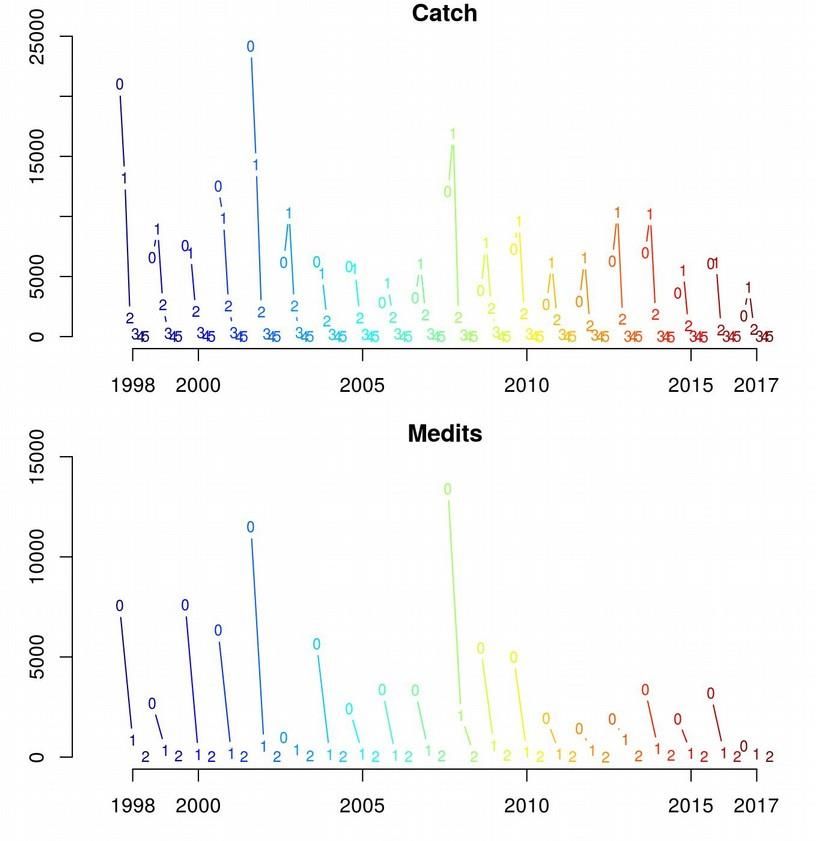
Table 10: Historical discards per fleet

Table 11: Historical catches per fleet

                                    9
Figure 2: Barplots of hake catch per fleet - GSA 7

Figure 3: Length distribution of the catch per year and fleet - Hake in GSA 7

                                                               10
4 Management Regulations
4.1 French trawlers
• Fishing license: fully observed
• Engine power limited to 316 KW or 500 CV: Not full compliance
• Cod-end mesh size (bottom trawl: square 40 mm or 50 mm diamond. by derogation): not fully
observed
• Fishing forbidden within 3 miles (France): not fully observed
• Time at sea: fully observed
4.1.1 Temporal bans depending on years
• 2011 and 2012. 1 month/year
• 2016 and 2017: 25 days/trawler between 17 April and 16 July
4.1.2 Biological ban
4.1.2.1 2017 : 13 march - 14 april
4.2 Spanish trawlers
• Fishing license: fully observed
• Engine power limited to 316 KW or 500 CV: Not full compliance
• Mesh size in the codend (before Jun 1st 2010: 40 mm diamond: after Jun 1st 2010: 40 mm square or
50 mm diamond. by derogation): fully observed
• Fishing forbidden4.6 Additional Spanish and French national measures
They have been endorsed to focus on the protection of demersal resources such as hake. Some
additional spanish national measures are in discussion considering the protection of spawning period and
zone. Furthermore, France and Spain agreed upon the following measures:
• Temporal annual spatio-temporal closure considering longliners, bottom trawlers and gillnetters,
between 12th of October and 12th of December and between 150 and 275 meters in the zone defined
following these coordinates:
Latitude Longitude
42°26’ N 3°9’ E
43° N 3°2’ E
43° N 5° E
42°0,71’ N 5° E
• Permanent closure in 3 zones defined with the following geographical coordinates:
Area 1
Latitude Longitude
42°45,300’ N 3°37,050’ E
42°45,300’ N 3°41,086’ E
42°41,268’ N 3°41,086’ E
42°41,268’ N 3°37,050’ E
Area 2
Latitude Longitude
42°52,95’ N 4°2,95’ E
42°52,95’ N 4°7,32’ E
42°48,9’ N 4°7,32’ E
42°48,9’ N 4°2,95’ E
Area 3
Latitude Longitude
43° N 4°49,35’ E
43° N 4°53,7’ E
42°55,896’ N 4°53,7’ E
42°55,896’ N 4°49,35’ E
In addition, the Multiannual Management plan for western Mediterranean region is still in
discussions.
4.7 Reference points
Table 12: Previously agreed reference points for Hake - GSA7
125 Fisheries independent information
5.1 MEDITS
5.1.1 Brief description of the direct method used
Fishery independent information regarding the state of the hake in GSA 7 was derived from the
international survey MEDITS. MEDITS surveys have been carried out from late spring to middle summer,
between 1994 and 2017, following random depth-stratified sampling design. Five depth strata were
considered: 10-50 m. 51-100 m. 101-200 m. 201-500 m and 501-800 m. The gear used was a GOC 73. an
experimental bottom trawl gear, with a cod-end mesh size of 20 mm. Sampling duration depended on the
depth of the sampling station: 30 minutes for the samples on the shelf (10-199 m) and 60 minutes for those in
the slope (200-800 m). See (Bertrand et al. 2002) for further details.
The data was assigned to strata based upon the shooting position and average depth (between
shooting and hauling depth). Catches by haul were standardized to 60 minutes hauling duration. The
abundance and biomass indices by GSA were calculated through stratified means (Cochran. 1953; Saville.
1977). This involves weighting the average values of the individual standardized catches and the variation of
each stratum by the respective stratum areas in each GSA:
(Equation 6.1)
(Equation 6.2)
In which A refers to the total survey area, S the number of stratum, σi is the standard deviation for the
i stratum, ni the number of valid hauls in the ith stratum, Yi the mean abundance in the ith stratum, Yst the
th
stratified mean abundance, and Var(Yst) its associated variance.
The 95% confidence interval around Yst is then computed using a stratified bootstrap procedure
(100) among the valid hauls.
5.1.2 Spatio-temporal distribution of Hake – GSA 7
MEDITS campaign can be considered as a good sampler for mapping the juvenile distribution of
hake. as it is carried out in May-June, following recruitment occurring from January to April (Ferrer-Maza et
al. 2014). As the survey is repeated annually, it does not allow exploring possible seasonal variations. The
MEDITS index is usually considered as only partially representative of the spawner population, mostly
because large hake spawners may be unavailable to the survey if they are located into untrawlable areas such
as irregular slopes on the shelf break.
Figure 4 displays the time series of abundance in GSA 7. The estimated abundance indices has a
clear decreasing trend. Higher peaks have been observed for some years, linked to the highest recruitment
observed over the period (1998, 2002 and 2008). Since 2010 however, MEDITS abundances are at their
lowest since the beginning of the time series. Not only abundances have decreased through year, but also size
distribution, as shown in Figure 5 : the size distribution of Hake in the Medits surveys has clearly flatten out
across the years. Figure 6 summarizes the changes in the Hake population that have been observed by
MEDITS survey. Up to 2006-2008, larger individuals couls still be observed on MEDITS in significant
abundances in the deeper areas of the continental shelf. Since then, these individuals have completely
disappeared from the survey, and the area of distribution of hake has constantly been reduced at both high
and low depth.
13Figure 4: Medits abundance index for Hake - GSA 7
Figure 5: Length Distribution of Hake in Medits Survey since 1998
Figure 6: Change in the spatio-temporal abundance of Hake in GSA - 7 obtained from the MEDITS survey. x-axis
shows time (years), y-axis shows depth (in m), symbols size is proportional to abundance and symbols colors
represents fish mean size.
1415
6 Ecological information
6.1 Protected species potentially affected by the fisheries
     No list of protected species that can be potentially affected by the fishery is currently available.

6.2 Environmental indexes
     There is currently no evidence for any environmental index to be relevant for the fishery.

                                                        16
7 Stock assessment
7.1 XSA
7.1.1 Model assumptions
The stock assessment was performed over the period 1998-2017 using an XSA model over age
classes ranging from 0 to 5+ and with MEDITS index, as tuning fleet (ages 0-2), and forms the basis for the
stock assessment.
7.1.2 Scripts
The Rscript and data used to perform the stock assessment have been provided to the GFCM
7.1.3 Input data and parameters
Figure 7: Time series of catch and medits index at age and year
17Table 13: Catch at age used for the stock assessment of Hake in GSA 7. Thousands of
individuals.
Table 14: Weight at age used for the stock assessment of Hake in GSA 7. Kg.
18Table 15: Medits index at age used for stock
assessment of Hake in GSA 7.
7.1.4 Results
After performing a sensitivity analysis, the same settings as last year were finally chosen for XSA
model. The log-residuals of MEDITS survey were found very low and without any strong trend.
Figure 8: Log-residuals for MEDITS survey (XSA assessment, Hake GSA 7)
Figure 9: Results of the stock assessment performed for Hake in GSA 7 (XSA). Rec
(recruitment) in thousands of individuals; SSB (spawning stock biomass) and catch in
tons, F (fishing mortality).
19Figure 10: XSA estimate of total stock biomass through time. 66th and 33rd quantiles are
shown by dashed green and thick red lines, respectively.
20Table 16: Fishing mortality at age for Hake (GSA 7) estimated by XSA
21Table 17: Total stock at age (thousands) for Hake (GSA 7) estimated by XSA
Table 18: XSA summary for Hake in GSA 7:
Spawning Stock Biomass (in tons); Fishing
mortality at age 0-2; Recruitment (in thousands)
227.1.5 Sensitivity analysis
The selection of the suitable parameters for the final XSA run was performed running four sensitivity
analysis. The resulting time series SSB, fishing mortality and recruitment were plotted. The first sensitivity
analysis (Figure 11) was conducted using 5 different shrinkage weight assumptions (i.e. fse 0.5. 1. 1.5. 2 and
2.5), leading to a choice of 1,5. The second analysis ( Figure 12) was conducted to assess the effect of
shrinkage on the last ages (i.e. ranging from 1 to 5), leading to a choice of 2. The third analysis ( Figure 13)
was conducted to assess the effect of shrinkage on the years (i.e. ranging from 1 to 5), leading to a choice of
3. The fourth analysis (Figure 14) was conducted to assess the effect of the age after which catchability is no
longer estimated (i.e. qage assigning values ranging from 0 to 5). The final setting selected (5) represents a
constant catchability for all ages.
Figure 11: Sensitivity analysis on fse
25Figure 12: Sensitivity analysis on shk.ages
26Figure 13: Sensitivity analysis on shk.yrs
27Figure 14: Sensitivity analysis on qage
287.1.6 Retrospective analysis
A retrospective analysis was conducted on recruitment, mean F and SSB (Figure 6.1.7.2.1) to ensure
the robustness of the final estimates.
298 STOCK PREDICTIONS
8.1 Short-term predictions 2018-2020
A deterministic short term prediction for the period 2018 to 2020 was performed using the FLR
routines (http://www.flr-project.org) by JRC and based on the results of the XSA stock assessments.
The input parameters were the same used for the XSA stock assessment and its results. An average
of the last three years has been used for weight at age, maturity at age and F at age, Recruitment (age 0) has
been estimated from the population results as geometric mean of the last 3 years. For the short-term forecast.
all the fleets (Spanish and French bottom trawlers, Spanish longliners, French gillnetters) were combined.
Table 19: Parameters used for the short-term forecast (Hake, GSA 7)
Table 20: Short-term forecast in different F scenarios (Hake, GSA 7)
Fishing at the Fstq (1.81) generates an increase in catch by 38.5% from 2017 to 2019 along with a
decrease in the spawning stock biomass of 2.7% from 2020 to 2019.
Fishing at FMSY (0.12) generates a decrease in catch by 82 % from 2017 to 2019 and a spawning
stock biomass increase by 179% from 2019 to 2020.
30Catches of hake in 2019 consistent with FMSY would not exceed 155 tons.
8.2 Multi-fleet short-term predictions
The results of the short-term forecast have been ventilated across fleets for the scenario in which
fishing is carried out at F0.1.
Table 21: Results of the multi-fleet short-term
forecast at F0,1
8.3 Long-term predictions
Yield per recruit analysis was used (FLBRP) to calculate the reference point (F0.1 as a proxy of
FMSY) and the estimated reference fishing mortality (Fcurrent). The same population parameters used for
the XSA model and exploitation pattern derived from the final model were used as input for the yield per
recruit analysis. These methods were applied using the FLR libraries in the statistical software R. Note that
F0.1, previously estimated at 0.15, has been reduced to 0.12 this year.
2.
Table 22: Reference Points For Hake in GSA7
319 Draft Scientific Advice
Table 23: Advice summary for Hake in GSA 7
This stock is in a high overfishing status with a relative low biomass. Both catches and the Medits
abundance index observed for the french trawler fleet in 2017 are at their lowest since 1998. Peri odically,
higher recruitments have been observed (1998, 2001-2002 and 2007), however, the recruitment has followed
a decreasing trend since then and is currently at a very low level, while fishing mortality has steadily
increased up to now, reaching very high and probably unsustainable levels. Moreover, spawning stock
biomass (SSB) displays a decreasing trend over the analyzed period and is at very low level at the moment
without strong sign of improvement. The exploitation level today is largely above the level estimated to be
sustainable. The reference point F0.1 (0.12), chosen as proxy of FMSY and as the exploitation reference point
consistent with high long term yields is highly lower than current fishing mortality (F curr=1.81). The
exploitation is mainly concentrated on young individuals.
329.1 Management advice and recommendations: Reduce fishing mortality
The current exploitation level is well above the level estimated to be sustainable. The French trawl
fleet is composed by different gears, bottom trawl (OTB), multi-rig otter trawl (OTT) and midwater otter
trawl (OTM). For these trawls, the minimum mesh sizes are either 40mm in the case of square meshes, or
50mm in the case of diamond meshes. It is widely known that square meshes are much more selective than
diamond meshes. In the case of 40mm meshes, square meshes will only retain hake of 20cm or larger (which
corresponds to the minimal commercialisation size), while diamond meshes will significantly capture
juvenile individuals from 10cm (Ordines et al. 2006). Furthermore, the importance of OTT has increased
during last years, from ~6% in 2014 to ~28% now (see Figure 15). This represents a significant increase of
the fishing effort as the trawled surface (and thereafter the impact on the seabed) can increase by roughly
33% (depending on the tuning of the gear) with OTT (Meillat 1986; Rivierre 2011). These gears are heavier,
and as such are known to better catch individuals close to the bottom, potentially resulting in increased
captures of hake juveniles.
Figure 15: Number of days at sea (y-axis) by year (x-axis) and gear (color)
for the french trawler fleet
Hake fishing mortality, and notably juvenile mortality, should be reduced to allow the stock to grow
old individuals again. Management regulations focusing on the use of OTT and/or mesh size could be some
ways of achieving this objective. Should restrictive management measures be taken, it may be useful to
envision compensation mechanisms for the fishery, to ensure compliance.
Some measures for reducing the effort have been taken at a national level in 2017. Notably, temporal
and permanent closures have been decided (see section 5.6 for details), and the multiannual management
plan for western Mediterranean region is still in discussions. Lastly, we should stress that compliance with
already existing management measures (minimum landing size, legal mesh size, and spatio-temporal
closures) is also necessary for the stock recovery.
3310 Explanation of codes
10.1 Trend categories
1) N - No trend
2) I - Increasing
3) D – Decreasing
4) C – Cyclic
10.2 Stock Status
10.2.1 Based on Fishing mortality related indicators
1) N - Not known or uncertain – Not much information is available to make a judgment;
2) U - undeveloped or new fishery - Believed to have a significant potential for expansion in
total production;
3) S - Sustainable exploitation- fishing mortality or effort below an agreed fishing mortality
or effort based Reference Point;
4) IO –In Overfishing status– fishing mortality or effort above the value of the agreed
fishing mortality or effort based Reference Point. An agreed range of overfishing levels is
provided;
Range of Overfishing levels based on fishery reference points
In order to assess the level of overfishing status when F0.1 from a Y/R model is used
as LRP. the following operational approach is proposed:
If Fc*/F0.1 is below or equal to 1.33 the stock is in (OL): Low overfishing
If the Fc/F0.1 is between 1.33 and 1.66 the stock is in (OI): Intermediate overfishing
If the Fc/F0.1 is equal or above to 1.66 the stock is in (OH): High overfishing
*Fc is current level of F
5) C- Collapsed- no or very few catches;
10.2.2 Based on Stock related indicators
6) N - Not known or uncertain: Not much information is available to make a judgment
7) S - Sustainably exploited: Standing stock above an agreed biomass based Reference Point;
8) O - Overexploited: Standing stock below the value of the agreed biomass based Reference
Point. An agreed range of overexploited status is provided;
Empirical Reference framework for the relative level of stock biomass index
Relative low biomass: Values lower than or equal to 33rd percentile of biomass index
in the time series (OL)
Relative intermediate biomass: Values falling within this limit and 66th percentile
(OI)
Relative high biomass: Values higher than the 66th percentile (OH)
9) D – Depleted: Standing stock is at lowest historical levels. irrespective of the amount of
fishing effort exerted;
10) R –Recovering: Biomass are increasing after having been depleted from a previous period;
3410.3 Agreed definitions as per SAC Glossary
Overfished (or overexploited) - A stock is considered to be overfished when its abundance is
below an agreed biomass based reference target point. like B0.1 or BMSY. To apply this
denomination. it should be assumed that the current state of the stock (in biomass) arises from the
application of excessive fishing pressure in previous years. This classification is independent of the
current level of fishing mortality.
Stock subjected to overfishing (or overexploitation) - A stock is subjected to overfishing if
the fishing mortality applied to it exceeds the one it can sustainably stand. for a longer period. In
other words. the current fishing mortality exceeds the fishing mortality that. if applied during a long
period. under stable conditions. would lead the stock abundance to the reference point of the target
abundance (either in terms of biomass or numbers)
3511 Literature cited
Abella, A., Caddy, J.F. and Serena, F. (1998) Estimation of the parameters of the Caddy reciprocal M-at-age
model for the construction of natural mortality vectors. In: Dynamique des populations marines.
CIHEAM, Zaragoza, pp 191–200.
Bertrand, J.A., Gil de Sola, L., Papaconstantinou, C., Relini, G. and Souplet, A. (2002) The general
specifications of the MEDITS surveys. Scientia Marina 66, 9.
Ferrer-Maza, D., Lloret, J., Muñoz, M., Faliex, E., Vila, S. and Sasal, P. (2014) Parasitism, condition and
reproduction of the European hake (Merluccius merluccius) in the northwestern Mediterranean Sea.
ICES Journal of Marine Science 71, 1088–1099.
He, P. (1993) Swimming speeds of marine fish in relation to fishing gears. In: Fish Behaviour in Relation to
Fishing Operations, Vol. 196. pp 183–189.
Meillat, M. (1986) Mesures sur Chalut Jumeaux au Bassin d’Essai d’Engins de Pêche de Lorient. DIT/86-
02/IPCM/Lorient. IFREMER, Lorient.
Mellon-Duval, C., de Pontual, H., Metral, L. and Quemener, L. (2010) Growth of European hake
(Merluccius merluccius) in the Gulf of Lions based on conventional tagging. ICES Journal of
Marine Science 67, 62–70.
Ordines, F., Massutí, E., Guijarro, B. and Mas, R. (2006) Diamond vs. square mesh codend in a multi-species
trawl fishery of the western Mediterranean: effects on catch composition, yield, size selectivity and
discards. Aquatic Living Resources 19, 329–338.
Rivierre, A. (2011) Validation énergétique dans l’utilisation de chaluts jumeaux pour la pêche crevettière. 24
pp. Centre d’Innovation de l’Aquaculture et des pêches du Quebec, Grande-Rivière.
36You can also read