Oceana Sustainability Report 2020 Status and Management of South African hake - Oceana ...
←
→
Page content transcription
If your browser does not render page correctly, please read the page content below
Oceana Sustainability Report 2020 Status and Management of South African hake
Oceana Sustainability Report 2020

Status and Management of South African hake
Stewart Norman & Dave Japp

Performance of the hake fishery in 2019/20
The Total Allowable Catch (TAC) in the South African hake fishery is split between four fishing sectors,
with deep-sea and inshore trawl sectors receiving 84% and 6.2% respectively and the longline sector
and handline sector receiving 6.5% and 3.3% respectively (see Figure 1b). A small allowance of the
hake TAC is also made for the hake bycatch in the mid-water trawl fishery for horse mackerel (2% of
the horse mackerel catch or about 400 t). The hake Total Allowable Catch (TAC) was fixed at 146 400t
for 2019 and 2020. Currently the hake allocated to the handline fishery is not utilised.

The trend in the TAC since 2014 has been gradually downwards (Figure 1a) as the Operational
Management Plan (OMP) responded to the indices used to determine the state of the hake stocks.
Note that the splitting of the hake fishery into two species has only recently (last decade) been done.
This splitting was prompted by the 1st Marine Stewardship Council certification in the mid 2000’s giving
a more rigorous assessment of the species individually. This process required a creative retrospective
analysis of past catches based on the known depth distributions of the two species (deep and shallow-
water hake). Catches of hake over recent decades have typically fluctuated about 150 000 t per annum
(Figure 1b), with most of the catch being landed by the deep-sea trawl sector, and comprising mainly
of deep-water hake (M. paradoxus). The OMP was revised after a 4-year period during 2018 (OMP-
2018) and due to the positive outlook of the stock it has resulted in a more “aggressive” approach
than OMP-14 higher TACs for the same stock abundance levels. The TAC for 2018 and 2019 was
subsequently set at 146,431 tons and in 2018 green weight catch by the trawl fleet alone amounted
to 123 004t (the balance being caught by the other hake fisheries). The OMP-derived TAC was set for
2020 at 146 400t. The disruption of fishing in 2020 due to COVID has affected fishing operations and
in all likelihood a portion of the 2020 TAC will not be caught and a rollover into next season is
anticipated.
300 000
(a) M. capensis
250 000 M. paradoxus
TAC
200 000
150 000
100 000
50 000
0
1941
2004
1917
1920
1923
1926
1929
1932
1935
1938
1944
1947
1950
1953
1956
1959
1962
1965
1968
1971
1974
1977
1980
1983
1986
1989
1992
1995
1998
2001
2007
2010
2013
2016
300 000
Handline
(b)
Longline
250 000 Inshore trawl
Deep-sea trawl
200 000
150 000
100 000
1972
1990
2008
1960
1962
1964
1966
1968
1970
1974
1976
1978
1980
1982
1984
1986
1988
1992
1994
1996
1998
2000
2002
2004
2006
2010
2012
2014
2016
2018
Figure 1: (a) Total catches (tons) of Cape hakes split by species over the period 1917 – 2017 and the
TAC set each year since the implementation of the OMP approach in 1991. (b) Catches of Cape hakes
per fishing sector for the period 1960 – 2016. Prior to 1960, all catches are attributed to the deep-sea
trawl sector. Figure and caption adapted from Durholtz 20181.
Computations of the likely range of hake TAC outputs from the OMP for the 2021 season suggest that
the TAC for 2021 may be marginally reduced. The main reason is that there is a conflict between the
trends in the two hake species. The overall smoothed abundance index for M. capensis is trending
upwards, while that for M. paradoxus is trending downwards (Figure 2). Because M. paradoxus
contributes about 2.5 times as much as M. capensis to the final TAC2 it has a greater influence on the
TAC allocation. The calculations are informed in part by the West and South coast biomass estimates
of the independent research surveys conducted by DFFE (mostly on the RV Africana) and in part by
the commercial catch rate (CPUE) index derived from the commercial trawl sector (other indices
contribute to the model but these are the two primary indices).
Independent indices of biomass, such as those acquired by research vessels provide a critical annual
index of abundance, but can also have high variability from year to year as it is only a “snapshot” of
the resource at any point in time. It is for this reason that tracking the biomass independently is
important to be maintained consistently over time, and missing surveys due to vessel failure (for
example) can affect how we estimate the health of the hake stocks.
1
Durholtz, M.D. 2018. An overview of the SA hake fishery. MARAM/IWS/2018/HAKE/BG3.
2A. Ross-Gillespie and D.S. Butterworth. Likely 2021 hake TAC recommendation, based on information currently available.
Marine Resource Assessment and Management Group, Department of Mathematics and Applied Mathematics, University
of Cape Town, Rondebosch, 7701. FISHERIES_2020_AUG_SWG-DEM_09.Figure 2: The series-combined J indices are shown for each species, calculated according Equation
(3) for M. paradoxus and Equation (4) for M. capensisError! Bookmark not defined..
Fishery Resource Allocation Process 2021
The main commercial fisheries in South Africa are entering a critical period. For hake, the fishing rights
have effectively come to an end and a new process of reapplying for these rights has been started.
The inshore trawl fishery for hake and sole, the rights for which were reallocated in 2018, were
significantly disrupted due to a similar process, mainly due to objections and litigation. The prospects
for the deep-water trawl sector are equally uncertain and the industries affected are bracing
themselves for a turbulent period. The deep-sea hake sector, through the mother body (SADSTIA), has
commissioned an economics report, commonly referred to as the Genesis Report3. Regardless of the
complexity inherent in management of the fishery the reality is simply this - substantial value in the
industry is dependent on not only a stable TAC but also allocations that can sustain the current
employment levels, markets and investments in vessels and other infrastructure. For example, there
is a clear distinction in the operating models of freezer trawlers and on-shore process operations but
regardless, harvesting the resource is highly capital intensive and requires high-asset utilization even
before the catch profile is factored into revenue3. In addition, both costs and revenue are subject to
notable external risk factors such as exchange rates and oil prices that have variably plummeted and
skyrocketed in 2020. The Genesis report was prepared through private initiative in anticipation of
government-driven socio-economic impact assessments of all fishery sectors undergoing the long-
term rights allocation process.
In addition an analysis of the economic benefits of Marine Stewardship Council certification for the
South African hake trawl fishery showed that retaining MSC-certification is critical in order to maintain
high levels of employment and current market position4. Whereas (from a DFFE perspective) biological
3
https://www.sadstia.co.za/assets/uploads/GenesisHDSTReport_FINAL.pdf
4
https://www.researchgate.net/publication/296682939_Estimating_the_economic_benefits_of_MSC_certificat
ion_for_the_South_African_hake_trawl_fisheryconsiderations are primarily seen as being managed through the TAC and in part through limiting
cluster fishing effort (input or TAE control), the MSC provides significantly more incentive for the
fishery to maintain its global best-practice certification and perception of a sustainable well-managed
fishery.
Management of the fishery (OMP application)
The fishery was first certified against the MSC Standard 2004, making it the first hake fishery to be
certified globally, and re-certified on two occasions (2010 and 2015). The third re-assessment against
the new MSC Standard Version 2.1 began in October 2019, and the fishery has once again had its
efforts recognized as meeting the gold standard for sustainability and numerous factories maintain
their chain of custody certification5, though the Public consultation and objections procedure must
still be finalised. Whereas the South African fishery is well versed in the rigours of maintaining such a
high level accolade, for the first time, in 2019/20, the Namibian hake trawl and hake longline fishery
has also gone the distance in its pursuit of certification against the MSC Standard6. Since the deep-
water hake stock has been deemed to be shared between the two countries (moderate connectivity),
the MSC requires a degree of management control and cooperative governance never before
considered necessary. This led to a plethora of OMP robustness tests, and variations and re-runs of
the hake assessment model7; which ultimately led to the conclusion that the SA hake management
procedure is sufficiently robust effectively mitigating any adverse consequences (in resource
conservation terms) of any variations (particularly increases) in the Namibian catch of M. paradoxus.
The stock status the South African M. paradoxus stock is considered to be fluctuating around the
Maximum Sustainable Yield (MSY) target whilst the M. capensis stock is better off and determined
with a high degree of certainty to have been above the MSY level for a number of years 5. With the
Namibian fishery landing a similar amount of hake to South Africa (around 150 000t) a year and the
stock there also considered healthy and fluctuating around MSY6 the amount of MSC certified hake in
between the two countries will approximate 300 000t. This is seen as a positive development for our
regional hake fishery, strengthening the value of hake for both countries and increasing the volume
of prime quality hake on the international “whitefish” markets.
In terms of governance the MSC requires further development of the existing framework for
cooperation between the two countries specifically with respect to; collecting and sharing data;
creating appropriate arrangements for the management of shared living marine resources; the
scientific assessment of stock status; and the development of scientific advice; with the ultimate goal
that “a system for organised and effective cooperation shall be established between the respective
clients which delivers management outcomes consistent with MSC Principles 1 and 2.”
Ecosystem impacts and associated research
5
https://fisheries.msc.org/en/fisheries/south-africa-hake-trawl/@@assessments
6
https://fisheries.msc.org/en/fisheries/namibia-hake-trawl-and-longline-fishery/@@assessments
7
FISHERIES/2020/MAR/SWG-DEM/02; FISHERIES/2020/MAR/SWG-DEM/03; FISHERIES_2020_AUG_SWG-
DEM_11, FISHERIES_2020_AUG_SWG-DEM_11bIn addition to the routine research undertaken by DAFF – now the Department of Environment, Fisheries and Forestry (DFFE8), industry has voluntarily initiated its own investigations in the interest of better understanding the ecosystem and conservation aspects of the hake fishery. For the most part this work is driven by SADSTIA9 and through the Responsible Fisheries Alliance (RFA)10 in support of ecolabel certification by means of the MSC and consumer awareness through SASSI11,12. The research initiatives, conducted in collaboration with tertiary institutions, the government department scientists, NGOs and independent scientific monitoring companies, specifically reflect the actions required to close out any conditions of certification raised during the MSC assessment process. The Unit of Certification (UoC), defined in this instance as the deepsea and inshore trawl fishery sectors represented by SADSTIA and SECIFA, is awarded a 5-year certificate during the lifespan of which it is required to close-out any conditions. A Client Action Plan (CAP) is drafted laying out the strides the fishery intends to take to achieve this. Since the adoption of the new MSC Standard V2.1 and a further ‘raising of the bar’, there are a number of critical new milestones the fishery is required to meet. These are reflected in conditions linked to; Endangered, Threatened and Protected (ETP) species and benthic habitat impacts – specifically relating to Vulnerable Marine Ecosystems (VMEs). However, it is important to reflect that where MSC conditions have not been raised then the fishery has been scored as meeting the global-best practice come to be expected of it. This applies to Primary (managed) bycatch, secondary (unmanaged) bycatch and overarching ecosystem impacts. Longstanding management interventions in support of habitat protection include the Trawl Ring- Fence. This was implemented in 2004 by the deepsea and inshore trawl sectors to ensure that the fishery only operates in historically trawled areas that conceivably are not home to fragile habitat types. The two sectors also supported the development of 20 new offshore MPAs13 in cooperation with the Department of Environmental Affairs and the South African National Biodiversity Institute (SANBI) in order to protect most of the important marine habitat types that occur on the continental shelf. Co-ordination of activities relating to habitats and VMEs is the responsibility of the SADSTIA VME Management Committee, first convened in February 2020. A comprehensive guide to support data collection on marine invertebrates (Atkinson & Sink 201814) and posters to support VME indicator species identification at sea have been produced. A pilot project to develop a monitoring protocol for VME indicator organisms has been conducted and already observers conduct invertebrate sampling during one trawl per day on an ongoing basis. 8 https://www.environment.gov.za/branches/fisheriesmanagement 9 https://www.sadstia.co.za/ 10 https://www.rfalliance.org.za/ 11 http://wwfsassi.co.za/south-african-offshore-trawl-bycatch-fishery-conservation-project/ 12 http://wwfsassi.co.za/hake-inshore-trawl-fishery-conservation-project/ 13 https://www.marineprotectedareas.org.za/explore 14 http://www.saeon.ac.za/Field%20Guide%20to%20SA%20Offshore%20Marine%20Invertebrates_web%20full% 20version.pdf
WWF-SA and SADSTIA are in the process of finalizing a new agreement that builds on the successes
and learnings of the 2016-2019 SADSTIA offshore trawl Fisheries Conservation Project (FCP). The
second phase is set to commence in January 2021 and will span a 3 year time period.
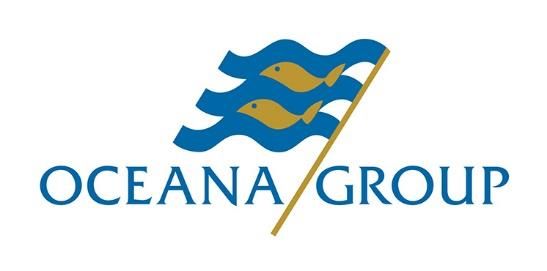
A B
Examples of Vulnerable
Marine Ecosystem (VME)
indicator species that
fishery observers and
factory crew are on the
lookout for. Each of these
species has a ‘do not
exceed’ weight threshold
that if exceeded triggers
the vessel move-on rule.
C D
A – Stylaster coral
B – Reef-building cold
water coral
C – Glass sponge
D – Colourful sea fan
Image source: Atkinson
and Sink 201814.
All images are property of the
Outlook for the Hake Fishery South African Environmental
Observation Network (SAEON)
Management of hake and fisheries in general aim for “sustainability”, which by definition can be the
and not for use without
ability to be maintained at a certain rate or level or, the avoidance of the depletion of natural resources
permission.
in order to maintain an ecological balance. Sustainability therefore depends on your frame of
reference. From an economic and job security standpoint for example, the sustainability of the fishery
was recently called into question when the ongoing global pandemic forced most operations to
radically innovate in order to continue to function under a “new normal”. Along the sea floor (the
“habitat”) however things carried on blissfully unaware of COVID19, or perhaps the effects of a
reduction in fishing effort are still to be seen. From whichever viewpoint you are looking, during 2020
the message seems clear enough - always innovate and improve - and we can hopefully envisage a
positive change to our collective behaviours – something that the Oceana group perpetuates. What
has remained unchanged is the demand for high quality, fresh and frozen seafood caught and
processed in South Africa, with the guarantee that it is sourced from a sustainable well managed
fishery.You can also read