Spatio-Temporal Resource Mapping for Intensive Care Units at Regional Level for COVID-19 Emergency in Italy - MDPI
←
→
Page content transcription
If your browser does not render page correctly, please read the page content below
International Journal of
           Environmental Research
           and Public Health

Article
Spatio-Temporal Resource Mapping
for Intensive Care Units at Regional Level
for COVID-19 Emergency in Italy
Pietro Hiram Guzzi ∗,† , Giuseppe Tradigo †                     and Pierangelo Veltri †
 Department of Surgical and Medical Sciences, University of Catanzaro, 88100 Catanzaro, Italy;
 gtradigo@unicz.it (G.T.); veltri@unicz.it (P.V.)
 * Correspondence: hguzzi@unicz.it
 † These authors contributed equally to this work.

 Received: 6 April 2020; Accepted: 9 May 2020; Published: 12 May 2020

 Abstract: COVID-19 is a worldwide emergency since it has rapidly spread from China to almost all
 the countries worldwide. Italy has been one of the most affected countries after China. North Italian
 regions, such as Lombardia and Veneto, had an abnormally large number of cases. COVID-19 patients
 management requires availability of sufficiently large number of Intensive Care Units (ICUs) beds.
 Resources shortening is a critical issue when the number of COVID-19 severe cases are higher than the
 available resources. This is also the case at a regional scale. We analysed Italian data at regional level
 with the aim to: (i) support health and government decision-makers in gathering rapid and efficient
 decisions on increasing health structures capacities (in terms of ICU slots) and (ii) define a geographic
 model to plan emergency and future COVID-19 patients management using reallocating them among
 health structures. Finally, we retain that the here proposed model can be also used in other countries.

 Keywords: COVID-19; prediction of infected; data analysis

1. Introduction
     COVID-19 [1] is caused by the SARS-CoV-2 virus and belongs to the Coronaviridæ family,
which contains many other viruses. Only seven of which are known to be responsible for human
diseases, e.g., 229E, NL63, OC43, HKU1, MERS-CoV, SARS-CoV, and SARS-CoV-2 [2,3].
     The virus diffused with a surprisingly fast pace, and in one month putting under stress the
healthcare resources worldwide, starting from China. Italy was the first European country affected
by the virus. The high spreading rate and the absence of tailored therapies and vaccines determine
a relatively high mortality rate that has been controlled by blocking the virus spreading with severe
mobility restrictions to the people of the infected regions [3].
     By the end of March, while the situation in China seems to be under control, the virus is rapidly
growing in other countries [4,5]. With different time scales, other countries such as the USA, France,
Spain and North Europe reacted by implementing containment measures. The virus has an initial
exponential diffusion which requires: (i) home quarantine for low symptoms, (ii) hospitalisation for
part of them and, (iii) hospitalisation in ICUs requiring respiratory support for severe ones.
     In some cases, COVID-19 causes severe pneumonia, especially in the presence of co-morbidities [6],
thus patients need hospitalization in ICU where respiratory support (such as mechanical ventilators)
are required to keep them alive [7].
     We focus on a disease diffusion model which helps predicting ICU resources, for the Italian
emergency. The model is general enough to foresee its adoption also in other countries. It also scales
well at a regional or sub-regional level.

Int. J. Environ. Res. Public Health 2020, 17, 3344; doi:10.3390/ijerph17103344            www.mdpi.com/journal/ijerph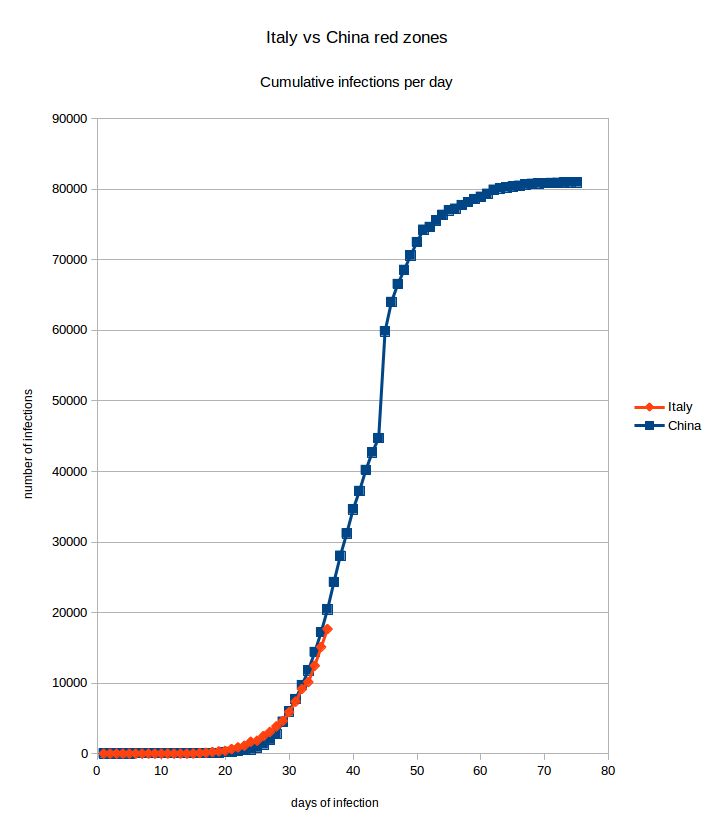
Int. J. Environ. Res. Public Health 2020, 17, 3344                                                            2 of 9

2. Materials and Methods
     Data.
     All data used in this work are provided by Italian Government on a publicly available web site
https://github.com/pcm-dpc/COVID-19 under licence CC-BY-4.0.

3. Results and Discussion
     We start from the analysis of epidemiological data from Wuhan city (China, Hubey region).
As reported in [8,9] about a third of infected patients required ICU admission. ICU departments need
to be well organised to be able to host COVID-19 patients. There is also the need to avoid mixing
COVID-19 with other patients in ICUs [10].
     In Italy on 15 March, official data reported 24,747 total cases, 20,603 people currently infected,
1809 deaths and 2335 recovered patients.
     Among these: 9268 were reported as being treated at home (i.e., not severe illness), 9663 hospitalised,
and 1672 admitted to ICUs.
     To react to the exponential growth of infected patients requiring hospitalisation, the Chinese
government decided to build a large emergency hospital dedicated to COVID-19 patients in a few
days. In Italy, the plan was to improve existing structures by extending the number of ICU resources
and beds, as well as using dedicated health structures. For instance, the study reported in [11] focuses
the necessity of acquiring ICU resources such as ventilators or breathing support devices. Italy has
approximately 5200 beds in ICUs, which, by law, are designed to be occupied by patients for the 80%
at any given time. Also, these are allocated at a regional level proportionally to its population and are
usually managed locally (see Table 1).

      Table 1. Distribution of ICU beds in each region at the date of 15 March. Such data could increase in
      the future due to government investments for the emergency.

                                 Region                  Beds   Region          Beds
                                 Piemonte                320    Marche          108
                                 Valle D’Aosta             15   Lazio            590
                                 Lombardia               1067   Abruzzo          73
                                 P.A. Bolzano              48   Molise            30
                                 P.A. Trento               23   Campania         350
                                 Veneto                  498    Puglia           210
                                 Friuli Venezia Giulia     80   Basilicata        49
                                 Liguria                  70    Calabria        110
                                 Emilia Romagna           539   Sicilia          346
                                 Toscana                  450   Sardegna        150
                                 Umbria                    30   Italy           5156

     Many of such ICU slots were yet occupied by non-COVID-19 patients while as of 15 March
1672 beds are occupied by COVID-19 patients. Considering the infection trend, it is reasonable to
predict that the number of ICUs patients will increase. Since ICU resources are limited, there is the need
to know in advance how many will be used. Such a decision may regard, for instance, the institution
of new ICU beds or the movement of people from one region to another. So, it is crucial to correctly
estimate the number of patients that will need ICU treatment [11].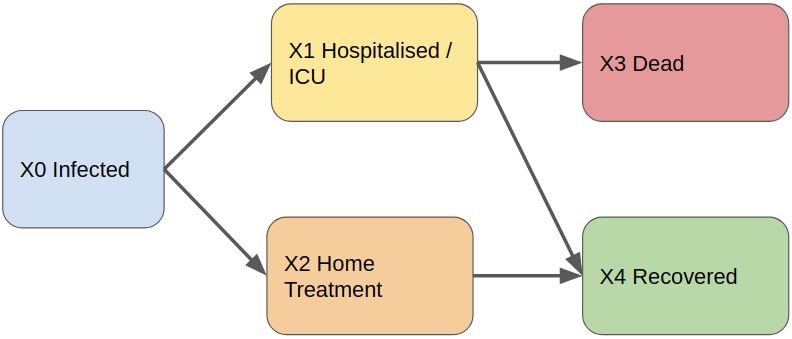
Int. J. Environ. Res. Public Health 2020, 17, 3344                                                            3 of 9

3.1. Diffusion Model of COVID-19
     We focus on decision strategy to increase number and structures able to treat COVID-19 patients
in intensive units, and thus increasing the number of ICUs. We propose a model able to manage
in geographic scale the incoming patients and the ICUs available places. We cover the a need for
the development of a predictive model for helping healthcare administrators in managing structure
requirements to improve hospitals and patients managements. We extend a compartmental model
for epidemiology, and we derive from Italian public data the experimental parameters for simulating
the model.
     Literature contains many mathematical epidemiological models for studying the dynamics of
infectious diseases [12]. These models fall in two main classes: deterministic models that are based on
differential equations and stochastic models that are based on Markov processes.
     We used a discrete-time Markov chain model [13] and we derived the parameters of the model
starting from publicly available data, the same described in Section 3. We use as reference a
compartmental model which we adapted from the literature [14] (see Figure 1).

      Figure 1. The Compartmental Model. Our model start by considering infected people (X0). A fraction
      of infected people presents severe symptoms and they need to be hospitalised and treated in ICUs
      (X1). Diversely, some people may be treated at home (X2) since they do not have severe complications.
      Treated people has a lethal outcome (X3) while a hopefully large fraction of people is recovered
      from disease.

     In Figure 2 the COVID-19 diffusion is reported both for Italy and China red zones (A “red zone” is
a geographical area (e.g., city, region, state) of maximal infection for which the government implements
special social rules in order to deal with the emergency: typically restriction of citizens’ movements
and prohibition to leave or enter the area). We can make the hypothesis of similar trends for different
countries (including Italy). Initial exponential growth of the disease is first identified followed by
a logistic regression trend as disease spread slows down. In the last phases of the infection, where the
curve becomes logistic, diseases have to be treated, continue managing the fraction of patients that
require ICUs.
Int. J. Environ. Res. Public Health 2020, 17, 3344 4 of 9
Figure 2. Here the two Italian and Chinese red zones (areas of maximal infection) are compared. On the
X axis there are days and on the Y axis there are the total number of cases. The two curves are very
similar showing that the initial trend of the infection follows an exponential growth, even though the
Chinese government rapidly adopted stringent confinement measures. We can thus expect to observe
the same initial infection evolution, before arriving to the logistic portion of the curve.
3.2. Model at Regional Scale
The Italian National Health Service is organised on a national and regional scale. The central
government controls the distribution of resources and services are arranged at a regional scale.
There are 19 regions and two autonomous provinces (21 total administrative units). Therefore the
ICUs is availability is organised at a regional scale, established by each region. Table 1 summarise
current ICU beds availability per administrative units. Patients are admitted into the ICUs of its
region, without considering other criteria, such as free beds into ICUs of other regions that may be
geographically closer. The access is freely guaranteed costs are mapped to citizen with respect to their
regions of residence.Int. J. Environ. Res. Public Health 2020, 17, 3344 5 of 9
Consequently, some regions may have many available beds while other regions may not.
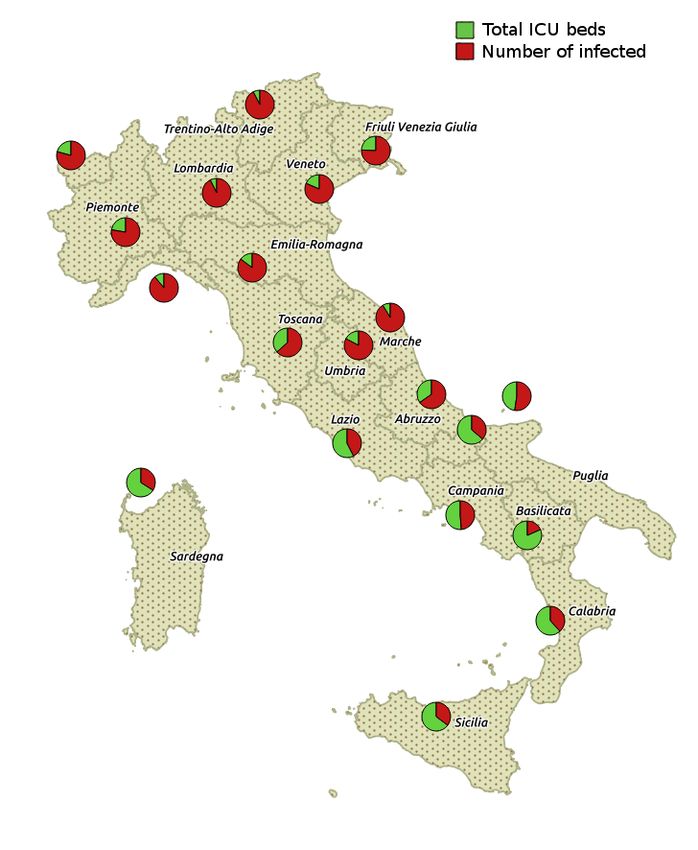
This situation happened in northern Italian regions. Figure 3 shows the distribution of total ICU
beds versus occupied ICU beds (i.e., in hospitals) for each region in Italy whereas Figure 4 shows the
infected cases for each region.
We compare through our model the management of beds in single regions as compartment and the
management of places on a nationwide scale (admitting transfers among regions). Our findings suggest
that the management of ICUs beds as a whole across regions may improve the overall availability of
free beds for COVID-19 patients.
Figure 3. Figure depicts the total number of ICU beds and the number of currently occupied per
region. Data is available online on the Italian Civil Protection Department website at https://github.
com/pcm-dpc/COVID-19/blob/master/dati-regioni/dpc-covid19-ita-regioni-20200315.csv with
licence CC-BY-4.0.Int. J. Environ. Res. Public Health 2020, 17, 3344 6 of 9
Figure 4. Figure depicts the distribution of COVID-19 infected cases along Italian peninsula. Please
note that the number of ICU beds reported are the total and fixed number of available beds
for each geographical area. Data is available online on the Italian Civil Protection Department
website at https://github.com/pcm-dpc/COVID-19/blob/master/dati-regioni/dpc-covid19-ita-
regioni-20200315.csv with licence CC-BY-4.0.
Figure 3 shows the distribution of total ICU beds versus occupied ICU beds (i.e., in hospitals) for
each region in Italy. Figure 4 shows the infected cases for each region.
3.3. Model Based ICUs Prediction
We associated the number COVID-19 infections with ICU beds occupancy. In particular, the target
is to predict the number of ICU beds required for a certain amount of infections in a given region,
using COVID-19 trend. This is used to relate infections and ICUs beds (see Figure 5b for Lombardia
region). We fitted the datapoints from current COVID-19 infection with an exponential function.
By using such a fitting we are able to predict infections (Y axis of Figure 5a) for future days (X axis of
Figure 5a). Then, we can use such a number (X axis of Figure 5b) in order to predict the number of
ICUs required in the future (Y axis of Figure 5b). These predictions may be used to plan decision about
COVID-19 patients and also to reallocate them in different structures.Int. J. Environ. Res. Public Health 2020, 17, 3344 7 of 9
(a) Lombardia: Infections per days (b) Lombardia: ICU beds prediction
(c) Veneto: Infections per days (d) Veneto: ICU beds prediction
(e) Emilia Romagna: Infections per days (f) Emilia Romagna: ICU beds
prediction
Figure 5. Infections per days (with exponential fitting) and ICU bed vs. Infection (with moving average
of modulus 3) graphs for the Lombardia, Veneto and Emilia Romagna northern regions at the date of
30 March.
Furthermore, trends of other Italian regions are reported in Figure 5c and Figure 5d respectively
for Veneto region, and Figure 5e,f for Emilia Romagna region. Lombardia, Veneto and Emilia Romagna
were the top three regions with an emergency in terms of ICU beds necessity at the date of 30 March
(saturated regions).These regions were already reallocating ICU patients in different regions as well as
working on plans to free ICU beds or create new ones.
Predicting ICU for non-saturated regions. We applied our predicting model to southern Italian
regions, when the infection trend was at the beginning (i.e., delayed curve and low numbers) with
respect to northern ones. During this phase the ICU beds capacity was under saturation (see Figure 3).
We used the predicting model for these regions to early predict saturation phases. In Figure 6a,b a
diffusion of disease and relative connections with ICUs requirements are reported and refer to a central
Italian region, i.e., Lazio. By using infections vs ICU beds trend, we were able to calculate the number
of infections for some time point in the future and derive the number of predicted ICU beds whichInt. J. Environ. Res. Public Health 2020, 17, 3344 8 of 9
will be occupied. Similarly, in Figure 6c we report Campania region situation at 30 March as south of
Italy representation. In such case note that the government restrictions rapidly adopted allow a slower
diffusion of infectious.
(a) Lazio: Infections per days (b) Lazio: ICU beds prediction
(c) Campania: Infections per days (d) Campania: ICU beds prediction
Figure 6. Infections per days (with exponential fitting) and ICU bed vs. Infection (with moving average
of modulus 3) graphs for the Lazio and Campania southern regions at the date of 30 March.
Note that in a similar way we map all data for all the 21 Italian regions.
4. Conclusions
The emergency of COVID-19 is related to an aggressive virus that diffuses rapidly and strongly
stresses the resistance of health structures. Since the COVID-19 related disease require different
non-standard protocols, such as the use of respiratory devices, patients treatment is strictly intertwined
with the availability of hospital structure resources (e.g., ICU beds). We think that, by using a scalable
predictive model, (at regional or district level) may support governments in a better management
of the emergency. Finally, the presented model is valid during the exponential growth of the
infection. Furthermore, since the swab tests are not available in sufficient numbers to guarantee
a wide screening of the population, they are performed only to hubs (i.e., police officers, healthcare
personnel) and people dyeing by covid who were previously hospitalized in ICUs. Hence infection
numbers are highly underestimated. We claim that such a model could be used in countries where
diffusion is still at the beginning, such as US, France, Spain and other European countries (see [15]
where virus diffusion trajectories are reported for different countries).
Author Contributions: G.T. was responsible for data analysis and statistics, and writing of the manuscript. P.H.G.
was responsible for data analysis and writing of the manuscript. P.V. was responsible for data analysis and writing
of the manuscript. All authors have read and agreed to the published version of the manuscript.
Funding: This work has been partially funded by project SISTABENE: SIStema di Tracciabilità Avanzata per il
BENEssere Alimentare POR CALABRIA FESR-FSE 2014-2020.
Acknowledgments: We thank Italian Protezione Civile for freely providing online data thus allowing studies on
COVID-19. We thank Tamer Kahveci from University of Florida for useful suggestions.Int. J. Environ. Res. Public Health 2020, 17, 3344 9 of 9
Conflicts of Interest: The authors declare no conflict of interest.
Abbreviations
The following abbreviations are used in this manuscript:
ICU Intensive Care Unit
References
1. Malta, M.; Rimoin, A.W.; Strathdee, S.A. The coronavirus 2019-nCoV epidemic: Is hindsight 20/20?
EClinicalMedicine 2020, 20, 100289. [CrossRef] [PubMed]
2. Lu, R.; Zhao, X.; Li, J.; Niu, P.; Yang, B.; Wu, H.; Wang, W.; Song, H.; Huang, B.; Zhu, N.; et al. Genomic
characterisation and epidemiology of 2019 novel coronavirus: implications for virus origins and receptor
binding. Lancet 2020, 395, 565–574. [CrossRef]
3. Wu, J.T.; Leung, K.; Leung, G.M. Nowcasting and forecasting the potential domestic and international spread
of the 2019-nCoV outbreak originating in Wuhan, China: A modelling study. Lancet 2020, 395, 689–697.
[CrossRef]
4. Rezaeetalab, F.; Mozdourian, M.; Amini, M.; Javidarabshahi, Z.; Akbari, F. COVID-19: A New Virus as a
Potential Rapidly Spreading in the Worldwide. J. Cardio-Thorac. Med. 2020, 8, 563–564.
5. Chinazzi, M.; Davis, J.T.; Ajelli, M.; Gioannini, C.; Litvinova, M.; Merler, S.; Pastore y Piontti, A.;
Mu, K.; Rossi, L.; Sun, K.; et al. The effect of travel restrictions on the spread of the 2019 novel coronavirus
(COVID-19) outbreak. Science 2020, 368, 365–400. [CrossRef] [PubMed]
6. Day, M. Covid-19: Italy confirms 11 deaths as cases spread from north. BMJ 2020, 368. [CrossRef] [PubMed]
7. Arabi, Y.M.; Fowler, R.; Hayden, F.G. Critical care management of adults with community-acquired severe
respiratory viral infection. Intensive Care Med. 2020, 46, 315–328. [CrossRef] [PubMed]
8. Huang, C.; Wang, Y.; Li, X.; Ren, L.; Zhao, J.; Hu, Y.; Zhang, L.; Fan, G.; Xu, J.; Gu, X.; et al. Clinical features
of patients infected with 2019 novel coronavirus in Wuhan, China. Lancet 2020, 395, 497–506. [CrossRef]
9. Guan, W.; Ni, Z.Y.; Hu, Y.; Liang, W.; Ou, C.Q.; He, J.X.; Liu, L.; Shan, H.; Lei, C.L.; Hui, D.S.; et al. Clinical
characteristics of coronavirus disease 2019 in China. N. Engl. J. Med. 2020, 382, 1708–1720. [CrossRef]
[PubMed]
10. Liew, M.F.; Siow, W.T.; MacLaren, G.; See, K.C. Preparing for COVID-19: Early experience from an intensive
care unit in Singapore. Crit. Care 2020, 24, 1–3. [CrossRef] [PubMed]
11. Remuzzi, A.; Remuzzi, G. COVID-19 and Italy: What next? Lancet 2020, 395, 1225–1228. [CrossRef]
12. Keeling, M.J.; Rohani, P. Modeling Infectious Diseases in Humans and Animals; Princeton University Press:
Princeton, NJ, USA, 2011.
13. Yaesoubi, R.; Cohen, T. Generalized Markov models of infectious disease spread: A novel framework for
developing dynamic health policies. Eur. J. Oper. Res. 2011, 215, 679–687. [CrossRef] [PubMed]
14. Sun, J.; He, W.T.; Wang, L.; Lai, A.; Ji, X.; Zhai, X.; Li, G.; Suchard, M.A.; Tian, J.; Zhou, J.; et al. COVID-19:
Epidemiology, Evolution, and Cross-Disciplinary Perspectives. Trends Mol. Med. 2020, 26, 843–894.
[CrossRef] [PubMed]
15. Coronavirus Pandemic. Available online: https://www.ft.com/coronavirus-latest (accessed on 21 April 2020).
c 2020 by the authors. Licensee MDPI, Basel, Switzerland. This article is an open access
article distributed under the terms and conditions of the Creative Commons Attribution
(CC BY) license (http://creativecommons.org/licenses/by/4.0/).You can also read