Seasonal Weather Forecast talk show on Capricorn and North West FM
←
→
Page content transcription
If your browser does not render page correctly, please read the page content below
Seasonal Weather Forecast talk show on Capricorn and North West FM
What is Seasonal Weather Forecast?
Seasonal weather forecast can be simplified in this way, firstly looking at two common methods of
weather forecasting which are Deterministic and Probabilistic in nature. For example, the
deterministic forecast in South Africa will be the day-to-day forecasts produced by the South
African Weather Service in the sense that they provide specific details regarding the weather with
respect to location and time (e.g. “heavy storm will reach Durban around noon on Sunday”). While
great steps have been made in recent years in extending the range of forecasts, for fundamental
reasons deterministic forecasts have not demonstrated any skill in predicting the weather weeks
or months ahead.
Seasonal forecasts take a different approach: they predict the climate, or more accurately the
deviation from the average climate, for the coming season. They are probabilistic in nature (e.g.
there is an 80% probability that the season will be drier than average) and always relative to a
mean climate. If the coming season is “average”, the seasonal forecast may not be particularly
useful. However, a forecast that can correctly identify the future occurrence of large departures or
anomalies from the average has considerable potential. The key to the success of a seasonal
forecast lies in the correct identification and modeling of the system or factors that push the
climate away from the average.
Categories of Weather Forecast
Nowcast (0-6 hours) DETERMINISTIC
Short-term (1-7 days) DETERMINISTIC
Medium-term (up to 30 days) DETERMINISTIC/PROBABILISTIC
Seasonal (3 months) PROBABILISTIC
In summary: deterministic means the day-to-day and weekly forecasts. Probabilistic means the
climate probability for the coming season; in other words for one to three months or longer.
How is it possible to predict Seasonal Forecast?
First of all it is very important to understand that while nature has the ability to limit our capability
to forecast daily weather, there is a firm scientific basis for the prediction of seasonal mean
climate irregularities (for example, departures from normal of averages and other statistics
of weather over a season or longer). Seasonal climate differences result from complex
interactions between the atmosphere and the underlying surfaces, i.e. the world’s oceans and
land surfaces. The interaction between the oceans and the atmosphere at seasonal timescales
was first understood in the context of the El Niño/Southern Oscillation (ENSO) phenomenon: the
periodic warming and cooling of the sea surface temperature in the equatorial central and eastern
Pacific (popularly known as "El Niño" and "La Niña" events).
The first successful computer model developed and modeling of the ocean atmosphere
interactions associated with ENSO were performed in the 1980s. Since that time increasingly
1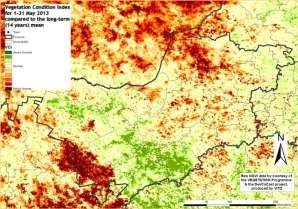
sophisticated and realistic computer models have been developed in support of seasonal climate
prediction.
The feasibility of seasonal forecasting depends on the fact that over a season, the effects of
shorter-term weather events tend to average out, revealing the smaller but more consistent
influence of the ocean and land surface on the atmosphere.
The skill of probabilistic forecast of seasonal climate one to two seasons in advance improved
dramatically during the 1980s and 1990s. Advances in understanding the wide array of processes
that contribute to seasonal and inter-annual climate variability offer the hope of continuing
improvements in the decades to come. To realize these potential gains it will be necessary to
maintain the integrity of the global weather observation system and to provide enhancements, as
needed, for monitoring processes in the oceans and on the land surface that contribute to
variability on these timescales.
Continuous changing land surface conditions like soil water content, vegetation and snow cover
are also believed to feed back to the atmospheric circulation, but these effects have proven more
difficult to simulate in computer models and to incorporate into climate prediction schemes. The
good news is that changes in land surface conditions evolve slowly nature is kind to us and allows
us time to adapt to changes. Slowly evolving land surface conditions (e.g. soil moisture,
vegetation and snow cover) are also believed to feed back to the atmospheric circulation, but
these effects have proven more difficult to simulate in computer models and incorporate into
climate prediction schemes.
Can Seasonal Forecast be used in decision making?
A weather forecast, however skillful it may be, has no essential value unless it can be used to
make decisions which bring some financial benefit or otherwise to the end user. The concept of
forecast value is that forecasts only have value if a user takes action as a result, and the action
saves the user money or the end user makes more profit. Calculation of forecast value for
predictions of a defined event therefore requires information on (a) the ability of the forecast
system to predict an event, and (b) the user's costs and losses associated with the various
possible forecast outcomes.
Seasonal forecasts are expected to be useful the more frequent they are; however, they
should be used with caution due to their level of uncertainty. Seasonal forecasts could be
regarded as a guideline and as a planning tool.
The users of seasonal forecasts should do their cost benefit analysis to get an idea of the
potential benefits and losses involved.
Agricultural background of North West Province
North West Province (NWP) is predominantly rural and mainly dependent on agriculture as a
social and economic driver. NWP is also characterized by high poverty and low income levels
despite various intervention programmes instituted by government. As such, poverty still remains
a rural phenomenon. A consequence is that many of the rural population in NWP suffer food and
nutritional insecurity and therefore malnutrition which affect all aspects of life and well-being.
NWP represents a significant area of maize production and of cattle numbers in South Africa and
empirical evidence from other countries has shown that with the necessary support, agriculture
can contribute significantly to poverty alleviation by raising agricultural productivity and rural
incomes.
The variation in climate and landforms in NWP gives rise to a rich tapestry of landscapes and
vegetation types. This diversity ranges from the majestic Magaliesberg mountain range in the east
2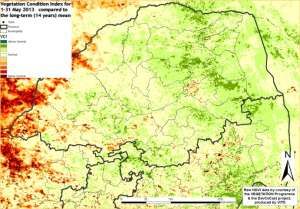
to unique dolomitic springs, eyes and sinkholes dotted in the bushveld and savannah plains in the
central region to the arid plains of the Kalahari in the far western region.

Agricultural background of Limpopo Province
Limpopo Province (LP) has abundant agricultural resources and it is one of the country's prime
agricultural regions well known for the production of livestock, fruits and vegetables, cereals and
tea. The range in climate makes it possible for the agricultural sector in LP to produce a wide
variety of agricultural produce ranging from tropical fruits such as banana, mangoes to cereals
such as maize, wheat and vegetables such as tomatoes, onion and potatoes.

There are two main types of farmers in LP, namely commercial and smallholder farmers. The
commercial farmers practise large-scale farming systems using the most advanced production
technology. The smallholder farms are located mostly in the former homeland areas and produce
under the smallholder systems characterized by low level of production technology and small size
of farm of approximately 1.5 hectares per farmer; with production primarily for subsistence and
little marketable surplus.

Given the fact that 89% of the population of LP is classified as rural, agricultural activities in the
rural communities play a major role in the economic development of rural livelihoods in the
Province.

Similar to the NWP, poverty, food and nutritional insecurity and malnutrition are the rule in rural
areas rather than the exception.

Rainfall and Vegetation conditions in North West and Limpopo Province
The current below-normal rainfall experienced at the end of summer season 2013 has
exacerbated the conditions of drought in NWP and northern parts of LP. Currently the effects of
drought in the two provinces are the cause of major concern where there are reports of lack of
water supplies in most parts of the rural areas and dams are already showing the effects of
prevailing drought conditions.

Figure 1: Total rainfall for March and April 2013

Source: Umlindi issue 2013-04 and 05

Figure 1 indicates that NWP received between 25-100mm in the month of March and between 10-
100mm in the month of April. The rainfall received in the southwestern parts of NWP during the
month of April has decreased as compared to the month of March, thus increasing the probability
of drought conditions in this area. The decreasing precipitation conditions are evident in the

                                                  3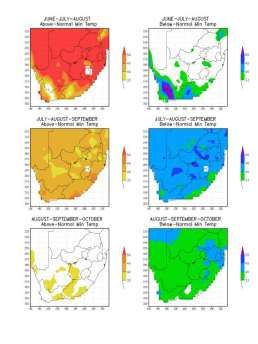
Normalized Difference Vegetation Index (NDVI) difference map (Figure 2) and thus confirm the
worsening drought conditions in the province. Figure 2 indicates that the vegetation cover in NWP
has not improved. Therefore the drought conditions experienced in NWP have not improved in the
month of April.

Figure 2: NDVI difference map for March and April 2013 compared to the long-term (15
years) mean

Source: Umlindi issue 2013-04 and 05

The NDVI difference map from 1 January to 31 May in Figure 3 indicates below-normal conditions
of vegetation activity in greater parts of NWP and normal to above-normal conditions in LP. The
vegetation activity during the month of May has improved in greater parts of LP as compared to
the cumulative conditions from 1 January to 31 May in comparison with the long-term (14 years)
mean. However, there are some areas in the southern parts of LP with below-normal vegetation
activities (see Figure 4).

Figure 3: NDVI difference map for 1 January to 31 May and 1 to 31 May 2013 compared to
the long-term (14 years) mean

Source: Umlindi issue 2013-06

The Vegetation Condition Index (VCI) map in Figure 4 indicates that the greater parts of NWP are
experiencing below-normal vegetation activities. However, there are some pockets of normal to
above-normal condition in the southern central parts of the province. The greater parts of LP in
the southwest bordering Botswana are experiencing below-normal vegetation activity (Figure 4).

                                               4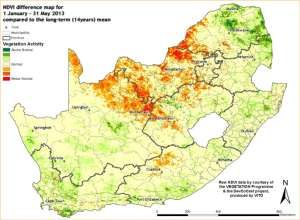
Figure 4: Vegetative Condition Index for 1-31 May 2013 compared to the long-term (14
years) mean for Limpopo (left) and North West Province

Source: Umlindi issue 2013-06

Figure 4 indicates the continuing below-normal conditions in NWP, thus the Province will continue
to experience decreasing pasture production from natural veld. Both NWP and LP are
predominantly rural and many families in these provinces are dependent on agriculture as a social
and economic driver. Therefore the prevailing drought condition, if not taken into consideration,
has a high potential to reduce the livelihood condition of the communities in the affected areas. To
minimize the impact of the drought conditions, the North West Department of Agriculture has
already, since December 2012, distributed fodder to the most vulnerable farmers in the province.
More than R6 million of fodder was distributed to more than 1300 farmers to maintain in excess of
15000 large stock units.

Current ENSO conditions
The Sea Surface Temperature (SST) anomaly in the Nino3.4 region has been in the neutral range
through mid-May 2013. For April 2013 the Nino 3.4 SST anomaly was -0.10 C, indicative of
neutral ENSO conditions, and for February-April it was -0.24 C. The IRI's definition of El Niño, like
the NOAA/Climate Prediction Center's, requires that the SST anomaly in the Nino3.4 region (5S-
5N; 170W-120W) exceeds 0.5 C. Similarly for La Niña, the anomaly must be -0.5 C or less. Table
1 shows how El Niño conditions vary seasonally for each 3-month season. The most recent
weekly SST anomaly in the Nino3.4 region was -0.1 C, indicating neutral ENSO conditions in the
tropical Pacific; this is the same as the -0.10 C level observed in March.

Table 1. IRI Probabilistic ENSO prediction for Nino3.4 region
 Season          La Niña (%)   Neutral (%)     El Niño (%)
 MJJ 2013             21            77               2
 JJA 2013             23            67               7
 JAS 2013             27            60              12
 ASO 2013             28            58              14
 SON 2013             28            58              14
 OND 2013             26            60              14
 NDJ 2014             23            60              14
 DJF 2014             22            65              13
 JFM 2014             21            65              14
Source: http://iri.columbia.edu/climate/ENSO/currentinfo/archive/201305/figure3.html

                                                    5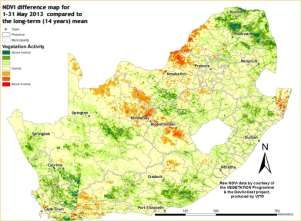
Seasonal Forecast for June to August 2013
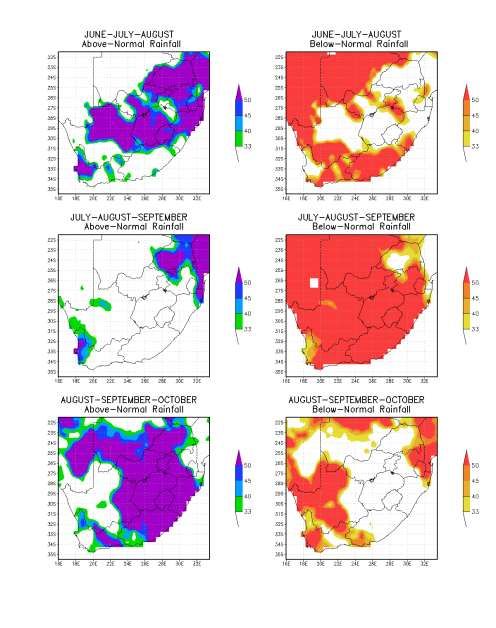
Probabilities for above-normal rainfall conditions over the central and northeastern part of South
Africa are forecasted during the period spanning from June to August. The forecasting system
indicates greater probabilities for above-normal rainfall conditions over NWP during July to
September. In late winter the forecasting system indicates raised probabilities for above-normal
rainfall conditions over both NWP and LP (Figure 7).
Figure 5: Climatic conditions for Louwna weather station in North West Province
Figures 5 and 6 illustrate the importance of understanding the climatic conditions of a specific
area of farming activities. It is advisable to use the seasonal forecast with the necessary caution
as the major climate drivers which govern the climate system of our region and the knowledge of
local climatic data is also very important for accurate decision making. It is also recommended
that shorter timescale forecasts be monitored for the development of conditions that may change
the current forecast as some of the climate drivers may have a greater influence over the current
weather pattern in a relatively short period.
Above-normal rainfall conditions for the period from June to August are illustrated in Figure 7 and
according to Figure 5 there is an elevated probability to receive above 3.8mm rainfall from June to
August in Louwna, NWP. Raised probabilities for above-normal rainfall conditions during late
winter over LP are indicated by Figure 7 and according to Figure 6 there is an elevated probability
to receive 13mm of rainfall in Polokwane during late winter (ASO) season.
Figure 6: Climatic conditions for Polokwane weather station in Limpopo Province
The minimum temperature (night temperature) forecast system is indicating warmer conditions
than normal for most of South Africa with the exception of the southwestern parts for which cooler
conditions are expected during June to August (see Figure 8).
6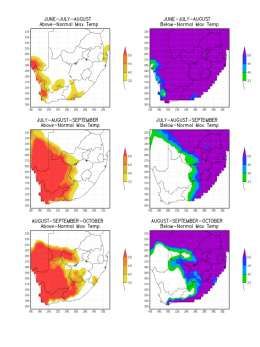
The likelihood of mid-winter maximum temperatures (day temperatures) is forecast to become
below-normal over LP and the eastern parts of NWP. The tendency of warmer maximum
temperature (day temperatures) is gradually expanded from the west of NWP during early spring.
LP will continue to experience below-normal maximum temperatures (day temperatures) during
early spring (see Figure 8).

Figure 7: Probabilistic above-normal and below-normal rainfall forecast for three
overlapping seasons valid for the period of June to August 2013

Source: http://www.weathersa.co.za/web/images/LongRange/gfcsa/SCOLF20130422.pdf

                                               7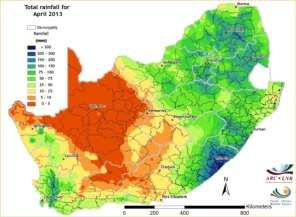
Figure 8: Probabilistic maximum (left panel) and (right panel) minimum temperature
forecasts for the three overlapping seasons valid for the period of June to August 2013

Source: http://www.weathersa.co.za/web/images/LongRange/gfcsa/SCOLF20130422.pdf

Maize production in Limpopo and North West Province

Table 2: Water and temperature impacts on maize production
                                                                                                                  CLIMATIC IMPACTS
                                  Water Requirements                                                                                                     Temperature Requirements (°C)
                                                                                             Minimum Summer                    Maximum Summer
                           Dry Land                                Irrigation                                                                                                                   Day Length
                                                                                               Temperatures                      Temperatures
Maize

         Minimum
                           Critical Growing Stage Crop      Critical Growing Stage Water
           Range                                                                           Extreme   Requirements During   Extreme   Requirements During             Long Days                                     Short Days
                            Damage During Drought                    requirements
        Precipitation

                                                 Soft and                       Soft and                           All                             All
                        Vegetative                        Vegetative                                                                                    Germination Vegetative
                                   Pollination     Hard              Pollination Hard                Germination Growth              Germination Growth                        Pollination   Soft and Hard Dough                Drying of Kernels
                          Stage                             Stage                                                                                          Stage      Stage
                                                  Dough                          Dough                           Stages                          Stages
                  2-3% Crop
        250-300mm           7-10% Crop 4.5% Crop                                           5-19°C                          30-48°C
                   Damage
                              Damage     Damage 4mm per
                     per                                             8.5-12mm     5.7 mm             Below 10°C    26°C                 13°C      30°C     Summer     Summer     Summer            Winter                            Winter
                            per Wilting per Wilting day
                   Wilting
                                Day         Day
                     Day

Water and temperature play a major role in maize production. The minimum water requirements
for maize production under dry-land range from 250-300mm of rainfall and under irrigation the
range is from 8.5-12mm per day during the pollination phase.

Why is this explanation and seasonal weather forecasts of critical importance?
  1. Climate largely determines the success or failure of food production
  2. More than 70% of the food and nutrition insecure people are rural and therefore directly or
      indirectly dependent on agriculture as their livelihood. Seasonal weather forecasts as
      planning tool can largely change food and nutrition insecurity to food and nutrition security

                     Growth originating in agriculture is almost three times more effective in reducing
              poverty than growth in any other sector of the economy. This was reiterated during a 2013

                                                                                                                           8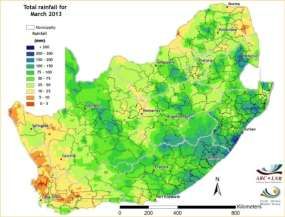
international Food Security Futures Conference. You are the farmers; you have the
       responsibility not only of food production but of food security, poverty reduction, and of
       economic growth in South Africa.
                The rural population is expected to peak between 2020 and 2050 which could
       mean intensified and exponential rural poverty and food and nutrition insecurity. Only you,
       our food producing farmers, can prevent a future catastrophe.
                Farmers would be wise to base their agricultural production planning on
       scientifically-based seasonal weather forecasts

Disclaimer:
The ARC-ISCW and its collaborators have obtained data from sources believed to be reliable and
have made every reasonable effort to ensure accuracy of the data. The ARC-ISCW and its
collaborators cannot assume responsibility for errors and omissions in the data nor in the
documentation accompanying them. The ARC-ISCW and its collaborators will not be held
responsible for any consequence from the use or misuse of the data by any organisation or
individual.

For further information please contact the following:
Obed Phahlane        012 310 2520         Phahlaneo@arc.agric.za;
Mahlate Phuthi       012 319 6668         MahlatseP@daff.gov.za
Kentse Setshedi      012 319 2967         Kentses@daff.gov.za
Adri Laas             012 310 2518        iscwinfo@arc.agric.za

                                                9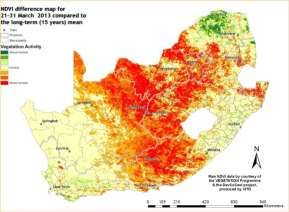
You can also read