In-Situ and Real-Time Monitoring of Oxygen Evolution during Kolbe Reaction by Scanning Electrochemical Microscopy
←
→
Page content transcription
If your browser does not render page correctly, please read the page content below
Int. J. Electrochem. Sci., 16 (2021) Article ID: 210240, doi: 10.20964/2021.02.31

                                                                         International Journal of
                                                                         ELECTROCHEMICAL
                                                                                 SCIENCE
                                                                                www.electrochemsci.org

In-Situ and Real-Time Monitoring of Oxygen Evolution during
Kolbe Reaction by Scanning Electrochemical Microscopy
Zemin Yu1, Yuanbo Wang1,2, Xingyan Cao2, Yihan Li2, Tianen Ma2, Liqiu Zhang2,*,
Lichun Liu2, Hongyan Yue1,*
1
  School of Materials Science and Engineering, Harbin University of Science and Technology, Harbin
150040, China.
2
  Nanotechnology Research Institute & College of Biological, Chemical Science and Engineering,
Jiaxing University, Jiaxing, 314000, China
*
 E-mail: liqiu0524@zjxu.edu.cn, hyyue@hrbust.edu.cn

Received: 9 November 2020 / Accepted: 12 December 2020 / Published: 31 December 2020

In this study, the oxygen evolution during the Kobe reaction was in-situ and real-time monitored by
scanning electrochemical microscopy (SECM) in tip-generation substrate-collection (TG/SC) mode. A
typical Kolbe reaction involving the acetate electro-oxidation was used as a study model. To this end,
the TG/SC method of acetate electro-oxidation was performed at a 10 μm-diameter tip Pt disk
microelectrode positioned ~1.2 μm away from a 50 μm-diameter substrate Pt disk microelectrode. The
substrate Pt was employed as an efficient catalyst to monitor the byproduct O2 produced at the tip by
the catalytic reduction at an appropriate electrode potential. The linear scanning voltammetry (LSV)
results indicated that O2 evolution during acetate oxidation depended on both the electrode potential
and acetate concentration. At low potentials (2.4V) and elevated concentrations of acetate, resulting in
better current efficiencies of acetate oxidation. The inhibition effect of O2 evolution was also
confirmed in alkaline electrolytes, consistent with the reported literature dealing with other traditional
detection techniques. In sum, the proposed detection technique based on in-situ and real-time dynamic
monitoring of oxygen evolution was accurate and sensitive, thereby promising for the study of broad
range of reactions involving the generation of oxygen species.

Keyword: Microelectrodes, Kolbe reaction, oxygen evolution, SECM, TG/SC

1. INTRODUCTION

       Hydrocarbon molecules can be electrochemically synthesized at the anode through the
oxidization of carboxylate anions in aqueous solutions, known as the Kolbe reaction [1-7]. During this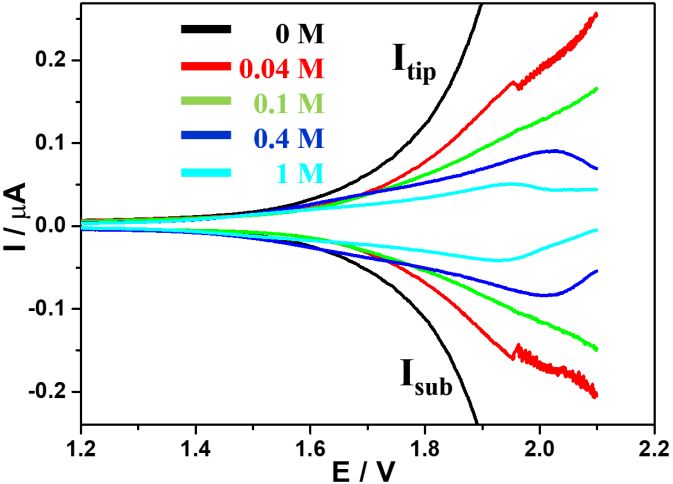
Int. J. Electrochem. Sci., 16 (2021) Article ID: 210240                                               2

reaction, oxygen species are unavoidably involved as a byproduct since the electrode potential is above
that required for water electrolysis (1.23 V vs. SHE). However, in-situ and real-time monitoring of O2
evolution are scarce and not well reported. Therefore, the development of in-situ and real-time
methods for proper investigation of the oxygen evolution behavior is highly desirable for a better
understanding of the reaction processes and optimization of the electro-oxidation conditions for
achieving better reaction efficiencies. In the past, researchers have used scale experiments to
investigate the kinetics of the by-product O2 during the Kolbe reaction at various electrode potentials
by additional equipment, such as gas chromatography [8]. Such strategies are rather tedious,
inefficient, and less accurate since they rely on complex ex-situ and asynchronous operation. By
contrast, in-situ and real-time detection of O2 during Kolbe reaction would be more preferred due to
the convenience, high efficiency, and better accuracy.
        Scanning electrochemical microscopy (SECM) is a powerful technique for probing the
environment around microscale spaces using tip generation and substrate collection (TG/SC) mode [9-
11]. The use of microelectrodes (Φ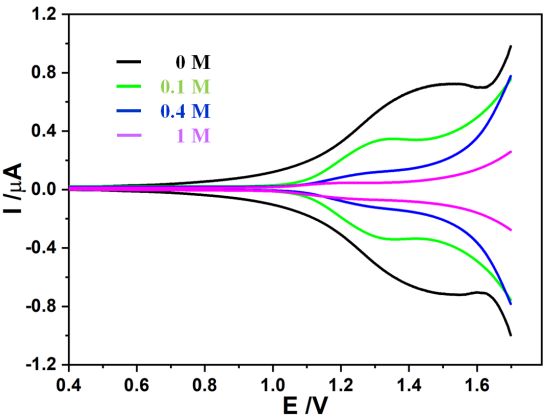
Int. J. Electrochem. Sci., 16 (2021) Article ID: 210240                                               3

Aldrich and used as received without further purification. Borosilicate glass capillaries (O.D. 2 mm,
I.D. 1.16 mm) were purchased from Sutter Instrument. All solutions were prepared with deionized (DI)
water (18.2 MΩ·cm-1) obtained from a Milli-Q water purification system. All electrochemical
experiments were carried out after purging high-purity inert He gas for at least 30 min to eliminate the
dissolved oxygen.

2.2 Equipment

        Scanning electrochemical microscopy (SECM 920D, CH Instrument) was used for data
acquisition. Pt disk microelectrodes with diameters of 10 µm and 50 µm were used as the tip and
substrate, respectively. A Pt wire was employed as a counter electrode and Ag/AgCl (1 M KCl) as a
reference electrode. The Pt substrate microelectrode was mounted at the bottom of a Teflon
electrochemical cell. Next, two disk microelectrodes were set in close contact with each other at a
distance of ~1.2 μm. The final setup is schematically displayed in Figure 1 (cell not shown).

           Figure 1. Structural scheme showing the tip and substrate disk microelectrodes.

2.3 Methods

2.3.1 Microelectrode fabrication

         Glass capillary encapsulated Pt microelectrodes were fabricated by the methods reported in the
literature [17]. Typically, one end of a 10 cm capillary was first sealed by methane-oxygen firing. A 1
cm Pt micro-wire was then carefully placed inside a capillary from the open end to the sealed end.
After vacuuming the capillary, about 0.5 cm Pt wire was further sealed by electric coil heating. Next,
Ag conductive glue was injected into the capillary, and a Cu wire was inserted into the conductive
glue. The glue was consolidated in a 120oC oven for 2 h to produce an electrical connection. The
cross-section of the microelectrode was similar to that shown in Figure 1.
         Sandpapers were employed for glass removal from the sealed end until exposure of the Pt wire
at the flat glass surface. The whole polishing process was completed with the assistance of an optical
microscope.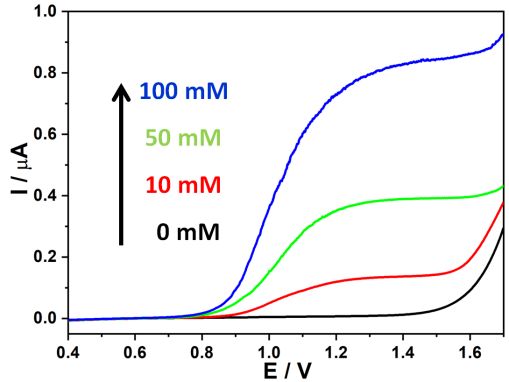
Int. J. Electrochem. Sci., 16 (2021) Article ID: 210240                                                 4

3. RESULTS AND DISCUSSION

3.1 Tip and substrate microelectrodes positioning and testing

        In this work, a tip microelectrode was prepared by borosilicate glass capillary encapsulation
followed by tip polishing to a small RG value ~3. Note that RG was defined as the ratio of the tip
diameter (including the glass sheet) to the inside wire diameter. The substrate microelectrode was
encapsulated using a 2 mm-diameter borosilicate glass capillary (length ~7 cm) polished to a relatively
smooth surface. Under naked eyes, two microelectrodes were coarsely arranged face-to-face and an
electrolyte containing 10 mM RuHex and 0.1 M KCl was injected into the cell. Negative feedback was
used to move the tip to the substrate for closely approaching the two microelectrodes. The movement
of the tip was stopped when the current at the constant potential of -0.3 V (Ru3++e-→Ru2+) showed a
quick decrease due to the strong limitation in ion diffusion to the tip. At such a small distance, the
products produced at one microelectrode were readily captured by the other. To determine the accurate
position between the two microelectrodes, positive feedback was employed. A constant potential of -
0.3 V was applied to the tip and 0 V was employed to the substrate (Ru2+-e-→Ru3+). In this setup, the
electric currents at both the tip and substrate underwent a dramatic increase when approached within
micrometers.

Figure 2. (a) SECM imaging of a 50 μm substrate microelectrode used for positioning of the probe and
       substrate microelectrodes. (b) A typical negative approach curve. (c) Linear scanning
       voltammogram of a 10 μm Pt microelectrode in 0.1 M HClO4 electrolyte. (d) Linear scanning
       voltammogram obtained in generation and collection mode in 0.1 M HClO4 electrolyte.
       Conditions: substrate potential of 0 V and scan rate of 50 mV/s.

       To find the substrate, a line-by-line scanning was first conducted and then determined when an
increase in current was recorded as a result of consumption of ions generated at the tip by the substrate.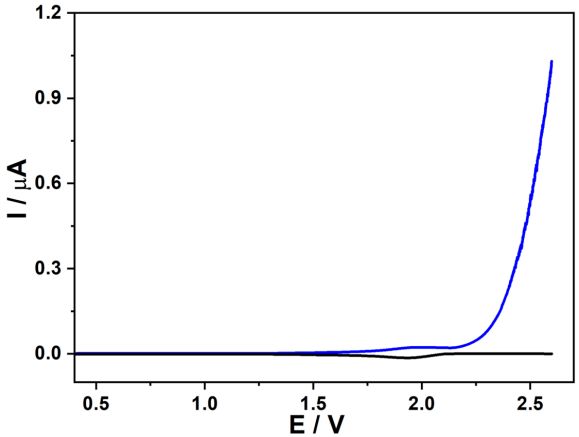
Int. J. Electrochem. Sci., 16 (2021) Article ID: 210240                                               5

This type of measurement was denoted as positive feedback. Upon establishment of the feedback
between the tip and substrate, SECM imaging of the substrate was performed to precisely locate the tip
at the concentric position above the substrate (Figure 2a). The precise positioning between the tip and
substrate allowed the determination of the relative distance (d~1.2 μm) by fitting the positive feedback
equation to an approaching curve (Figure 2b).
        To acquire a proper potential of O2 reduction, LSV was used, and the cathodic scanning from
1.2 V to -0.5 V in 0.1 M HClO4 electrolyte is shown in Figure 2c. Clear current steps induced by the
oxygen reduction reaction (ORR) and hydrogen evolution reaction (HER) were noticed, suggesting the
effective reduction of O2 at potentials between -0.37 V and 0.08 V in 0.1 M HClO4 electrolyte.
        TG/SC is a powerful technique in SECM [10, 18], which strongly depends on how close the tip
and substrate were so that the products produced at the tip microelectrode can effectively be probed by
the substrate microelectrode. To sensitively probe the generated products at the tip, the size of the
substrate microelectrode was set to slightly larger than that of the tip. The feasibility of using the
substrate to probe O2 generated at the tip was next investigated, and the results are provided in Figure
2d. Symmetrical LSV curves corresponding to OER and ORR were obtained. The close proximity
between the two microelectrodes combined with the fast diffusion of gas molecules and good catalytic
activity of Pt [19] led to immediate reduction of tip generated O2 molecules at the substrate at the
potential of 0 V. Hence, TG/SC experimental results suggested that the proposed method was useful
for in-situ and real-time monitoring of changes in O2 concentration near the substrate.

3.2 Acetate electro-oxidation

        Acetate electro-oxidation is a typical Kolbe reaction [20]. During acetate electro-oxidation,
large numbers of radicals would be generated and could combine to yield symmetrical dimers and/or
unsymmetrical coupling alkanes. The mechanism of acetate electro-oxidation can be summarized by
the reactions below [8, 21-23]:
        CH3COO-→CH3COO·+e-
        CH3COO·→CH3·+CO2↑
        2CH3·→CH3-CH3↑
        CH3·→CH3+ + e-
        Since the decarboxylation of acetate anions required larger overpotentials (>1.23 V vs. SHE),
electrolysis of water molecules (2H2O→4H++4e-+O2↑) will take place. Because the water
concentration as a solvent [24] reached as high as 55.6 mol/L, the O2 evolution from water seriously
influenced the electro-oxidation efficiency of acetate anions at certain electrode potentials.
Int. J. Electrochem. Sci., 16 (2021) Article ID: 210240 6
Figure 3. TG/SC LSV curves in 0.1 M HClO4 electrolyte of acetate at different concentrations: 0 M
(black), 0.04 M (red), 0.1 M (green), 0.4 M (blue), and 1 M (cyan). Conditions: Esub of 0 V and
scan rate of 50 mV/s.
In absence of acetate in 0.1 M HClO4 electrolyte, the anodic scanning current at the tip was
produced by OER of water. The current at the substrate was linked to the reduction of O 2 molecules.
The high catalytic activity of Pt for both OER and ORR led to elevated efficiencies of generation and
collection of O2. As shown in the black trace of Figure 3, the ratio of Isub/Itip reached almost 100%.
Meanwhile, the current reached greatest values in absence of acetates in the electrolyte when compared
to other contrast curves obtained in the presence of acetate. In Figure 3, the current levels at the tip
decreased as acetate concertation increased. The current disturbance in the red curve (0.04 M) was
ascribed to the presence of large amounts of gas bubbles generated at more positive potentials. In other
words, bubbles landed on the microelectrode surface and then left were the cause of current
disturbances. At an acetate concentration of 0.4 M, a further decrease in Itip was observed when
compared to the value obtained at lower concentration of acetate. In particular, a transition in Itip
appeared at 2.04 V (blue curve in Figure 3), and Itip kept decreasing at potentials above 2.04 V. Such a
potential transition shifted negatively to 1.95 V when the acetate concentration was further raised to 1
M (cyan curve in Figure 3). In sum, TG/SC results showed a strong effect of acetate concentration on
OER. In other words, higher concentrations of acetate led to lower currents of OER. The dynamic
transition of OER was observed at high electrode potentials in HClO4 electrolyte at elevated acetate
concentrations.Int. J. Electrochem. Sci., 16 (2021) Article ID: 210240 7
Figure 4. The effect of NaOH concentration on OER.
The changing trend of the anodic scanning current in Figure 3 was not only caused by the
variation in acetate concentration but also pH since the acetate solution was alkaline. Therefore, further
experiments using alkaline electrolytes were conducted. In 0.1 M NaClO4 electrolyte, the onset
potential of OER was around 1.4 V (black curve in Figure 4). Note that the presence of 10 mM NaOH
in 0.1 M NaClO4 electrolyte induced two transition potentials (red curve in Figure 4). The much
smaller OER potential (0.91 V) corresponded to the oxidation of OH- on Pt (4OH-→O2+2H2O+4e-),
and the greater potential (1.55 V) was linked to the oxidation of H2O (2H2O→O2+4H++4e-). The latter
reaction was reasonable because higher electrode potentials could induce elevated reaction rates to
produce local depletion regions without or trace OH- near the Pt surface. Further increase in NaOH
concentration to 50 mM (green curve) and 100 mM (blue curve) led to obvious enhancement in the
oxidation current of OH-, and the oxidation potential of H2O slightly shifted to greater values.
Figure 5. TG/SC LSV curves obtained at different acetate concentrations in 10 mM NaOH and 0.1 M
NaClO4 electrolyte. Black, green, blue and cyan curves correspond to 0, 0.1, 0.4 and 1 M
acetate in the electrolyte, respectively. Conditions: Esub of -0.6 V and scan rate of 50 mV/s.Int. J. Electrochem. Sci., 16 (2021) Article ID: 210240 8
Since acetate as a weak base did not significantly change the pH of the strong alkaline solution,
10 mM NaOH electrolyte was employed as a strong base to control the pH. Because Pt had different
catalytic activities at different pH values, the collection potential value in the previous case was not
applicable and a new value was required [25]. In LSV testing, -0.6 V was determined as the effective
potential for ORR at the substrate but did not induce HER in the electrolyte containing 10 mM NaOH
and 0.1 M NaClO4. Hence, a potential value of -0.6 V was applied at the substrate to collect the O2
generated from the tip. By adding different concentrations of acetate into the alkaline electrolyte, LSV
curves were obtained during TG/SC scans (Figure 5). Clearly, the OER performance decreased as the
concentration of acetate increased. These results were similar to those obtained in the acidic
electrolyte.
Figure 6. LSV TG/SC curves of 1 M acetate in 0.1 M HClO4. Conditions: Esub of -0.6 V and scan rate
of 50 mV/s.
From TG/SC LSV results in acidic and alkaline electrolytes, high acetate concentrations and
elevated electrode potentials jointly inhibited the OER. Thus, the electrode potential was further
extended to 2.6 V using 1 M acetate in 0.1 M HClO4. As shown in Figure 6, a bump was visible in
LSV curves on both the tip and substrate. The upward bump obtained for the tip anodic scanning and
downward bump observed for the substrate collection corresponded to the OER and ORR,
respectively. Above 2.18 V, the OER was entirely inhibited because no ORR occurred at the substrate.
Meanwhile, a dramatic current increase appeared for the tip above 2.18 V, which should be related to
the oxidation of pure acetate without the occurrence of OER since no O2 molecules were detected at
the substrate. Therefore, OER occurred only at relatively low electrode potentials during acetate
oxidation. At high electrode potentials, the OER reaction was inhibited, giving rise to only oxidation of
acetate. The results associated with the inhibition of OER during acetate oxidation were consistent
with previously reported literature and linked to the Kolbe reactants, oxygen-containing species, and
adsorbed intermediates20.Int. J. Electrochem. Sci., 16 (2021) Article ID: 210240 9
Figure 7. Chronoamperometry showing the inhibition effect at applied potentials of 2.4 V at the tip
and -0.6 V at the substrate. Conditions: electrolyte containing 1 M acetate in 0.1 M HClO4.
To further confirm the inhibition effect during TG/SC experiments, a high constant potential
was held at 2.4 V for the tip and -0.6 V for the substrate (Figure 7). As evidenced by the ground level
of Isub, no O2 was detected at the substrate. Thus, OER was completely inhibited at such high electrode
potentials and elevated concentrations of acetate. The dramatic current fluctuation at the tip was caused
by the large quantities of produced gas bubbles made of CO2 and ethane, among others, consistent with
data of Figure 6. All experimental results showed that OER can be effectively inhibited at joint
conditions of elevated anodic potentials and high acetate concentrations. One reasonable explanation
for such an inhibition phenomenon had to do with the decarboxylation, which predominated the
reaction through intermediate adsorption [26]. More information about the origin of the inhibition
cannot be provided since the present TG/SC technique cannot effectively detect other intermediates
and products.
4. CONCLUSIONS
TG/SC mode in SECM was successfully employed for in-situ and real-time monitoring of
oxygen evolution behavior during a typical Kolbe reaction. The OER dominated the oxidation current
at lower oxidation potentials both in acidic and alkaline media. However, high electrode potentials and
elevated acetate concentrations inhibited the OER, thereby improving the oxidation efficiency of
acetate oxidation. Though TG/SC technique was found useful for in-situ and real-time detection of O2
generated during the Kolbe reaction, other products (such as ethane and CO2) cannot be detected like
O2. In sum, other reaction products, byproducts, or intermediates also played important roles in the
reaction efficiency, which require future exploration using TG/SC technique.
ACKNOWLEDGEMENT
This work was financially supported by the Zhejiang Provincial Natural Science Foundation of China
(Grant Nos. LQ20B010012 and LY20B030007).Int. J. Electrochem. Sci., 16 (2021) Article ID: 210240 10
References
1. J.-i. Yoshida, K. Kataoka, R. Horcajada, A. Nagaki, Chem. Rev., 108 (2008) 2265.
2. F. Lebreux, F. Buzzo, I. Marko, ECS Trans., 13 (2008) 1.
3. M. D. Karkas, Chem. Soc. Rev., 47 (2018) 5786.
4. H. J. Schäfer, Kolbe Reactions, In Comprehensive Organic Synthesis, Trost, B. M.; Fleming, I., Eds.
Pergamon: 1991.
5. T. Laue, A. Plagens, T. Laue, A. Plagens, Kolbe Electrolytic Synthesis. Blackwell Science: 2005.
6. J. Schwarz, B. König, Green Chem., 20 (2018) 323.
7. R. Arrigo, M. Hävecker, M. E. Schuster, C. Ranjan, E. Stotz, A. Knop-Gericke, R. Schlögl, Angew.
Chem. Int. Ed., 52 (2013) 11660.
8. X. Peng, T. Omasta, X. Zhao, W. E. Mustain, ECS Trans., 85 (2018) 29.
9. C. G. Zoski, J. Electrochem. Soc., 163 (2016) H3088.
10. Allen J. Bard, M.V. Mirkin, Scanning Electrochemical Microscopy. CRC Press: 2012.
11. S. Amemiya, A. J. Bard, F.-R. F. Fan, M. V. Mirkin, P. R. Unwin, Ann. Rev. Anal. Chem., 1 (2008)
95.
12. T. Kai, M. Zhou, Z. Duan, G. A. Henkelman, A. J. Bard, J. Am. Chem. Soc., 139 (2017) 18552.
13. Q. Zhang, P. Liu, Z. Zhu, J. Zhang, F. Cao, Corros. Sci., 164 (2020) 108312.
14. Q. Zhang, Z. Zhu, P. Liu, J. Zhang, F. Cao, J. Electrochem. Soc., 166 (2019) C401.
15. Q. Zhang, Z. Ye, Z. Zhu, X. Liu, J. Zhang, F. Cao, Corros. Sci., 139 (2018) 403.
16. X. Y. Wang, Y. Xia, Y. R. Zhou, L. L. Nie, F. H. Cao, J. Q. Zhang, C. N. Cao, Acta Metall. Sin., 51
(2015) 631.
17. C. G. Zoski, Electroanal., 14 (2002) 1041.
18. L. Johnson, D. A. Walsh, J. Electroanal. Chem., 682 (2012) 45.
19. K. Eckhard, X. Chen, F. Turcu, W. Schuhmann, Phys. Chem. Chem. Phys., 8 (2006) 5359.
20. A. K. Vijh, B. E. Conway, Chem. Rev., 67 (1967) 623.
21. L. Eberson, Electrochim. Acta, 12 (1967) 1473.
22. V. A. Grinberg, Y. B. Vassiliev, Russ. J. Electrochem., 32 (1996) 281.
23. D. F. A. Koch; R. Woods. Electrochim. Acta, 13 (1968) 2101.
24. L. Schulz, S. R. Waldvogel, Synlett, 30 (2019) 275.
25. X. Ge, A. Sumboja, D. Wuu, T. An, B. Li, F. W. T. Goh, T. S. A. Hor, Y. Zong, Z. Liu, ACS Catal.,
5 (2015) 4643.
26. B. E. Conway, B. V. Tilak, Adv. Catal., 38 (1992) 1.
© 2021 The Authors. Published by ESG (www.electrochemsci.org). This article is an open access
article distributed under the terms and conditions of the Creative Commons Attribution license
(http://creativecommons.org/licenses/by/4.0/).You can also read