Illinois Otter Trapper Report - Human Dimensions
←
→
Page content transcription
If your browser does not render page correctly, please read the page content below
HumanDimensions                              2014-2015
R e s e a r c h   P r o g r a m
                                   Illinois Otter Trapper Report

 Illinois Natural History Survey
     Prairie Research Institute
      University of Illinois at
        Urbana-Champaign

     Federal Aid Project
    Number W-112-R-24
     Job Number 101.2
   Supplemental Report
    Wildlife Restoration
Oct. 1, 2014-Sept. 30, 2015        Craig A. Miller, Ph.D.
                                   Program Leader and Principal Investigator
  Wayne Rosenthal, Director        Human Dimensions Research Program
Illinois Department of Natural
           Resources               Illinois Natural History Survey

        Paul Vehlow
   Federal Aid Coordinator
                                   Prepared by
       Mark G. Alessi              Brent D. Williams, Linda K. Campbell,
        Acting Chief
     Division of Wildlife          Laura A. Schweizer, and Craig A. Miller,
         Resources

                                   INHS Technical Report 2015 (27)
                                   August 31, 2015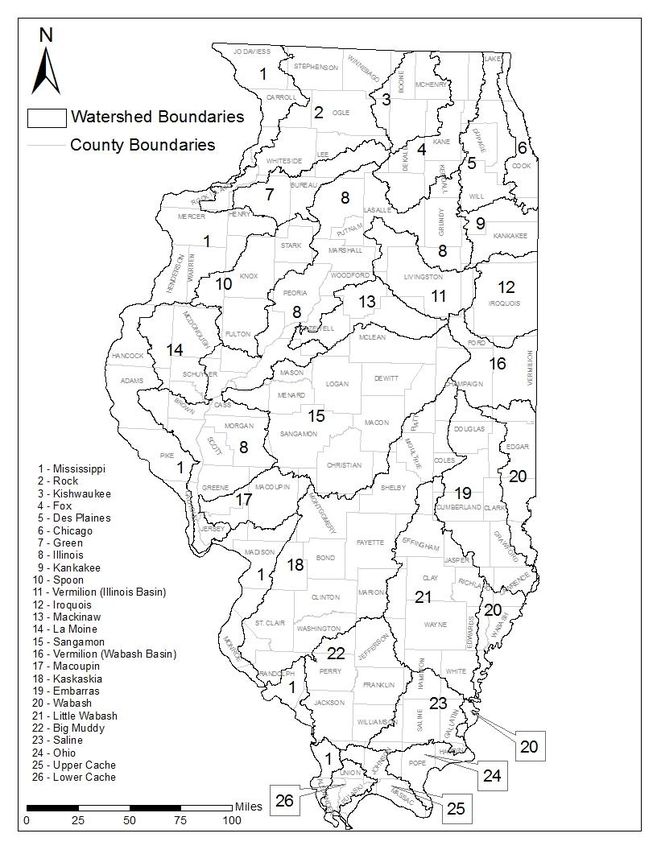
Key words: trapper effort, otter harvest, marketing practices, satisfaction

Suggested Citation:
Williams, B.D., L.K. Campbell, L.A. Schweizer, and C.A. Miller. 2015. 2014-2015 Illinois Otter Trapper Report. Job
Completion Report, Federal Aid in Wildlife Restoration W-112-R-24. Human Dimensions Research Program
Supplemental Report/INHS Technical Report 2015 (27). Illinois Natural History Survey, Champaign, IL. 27pp.
LIST OF TABLES, FIGURES, AND APPENDICES
                                                                                                                                                                                                         Page
Figure 1 .................... Distribution of 2014-2015 otter harvest by watershed ..................................................................................................... 4
Figure 2 .................... Percent change in otter harvest from 2013-2014 to 2014-2015 trapping seasons by watershed .................................... 5
Figure 3 .................... Satisfaction with time it took to receive CITES tag .......................................................................................................... 6
Figure 4 .................... Comparative satisfaction between the 2013-2014 and 2014-2015 otter trapping seasons.............................................. 6
Figure 5 .................... Trappers primary target species........................................................................................................................................ 7
Figure 6 .................... Number of conditions trappers sell their catch................................................................................................................. 8
Figure 7 .................... Percentage of trappers selling catch whole, skinned, etc. ................................................................................................ 8
Figure 8 .................... Gender distribution ............................................................................................................................................................ 9

Table 1 ..................... Participation and harvest by otter trappers ..................................................................................................................... 10
Table 2 ..................... Distribution of male and female otters trapped in each watershed ................................................................................. 10
Table 3 .................... Total otter harvest during 2013-2014 and 2014-2015 trapping seasons by watershed .................................................. 11
Table 4 .................... Number of otters captured in Illinois for the 2014-2015 trapping season by trap target .............................................. 11
Table 5 .................... Number of otters trapped in a targeted otter trap ........................................................................................................... 12
Table 6 .................... Number of otters trapped in a targeted raccoon trap ...................................................................................................... 12
Table 7 ..................... Number of otters trapped in a targeted beaver trap ........................................................................................................ 12
Table 8 ..................... Average number of traps set on traplines ......................................................................................................................... 12
Table 9 ..................... Number of days/nights that traps were set........................................................................................................................ 13
Table 10.................... Number of days/nights that otter traps were set............................................................................................................... 13
Table 11.................... Distribution of active trappers by county trapped most often ......................................................................................... 14
Table 12.................... Participant satisfaction with the 2014-2015 otter trapping season .................................................................................. 15
Table 13.................... Number of trappers who trapped only on public land .................................................................................................... 15
Table 14.................... Number of years spent furbearer trapping ....................................................................................................................... 16
Table 15.................... Participant frequency of furbearer trapping ................................................................................................................... 16
Table 16.................... Number of trappers who set traps for otter previous seasons ......................................................................................... 16
Table 17.................... Distribution of trappers by county of residence ............................................................................................................... 17

Appendix A .............. Illinois Otter Trapper Survey: 2014-2015 Season ............................................................................................................ 18
Appendix B .............. Cover letter sent with first mailing of the 2014-2015 Illinois Otter Trapper Survey ..................................................... 22
Appendix C .............. Thank you/reminder postcard sent as follow-up to the mailings .................................................................................... 24
Appendix D .............. Cover letter sent with second mailing of the 2014-2015 Illinois Otter Trapper Survey................................................. 25
Appendix E .............. 2014-2015 trapper season dates and limits information ................................................................................................... 27
2014-2015 ILLINOIS OTTER TRAPPER REPORT
JOB COMPLETION REPORT
WILDLIFE HARVEST AND
HUMAN DIMENSIONS RESEARCH PROGRAM
STATE OF ILLINOIS
PROJECT NUMBER: W-112-R-24
STUDY 101
JOB NO. 101.2
(Supplemental Report)
Prepared by
Brent D. Williams, Linda K. Campbell,
Laura A. Schweizer and Craig A. Miller
Illinois Natural History Survey
Champaign, IL
August 31, 2015
Federal Aid in Wildlife Restoration
W-112-R-24
Illinois Department of Natural Resources
Wayne Rosenthal, Director Mark G. Alessi, Acting Chief
Illinois Department of Natural Resources Division of Wildlife Resources
Equal opportunity to participate in programs of the Illinois Department of Natural Resources (IDNR) and those
funded by the U.S. Fish and Wildlife Service and other agencies is available to all individuals regardless of
race, sex, national origin, disability, age, religion, or other non-merit factors. If you believe you have been
discriminated against, contact the funding source’s civil rights office and/or the Equal Employment Opportunity
Officer, IDNR, One Natural Resources Way, Springfield, IL 62702-1271; 217/785-0067; TTY 217/782-9175.1
ABSTRACT
Illinois otter trapping was reinstated during the 2012-2013 Illinois Furbearer Trapping season. During
2014-2015, the third year of reinstatement, 495 Illinois residents who trapped an otter were provided an otter
permit; each otter trapper was mailed a 4-page questionnaire. We received 342 (74%) usable questionnaires.
During the 2014-15 season, an average of 30 traps were set per trapper over the course of 43 days or nights.
Respondents harvested an average of 2.2 otters (Lontra canadensis) for a total of 723 otters, which represented
a 25% decrease from 2013-14. Participants also harvested 15,513 raccoons (Procyon lotor), 7,410 muskrat
(Ondatra zibethicus), and 2,557 opossum (Didelphis virginiana) during the 2014-2015 Illinois trapping season.
Trapper attitudes toward wildlife related issues and marketing practices were also examined.
OBJECTIVE
To survey otter permit holders to determine their activities, harvests, characteristics, and opinions in
Illinois.
METHODS
All Illinois resident trappers who successfully harvested ≥ 1 otter are required by regulation to obtain an
otter permit (CITES tag) within 48 hours of trapping the otter, with a limit up to 5 otters per trapper. We
selected names and addresses for each of the 495 successful otter trappers from the list of otter permits provided
by the Illinois Department of Natural Resources. Each trapper was mailed a 4-page questionnaire (Appendix A),
cover letter (Appendix B), and a postage-paid return envelope on 3 April 2015. Nonrespondents were mailed a
thank you/reminder postcard (Appendix C) on 23 April 2015. On 7 May 2015, remaining nonrespondents were
mailed a second questionnaire and cover letter (Appendix D). Trappers who did not respond to the previous
mailings were mailed a second thank you/reminder postcard on 27 May 2015. The initial sample of 495 licenses
was reduced to 491 due to undeliverable addresses; 29 survey questionnaires received were incomplete and not
used. Season date information is located in Appendix E.2
RESULTS
A total of 371 license purchasers responded to the survey; 342 (74%) were considered usable.
Harvest
All 342 respondents indicated they set traps for furbearers in Illinois during the 2014-15 season. These
trappers reported they also harvested raccoons (15,513), muskrat (7,410), beaver (2,578) and opossum (2,557)
most frequently (Table 1). In order of frequency, otters were the sixth furbearer trapped in Illinois. Respondents
trapped a total of 723 otters during the 2014-15 trapping season, a decrease of 25% from the harvest reported
for the 2013-14 season. Over one-third of otter pelts were sold in Illinois (38%), whereas approximately 37%
were sold or shipped out of state and 25% were not sold at all.
Male otters were trapped more frequently than female otters in every watershed but three: the Des
Plaines, Kankakee, and Spoon watersheds (Table 2 and Figure 1). The Mississippi watershed presented the
highest incidence of otter harvest throughout the state (144 otters); the Kaskaskia, Little Wabash and Big
Muddy watersheds followed with 107, 82, and 58 otters, respectively. Sixteen of the 26 watersheds showed
decreased harvest, 7 showed increased harvest, two showed no change, and the Chicago River watershed had no
otters harvested in either year (Table 3 and Figure 2).
Respondents reported 380 otters were caught in targeted otter traps during the 2014-15 trapping season
(Table 4). Another 66 otters were caught as secondary targets in targeted raccoon traps, and 213 otters in
targeted beaver traps. Of the 183 respondents who set traps targeting otters primarily, 49.7% trapped one otter,
18.6% trapped 2 otters, and 31.7% trapped 3 or more (Table 5). Those who targeted raccoon (n=53) and beaver
(n=149) primarily with otters as secondary targets trapped one (83.0% and 73.8%, respectively) and two (9.4%,
17.4%) otters most frequently (Tables 6-7).
Season Length and Otter Trapper Effort
The maximum days allowable for otter trapping during the 2014-15 season was 147 days. Active
trappers set an average of 30 traps (Table 8) for an average of 42.5 days or nights (Table 9); 48.0% of
respondents set traps for > 30 days, and 29.2% set traps for > 50 days. Participants who targeted otters (n=282)3 spent an average of 25.6 days or nights trapping during the 2014-2015 season (Table 10). Surveyed trappers most frequently set traps in Pike county (n=18) followed by Fayette, Jackson, and Wayne counties (n=12, n=11, and n=10, respectively) during the 2014-2015 trapping season (Table 11).
4

                                                      Lower
                                                      Cache

Figure 1. Distribution of otter harvest in 2014-15 by watershed.
5
* **
*
*
*
*
Lower
Cache
Figure 2. Percent change in otter harvest from 2013-14 to 2014-15 trapping seasons by watershed.
*Indicates watersheds with fewer than 10 otters harvested during both seasons.6
Satisfaction with Otter Trapping in Illinois
More than 49% of respondents (49.1%) indicated they were “Very Satisfied” or “Extremely Satisfied”
with the length of time it took to receive their CITES tag (Figure 3). Another 27.4% indicated they were
“Moderately Satisfied,” while 11.3% indicated they were “Not at all Satisfied.” Compared to the 2013-14
season, 62.4% of participants indicated they were “Equally Satisfied” with the 2014-2015 otter trapping season,
while over 29% indicated they were “More Satisfied” (18.1%) or “Much More Satisfied” (11.5%) (Figure 4).
9.8% 11.3% Not at all Satisfied
12.2%
Slightly Satisfied
39.3%
Moderately Satisfied
27.4%
Very Satisfied
Extremely Satisfied
Figure 3. Respondent satisfaction with the length of time it took to receive their
CITES tag (n=328).
1.0%
11.5% 7.0% Much Less Satisfied
18.1%
Less Satisfied
62.4% Equally Satisfied
More Satisfied
Much More Satisfied
Figure 4. Participant satisfaction with the 2014-15 otter trapping season compared
to the 2013-14 season (n=314).7
Otter trappers were given a series of statements with which they indicated their satisfaction on a 5-point
Likert-type scale, ranging from “Very Dissatisfied” to “Very Satisfied” (Table 12). Almost two-thirds of
respondents (66.4%) indicated that they were “Satisfied” (46.8%) or “Very Satisfied” (19.6%) with the number
of otters in the area they trapped; 26.7% indicated they were “Unsure.” When asked to rate the weather
conditions during the season, nearly 56% indicated they were “Satisfied” (49.8%) or “Very Satisfied” (6.0%). A
majority of respondents (57.0%) were “Satisfied” (48.5%) or “Very Satisfied” (8.5%) with the amount of time
they spent otter trapping this season and over half (58.2%) indicated they were “Satisfied” (42.5%) or “Very
Satisfied” (15.7%) with the number of otters they trapped. More than two-thirds (68.2%) were Dissatisfied
(37.1%) or “Very Dissatisfied” (31.1%) with the otter fur prices during the season.
The primary target of the majority of Illinois trappers was raccoon (36.8%), beaver (18.7%) was selected
second-most often by trappers, followed by muskrat (Figure 5). Sixty-three trappers indicated trapping raccoon
and beaver only on public land, and sixty-one trappers trapped otters only on public land followed by 49 who
trapped muskrat only on public land (Table 13).
Raccoon 36.8%
Beaver 18.7%
Muskrat 14.9%
Otter 13.7%
Coyote 8.8%
Mink 4.4%
Red Fox 2.0%
Gray Fox 0.3%
Opossum 0.3%
0.0% 5.0% 10.0% 15.0% 20.0% 25.0% 30.0% 35.0% 40.0%
Figure 5. Trappers’ primary target species (n=342).8
Marketing information
Trappers were asked to identify what percentage of their harvest was sold in one of three conditions:
whole in carcass, skinned (fresh or frozen), or skinned (fleshed, stretched, & dried). The majority of hunters
participated in selling their harvest in a single manner (Figure 6). Trappers were most likely to participate in
selling their harvest skinned fresh or frozen (Figure 7). When restricting it to trappers that sold their catch as
whole in carcass, an average of 62.9% of the harvest was sold in that manner. When limiting it to trappers that
sold their catch as skinned fresh or frozen, an average of 85.6% of the harvest was sold that way. Similarly, of
those that sold their harvest as skinned (fleshed, stretched, and dried), a mean of 75.8% of their harvest was sold
in that manner.
3.4%
20.5%
21.2% 49.8%
75.4% 57.6%
One way Whole (in carcass)
Two ways Skinned (fresh or frozen)
All three ways Skinned (stretched & dried)
Figure 6. In how many conditions did trappers sell Figure 7. In what condition did trappers sell their
their catch. catch. Percentages greater than 100% because
12.8% of trappers sold catch in multiple conditions.
Trappers were also asked to identify what percentage of their catch was sold to one of four types of buyers:
local fur buyer, traveling fur buyer, international auctions, or auctions sponsored by a trapper’s association. The
majority (86.3%) of trappers sold to one type of buyer, 12.7% sold to two types of buyers, and 1% sold to three.
Slightly less than half of trappers (47.2%) sold to local buyers, 42.5% sold at international auctions, 19.4% sold
to traveling buyers, and 5.7% sold at trappers’ association sponsored auctions. If a trapper sold to a local buyer,
they sold an average of 84.8% of their harvest to the local buyer. Sellers to traveling buyers sold 82.3%, sellers9
to international auctions sold 92.3% at these auctions, and trappers’ association sponsored sellers had an
average of 84.7% sent to fur tappers’ association auctions.
General Information
The majority of respondents were male (96.7%) (Figure 8). During the 2014-15 season, Illinois trappers
averaged 47.7 years of age and had been trapping for an average of 22.5 years (Table 14). Slightly over half
(50.1%) of respondents indicated that they trap every year (Table 15).
Of the respondents, 108 (31%) indicated that the 2014-15 trapping season was the first season they set
traps for otter in Illinois, 146 (42.6%) had previously trapped in 2012-2013, and 204 (59.6%) had trapped in
2013-2014 (Table 16). Trapper distribution by county of residence can be found in Table 17.
3.3%
96.7%
Male Female
Figure 8. Gender distribution of otter trappers in
Illinois (n=460).10
Table 1. Participation and harvest by otter trappers during the 2014-2015 trapping season.
Number Number Sold in Number Sold or Number Not
Species Trapped Illinois Shipped Out of State Sold
Raccoon 15513 5339 8900 1274
Muskrat 7410 3186 3973 251
Beaver 2578 1164 1044 370
Opossum 2557 351 665 1541
Coyote 1083 389 512 182
Otter 723 274 270 179
Striped Skunk 475 110 93 272
Mink 423 162 237 24
Red Fox 192 74 76 42
Gray Fox 13 3 4 6
Badger 13 2 4 7
Weasel 8 - 3 5
Table 2. Distribution of male and female otters trapped in each watershed.*
Male Otters Female Otters
Watershed (n= 434) (n= 263)
Mississippi 86 58
Kaskaskia 63 44
Little Wabash 56 26
Big Muddy 38 20
Illinois 33 18
La Moine 19 11
Wabash 17 8
Saline 12 9
Embarras 12 8
Rock 12 7
Lower Cache 12 4
Vermilion (Wabash Basin) 11 4
Sangamon 9 9
Upper Cache 8 6
Ohio 8 3
Spoon 6 10
Mackinaw 6 5
Kishwaukee 6 5
Green 6 2
Iroquois 6 2
Vermilion (Illinois Basin) 4 1
Macoupin 2 1
Kankakee - 1
Des Plaines - 1
Fox - -
Chicago - -
*Information was not provided for 28 otters.11
Table 3. Total otter harvest during 2014-15 and 2013-14 trapping seasons by watershed.
2014-2015 2013-2014 Percent Change
Watershed Otter Harvest Otter Harvest from previous year
Mississippi 144 186 -23
Kaskaskia 107 96 11
Little Wabash 82 86 -5
Big Muddy 58 34 71
Illinois 51 103 -50
La Moine 30 28 7
Wabash 25 34 -26
Saline 21 32 -34
Embarras 20 24 -17
Rock 19 63 -70
Sangamon 18 12 50
Lower Cache 16 32 -50
Spoon 16 23 -30
Vermilion (Wabash Basin) 15 20 -25
Upper Cache 14 45 -69
Ohio 11 20 -45
Mackinaw 11 22 -50
Kishwaukee* 11 6 83
Green* 8 9 -11
Iroquois* 8 2 300
Vermilion (Illinois Basin)* 5 1 400
Macoupin 3 14 -79
Kankakee* 1 1 0
Des Plaines* 1 0 -
Fox* 0 4 -100
Chicago* 0 0 -
Unknown 28 63 -56
TOTAL 723 960 -25
*Indicates watersheds with fewer than 10 otters harvested during both seasons.
Table 4. Number of otters captured in Illinois for the 2014-15 trapping season by trap target.
Trap Target # of Otters
Targeted otter trap (n=183) 380
Targeted raccoon trap with otters as secondary (n=53) 66
Targeted beaver trap with otters as secondary (n=149) 21312
Table 5. Number of otters trapped in a targeted otter trap (n=183).
# of Otters % Trappers
1 49.7
2 18.6
3 13.1
4 11.5
5 7.1
Table 6. Number of otters trapped in a targeted raccoon trap with otters as a secondary target (n=53).
# of Otters % Trappers
1 83.0
2 9.4
3 7.5
4 -
5 -
Table 7. Number of otters trapped in a targeted beaver trap with otters as a secondary target (n=149).
# of Otters % Trappers
1 73.8
2 17.4
3 4.0
4 1.3
5 3.4
Table 8. Average number of traps set on traplines during the 2014-2015 trapping season (n=342).
Range-Traps Set % Trappers
1-10 23.1
11-20 26.6
21-30 22.8
31-40 7.6
41-50 7.0
51-100 10.0
>100 2.9
Average traps set = 30.013
Table 9. Number of days or nights trappers set traps during the 2014-2015 trapping season (n=342).
Total Days/Nights % Trappers
1-10 13.2
11-20 16.6
21-30 22.2
31-40 9.1
41-50 9.7
51-75 15.7
76-100 6.2
>100 7.3
Average days/nights = 42.5
Table 10. Number of days/nights participants set otter traps during the 2014-2015 season (n=282).
Total Days/Nights % Trappers
0-10 32.6
11-20 27.0
21-30 17.7
31-40 3.9
41-50 7.5
51-75 6.7
76-100 2.1
>100 2.5
Average days/nights = 25.614 Table 11. Distribution of active trappers by county in Illinois by county trapped most often (n=342). County n County n County n Adams 8 Hardin 2 Morgan 4 Alexander 1 Henderson 4 Moultrie 4 Bond 3 Henry 4 Ogle 3 Boone 2 Iroquois 5 Peoria 3 Brown 9 Jackson 11 Perry 4 Bureau 4 Jasper 7 Piatt - Calhoun 3 Jefferson 3 Pike 18 Carroll 2 Jersey 1 Pope 3 Cass 3 Jo Daviess 6 Pulaski 3 Champaign - Johnson 5 Putnam - Christian 1 Kane - Randolph 3 Clark 4 Kankakee 2 Richland 5 Clay 5 Kendall - Rock Island 3 Clinton 6 Knox 3 St. Clair 3 Coles 3 Lake - Saline 4 Cook - LaSalle - Sangamon 2 Crawford 2 Lawrence 4 Schuyler 3 Cumberland 3 Lee 2 Scott 1 De Kalb 2 Livingston 3 Shelby 1 DeWitt 1 Logan 1 Stark - Douglas 3 McDonough 5 Stephenson 8 Du Page - McHenry 3 Tazewell 5 Edgar 1 McLean 2 Union 6 Edwards 1 Macon 2 Vermilion 4 Effingham 7 Macoupin 3 Wabash 4 Fayette 12 Madison 3 Warren - Ford 3 Marion 8 Washington - Franklin 3 Marshall 2 Wayne 10 Fulton 5 Mason 6 White 4 Gallatin 2 Massac 4 Whiteside 8 Greene - Menard 2 Will - Grundy - Mercer 1 Williamson 3 Hamilton 5 Monroe 4 Winnebago 2 Hancock 5 Montgomery 1 Woodford 3
15

Table 12. Participant satisfaction with the 2014-2015 Otter Trapping Season in Illinois.
                                                       Very                                             Very
                                                    Dissatisfied   Dissatisfied   Unsure   Satisfied   Satisfied
                                                        %              %            %         %           %

Number of otters in the area you trapped (n=321).       2.8            4.1        26.7       46.8       19.6
Weather conditions during the season (n=317).           5.4           23.0        15.8       49.8        6.0
Amount of time you spent otter trapping this
season (n=316).                                         3.8           14.9        24.3       48.5        8.5
Number of otters you trapped (n=318).                  12.9           14.8        14.1       42.5       15.7
Otter fur prices during the season                     37.1           31.1        19.5       11.4        0.9

Table 13. Number of trappers who trapped only on public land (n=342).
                       Species                                               Number of Trappers

                       Raccoon                                                       63
                       Beaver                                                        63
                        Otter                                                        61
                       Muskrat                                                       49
                      Opossum                                                        29
                        Mink                                                         22
                        Skunk                                                        13
                       Coyote                                                        12
                       Red Fox                                                       10
                      Gray Fox                                                        0
                       Weasel                                                         0
                   Other – Badger                                                     1
16
Table 14. Number of years spent trapping in Illinois based on participant response to the 2014-2015 Illinois
Otter Trapper Survey (n=337).
Years % Trappers
0-10 44.5
11-20 11.0
21-30 9.2
31-40 14.2
41-50 11.6
>50 9.5
Average = 22.53 years
Table 15. Participant frequency of trapping furbearers in Illinois (n=335).
Every year Most years Occasional years Rarely Never
% 50.1 27.5 18.8 3.6 ---
Table 16. Number of trappers who set traps for otters during previous seasons.
Season # of Trappers
2012-2013 146
2013-2014 204
None, first year trapping 10817 Table 17. Distribution of trappers by county of residence based on responses to the 2014-2015 Illinois Otter Trapper Survey (n=342). County n County n County n Adams 8 Hardin 1 Morgan 5 Alexander 2 Henderson 4 Moultrie 2 Bond 3 Henry 4 Ogle 4 Boone 2 Iroquois 5 Peoria 4 Brown 6 Jackson 9 Perry 3 Bureau 3 Jasper 6 Piatt - Calhoun 5 Jefferson 5 Pike 16 Carroll 2 Jersey - Pope 2 Cass 7 Jo Daviess 4 Pulaski 2 Champaign - Johnson 5 Putnam - Christian 1 Kane - Randolph 2 Clark 4 Kankakee 2 Richland 5 Clay 5 Kendall - Rock Island 3 Clinton 8 Knox 1 St. Clair 1 Coles 3 Lake - Saline 5 Cook 2 LaSalle - Sangamon 3 Crawford 2 Lawrence 4 Schuyler 2 Cumberland 5 Lee 2 Scott 1 De Kalb 2 Livingston 4 Shelby 1 DeWitt 1 Logan 2 Stark - Douglas 3 McDonough 5 Stephenson 8 Du Page - McHenry 3 Tazewell 6 Edgar 1 McLean 1 Union 5 Edwards 2 Macon 2 Vermilion 3 Effingham 7 Macoupin 4 Wabash 4 Fayette 11 Madison 3 Warren - Ford 4 Marion 8 Washington - Franklin 4 Marshall 1 Wayne 9 Fulton 5 Mason 5 White 4 Gallatin 2 Massac 5 Whiteside 8 Greene - Menard 1 Will - Grundy 1 Mercer 1 Williamson 2 Hamilton 4 Monroe 8 Winnebago 2 Hancock 5 Montgomery 1 Woodford 4
18

                                                    Appendix A

                     Illinois Otter Trapper Survey:
                              2014-15 Season

                                      Illinois Department of Natural Resources
                                           Division of Wildlife Resources
                                                         and
                                           Illinois Natural History Survey

The Department of Natural Resources is requesting disclosure of information that is necessary to accomplish the
statutory purpose as outlined under the Illinois Compiled Statutes, The Wildlife Code, Chapter 520. This study is
funded by the federal Wildlife Restoration Fund through your purchase of hunting arms and ammunition.

                                  THANK YOU FOR YOUR COOPERATION!
                                   All of your responses will be kept confidential.
                       Please return this survey in the postage-paid return envelope provided.
19
Section 1. Effort and Harvest. Please answer the following questions about your trapping activities during the
2014-15 trapping season in Illinois.
1. Did you set any traps for furbearers in Illinois during the 2014-15 trapping season? (Please check one).
_____ Yes _____ No (Please skip to Section 4)
2. Complete each blank for all species trapped in Illinois during the 2014-15 season. Report only your personal
catch. If you trapped with a partner, list only your half of the catch. DO NOT include animals taken by hunting.
Number Sold Number Sold or
Number in Shipped Number Not
Species Trapped Illinois Out of State Sold
Muskrat
Mink
Otter
Raccoon
Opossum
Red Fox
Gray Fox
Beaver
Skunk
Weasel
Coyote
Badger
3. In which county did you set traps most often during the 2014-15 trapping season?
_____________________ County
4. How many days (or nights) did you set traps during the 2014-15 trapping season?
______ days/nights
5. What was the average number of traps you set on your trapline during the 2014-15 trapping season?
______ traps
6. How many years have you been trapping in Illinois? _______ years
7. Which of the following best describes how often you trap furbearers in Illinois?
_____ Never _____ Rarely _____Occasional years _____ Most years ____ Every year
8. Which of the following did you trap only on public land in 2014-15? (Please check all that apply).
____ Muskrat ____ Mink ____ Otter ____ Raccoon
____ Opossum ____ Red Fox ____ Gray Fox ____ Beaver
____ Skunk ____ Weasel ____ Coyote ____ Other (please identify)____________20
9. Which species was your primary target during 2014-15? (Please check one).
____ Muskrat ____ Mink ____ Otter ____ Raccoon
____ Opossum ____ Red Fox ____ Gray Fox ____ Beaver
____ Skunk ____ Weasel ____ Coyote ____ Other (please identify)____________
Section 2. Marketing Practices. Please answer the following questions about how you marketed your furs that
were harvested during the 2014-15 trapping season in Illinois.
If you did not sell any of the furs you harvested during the 2014-15 trapping season, please skip to Section 3.
1. Approximately what percentage of your catch was sold:
a. Whole (in the carcass) _______%
b. Skinned (fresh or frozen) _______%
c. Skinned, fleshed, stretched, & dried _______%
2. Approximately what percentage of your catch was sold to:
a. Local fur buyers (operate from fixed place of business in IL or nearby state - you are paid immediately) _____%
b. Traveling fur buyers (stop at certain times in different towns - you are paid immediately) _____%
c. International auctions (agent collects furs along a truck route - you are paid after furs are sold at auction) _____%
d. Auction sponsored by trapper’s association (you attend auction in person and are paid that day) _____%
Section 3. Otter Trapping. Please answer the following questions about your otter trapping activities during the
2014-15 season. The information you provide will help us to better manage otter populations in Illinois.
1. How many days (or nights) did you set traps for otters during the 2014-15 trapping season?
______ days/nights
2. Please rate your satisfaction with the 2014-15 otter trapping season as compared to the 2013-14 season.
Much Less Less Equally More Much More
Satisfied Satisfied Satisfied Satisfied Satisfied
1 2 3 4 5
3. Please rate your SATISFACTION with the 2014-15 Otter Trapping season in Illinois for each of the following
by circling the number that matches your response.
Very Very
Dissatisfied Dissatisfied Unsure Satisfied Satisfied
Number of otters in the areas you trapped. 1 2 3 4 5
Weather conditions during the season. 1 2 3 4 5
Amount of time you spent otter trapping this season. 1 2 3 4 5
Number of otters you trapped. 1 2 3 4 5
Otter fur prices during the season 1 2 3 4 5
4. Please provide the number of otters trapped in each of the types of sets listed below.
____ targeted otter
____ targeted raccoon, with otter as a secondary target
____ targeted beaver, with otter as a secondary target21
5. It is important for the Illinois Department of Natural Resources to understand the distribution of the otter harvest in
the state. Please refer to the map on the back of the cover letter and write in the table below the number of the
watershed where you trapped otters as well as the number of otters trapped per watershed.
Otters Trapped
Watershed Number Males Females
6. Please give your satisfaction with the length of time it took to receive your CITES tag by circling the number below
that matches your response.
Not at all Satisfied Slightly Satisfied Moderately Satisfied Very Satisfied Extremely Satisfied
1 2 3 4 5
7. In what other seasons did you set traps for otters? (Please check all that apply).
____ 2012-13 ____ 2013-14 ____ None, this is my first year trapping otters.
Section 4. General Information. The following questions provide important information to help us understand
more about the people who trap in Illinois. Please tell us about yourself by completing the following questions.
All responses will be kept confidential.
1. What is your county of residence? ____________________________ County
2. Please give your age. _______ years
3. Please give your gender ____ Male ____ Female
Comments
THANK YOU FOR YOUR TIME AND ASSISTANCE!
Please return this survey in the postage-paid envelope provided.
The Illinois Department of Natural Resources receives federal assistance and therefore must comply with federal anti-discrimination laws. In compliance with the Illinois
Human Rights Act, the Illinois Constitution, Title VI of the 1964 Civil Rights Act, Section 504 of the Rehabilitation Act as amended, and the U.S. Constitution, the Illinois
Department of Natural Resources does not discriminate on the basis of race, color, sex, national origin, age, or disability. If you believe you have been discriminated against in
any program, activity, or facility, please contact the Equal Employment Opportunity Officer, Department of Natural Resources, One Natural Resources Way, Springfield, IL
62701-1787, (217) 782-7616 or the Officer of Human Resources, U.S. Fish and Wildlife Service, Washington, D.C. 20240.22
Appendix B
ILLINOIS NATURAL HISTORY SURVEY
Prairie Research Institute
University of Illinois at Urbana-Champaign
April 7, 2015
Dear Illinois Trapper,
Your name was selected from the list of 2014 Illinois otter permit applicants. We are asking you to
provide information about your trapping activities during the 2014-15 trapping season in Illinois.
Even if you were not successful or did not trap in Illinois during the 2014-2015 seasons, we ask
that you please take a few minutes to complete the portions of the questionnaire that pertain to
you.
The information you and other selected trappers furnish our biologists is vital for proper furbearer
management and allows us to safeguard furbearer populations while maximizing trapping
opportunities. Your responses are voluntary and completely confidential. Please take a few
minutes to complete the enclosed questionnaire and return it in the postage paid envelope provided.
If you do not wish to participate, please return the blank questionnaire so we can remove your name
from our mailing list.
You may access the results of this and other studies of hunters and hunting in Illinois at
http://www.inhs.illinois.edu/programs/hd/. You may also find information about Illinois Department
of Natural Resources wildlife management programs and wildlife in Illinois at
http://dnr.state.il.us/orc/wildliferesources/.
If you have questions regarding this study, please call us at (217) 244-5121.
Thank you for your time and assistance.
Sincerely,
Craig A. Miller
Human Dimensions Research Program
1816 South Oak Street,
Champaign, Illinois 61820 USA23 Please refer to the graphics on this page to answer question 5 in Section 3.
24

Appendix C
25

                                                              Appendix D

        ILLINOIS NATURAL HISTORY SURVEY
        Prairie Research Institute
        University of Illinois at Urbana-Champaign

April 29, 2015

Dear Illinois Trapper,

Your name was selected from the list of 2014 Illinois otter permit applicants. You were recently sent
a survey questionnaire requesting information about your trapping activities during the 2014-2015
trapping seasons. If you have already returned the questionnaire, we thank you.

If you have not returned your completed questionnaire, please do so as soon as possible.
We have enclosed another copy for your use. The information you and other selected trappers
furnish our biologists is vital for proper furbearer management and allows us to safeguard furbearer
populations while maximizing trapping opportunities.

Even if you were not successful or did not trap in Illinois during the 2014-2015 seasons, we ask
that you please take a few minutes to complete the portions of the questionnaire that pertain to
you. A postage paid envelope is provided for returning the questionnaire to us.

If you do not wish to participate, please return the blank questionnaire so we can remove your name
from our mailing list.

You may access the results of this and other studies of hunters and hunting in Illinois at
http://www.inhs.illinois.edu/programs/hd/. You may also find information about Illinois Department
of Natural Resources wildlife management programs and wildlife in Illinois at
http://dnr.state.il.us/orc/wildliferesources/.

If you have questions regarding this study, please call us at (217) 244-5121.

Thank you for your time and assistance.

Sincerely,

        Craig A. Miller
        Human Dimensions Research Program

                                                         1816 South Oak Street,
                                                      Champaign, Illinois 61820 USA
26 Please refer to the graphics on this page to answer question 5 in Section 3.
27

Appendix E
You can also read