Research on Dynamic Structure Displacement Monitoring Based on Feature Optical Flow Method - IOPscience
←
→
Page content transcription
If your browser does not render page correctly, please read the page content below
IOP Conference Series: Earth and Environmental Science

PAPER • OPEN ACCESS

Research on Dynamic Structure Displacement Monitoring Based on
Feature Optical Flow Method
To cite this article: Jiayan Zheng et al 2021 IOP Conf. Ser.: Earth Environ. Sci. 768 012127

View the article online for updates and enhancements.

 This content was downloaded from IP address 46.4.80.155 on 18/07/2021 at 18:43
MSGCE 2021 IOP Publishing
IOP Conf. Series: Earth and Environmental Science 768 (2021) 012127 doi:10.1088/1755-1315/768/1/012127

Research on Dynamic Structure Displacement Monitoring
Based on Feature Optical Flow Method

 Jiayan Zheng1,2*, Yuzhou Wang2, Fei Pan4, Zhixiang Zhou3, Qiumo Li2 and Chao
 Xu2
 1
 State Key Laboratory of Mountain Bridge and Tunnel Engineering, Chongqing
 Jiaotong University, Chongqing, 400074, China
 2
 School of Civil Engineering, Chongqing Jiaotong University, Chongqing, 400074,
 China
 3
 College of Civil and Transportation Engineering, Shenzhen University, Shenzhen,
 518060, China
 4
 China Merchant Chongqing Communications Technology Research & Design
 Institute Co. Ltd, Chongqing, 40076, China
 *Corresponding author’s e-mail: jiayanzheng@cqjtu.edu.cn

 Abstract: In view of the difficulty of sensor installation and complicated process in traditional
 structure health monitoring, a feature point monitoring based on optical flow is proposed in this
 paper. A high-speed camera is applied to capture the dynamic response of the structure under
 excitation, and feature point could be selected and marked at any position in the video. The
 movement of the selected point could be traced and calculated by feature optical flow method,
 and the displacement time series of the feature point could be obtained. Results show that the
 displacement time series obtained from proposed method in this paper is consistent with the data
 of the pull-wire displacement sensor, the maximum displacement error is 3.3%, the method
 proposed is more flexible, convenient and of low cost.

1. Introduction
High-rise buildings and long-span structures play a very important role in ensuring people’s safe and
the development of national economy. Up to 2019, the total number of modern bridges in China exceeds
1 million, at the same time, the number of in-service bridges in China’s highway entering the
maintenance period is increasing, more than 100,000 bridges are in unsafe condition. In the case of these
dangerous bridges on alert, diverse dynamic loads, including traffic, wind, and earthquakes can
aggravate the condition of the structures. Therefore, it is necessary to monitor and evaluate the condition
of the bridge structure to ensure them in safety condition. The corresponding characteristics of dynamic
displacement are the most intuitive performance of bridge, and it is also one of the most vital parameters
for judging the health of the bridge[1].
 In traditional monitoring methods, the dynamic responses of the structure is obtained by sensors
installed in structure or on the surface. Abdel-Ghaffer and Scanlan[2] applied specially deployed and
oriented motion-sensing accelerometers to monitor the Golden Gate Bridge, and environmental
vibration under wind and earthquake conditions is utilised to determine the effective damping, three-
dimensionality modal shape and vibration frequency. Results are in good accordance with the numerical

 Content from this work may be used under the terms of the Creative Commons Attribution 3.0 licence. Any further distribution
 of this work must maintain attribution to the author(s) and the title of the work, journal citation and DOI.
Published under licence by IOP Publishing Ltd 1
MSGCE 2021 IOP Publishing
IOP Conf. Series: Earth and Environmental Science 768 (2021) 012127 doi:10.1088/1755-1315/768/1/012127

results of two-dimensional and three-dimensional model. 13 acceleration sensors are installed on the
111-meter bridge superstructure and columns by Soyoz and Feng[3], and they monitored the bridge for
5 years, obtained the probability density function of the bridge stiffness, and determined the bridge
collapsed stiffness threshold. Asadollahi and Li[4] applied a dense array of wireless smart sensor
networks with 113 smart sensors installed on a cable-stayed bridge in South Korea to record ambient
acceleration. The data collected by sensors were used for comprehensive statistical analysis such as
natural frequencies, modal damping and mode shapes of the bridge, and the results have a high resolution
and confidence in identified modal properties.
 Huge height and volume of structures monitored result in extra difficulties in sensor installation,
which is deteriorated by complex environments or surroundings like complicated wiring and heavy
traffic, as a result non-contact measurement are a better choice. With the development of digital image,
signal processing and computer technology, various structural displacement monitoring methods based
on video-image technology continue to appear and have been verified in actual projects. Dong[5]
proposed a non-contact structural dynamic characteristics identification method based on machine
vision technology, and verified the feasibility of this method in experiments. An advanced template
matching algorithm based on a vision sensor system for remote measurement of structural displacements
was developed by Feng[6], satisfactory agreements are observed between the displacements measured
by the single camera and those measured by high-performance laser displacement sensors. Ye[7] combed
the research and progress of the structural displacement monitoring method based on computer vision,
introduced the template matching method, feature point matching method, full-field optical flow method,
sparse optical flow method, geometric matching method, particle image velocimetry (PIV), color
matching method, and target tracking method based on deep learning Eight target tracking methods,
analyzed the advantages and disadvantages of various methods and gave suggestions for target tracking.
 Based on that, this paper achieved the precise extraction of any feature points of interest, applied the
Lucas-Kanade[8] optical flow method to calculate the displacement, and developed a set of displacement
measurement programs based on machine vision. This method and pull-wire displacement sensor were
used in the laboratory to test the transformer, which verified the feasibility of the algorithm developed
in displacement monitoring in this paper.

2. Theory and process of feature based structure dynamic displacement tracking

2.1 Optical flow calculation corner motion algorithm
The main algorithm principle in the calculation of feature point displacement is based on the difference
method of LUCAS - KANADE optical flow estimation, and follows two basic assumptions:
 1. The gray intensity of the moving object remains unchanged in a short interval;
 2. The velocity vector field in a given neighborhood changes slowly.
 As shown in Figure 1, suppose the pixel intensity of the tracking target in the video at time is:
 , ,
 After time ∆ , the point has a slight displacement, and its intensity is represented by ∆ ,
∆ , ∆ . According to the assumption 1 of the optical flow method:
 , , ∆ , ∆ , ∆ (1)
 Expand the right end of equation (1) using a first-order Taylor series as:
 (2)
 , , , ,

 Substituting formula (2) into formula (1) to sort out:
 (3)
 0

which is:
 (4)
 Where: ; ; ; ; ;

 2
MSGCE 2021 IOP Publishing
IOP Conf. Series: Earth and Environmental Science 768 (2021) 012127 doi:10.1088/1755-1315/768/1/012127

 In the same way, it can be known that I-1, I-2, I-3, I-4, I-6, I-7, I-8, and I-9 around the marked pixels
in Figure 1 can also list the same formula.

 I-1 I-2 I-3

 Pixel
 I-4 I-6
 I(x,y,t)

 I-7 I-8 I-9

 Figure 1. Calculate adjacent pixel motion

 Combining all the formulas, as shown in formula (5), it can be solved by the least square method.

 1 1
 ⎡ 1 ⎤
 ⎢ 2 2 ⎥ 2
 ⎢…
 ⎢ … ⎥⎥ … (5)
 ⎣ 9 9 ⎦ 9

2.2 Shi-Tomasi feature corner
A corner point is a point that is more prominent and has obvious changes in each direction and the gray
information is used to make judgments in the detection of image key points. This article uses the Shi-
Tomasi[9] corner point algorithm, which is an improved version of the Harris[10] corner point algorithm.
In many cases, it can get better results than the Harris corner point algorithm. In this paper, a memory
algorithm is added after the corner parameter setting is completed, so that the program can memorize
the initially selected corner parameters, and stably recognize the initially selected characteristic corners
in the subsequent tracking process.

2.3 Calibration
Mark two points arbitrarily on the first frame of the two-dimensional image sequence, calculate the pixel
distance between the two points as , and input the actual distance of the world coordinates. The
coefficient is the ratio of the actual distance to the pixel distance, As shown in formula (6), and use
this scale factor as the calibration parameter of all images taken by the device at the spatial position.

 (6)

 In the formula, is the calibration coefficient
 The structural dynamic characteristics recognition method proposed in this paper is mainly to track
the pixels in the image, determine the position of the selected pixel in each frame, and convert the
obtained pixel displacement to the actual physical length to finally achieve monitoring. First use the
camera to shoot the excitation process of the structure, then select the feature points in the two-
dimensional image sequence, and then calibrate on the picture, and finally start the program to track the
feature point, the program will automatically calculate the data and output the movement of the feature
point, the specific process is shown in Figure 2.

 3
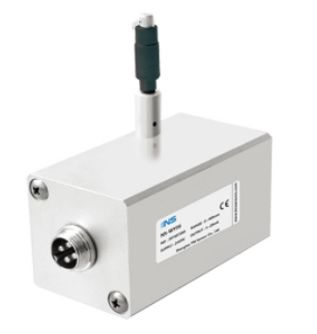
MSGCE 2021 IOP Publishing
IOP Conf. Series: Earth and Environmental Science 768 (2021) 012127 doi:10.1088/1755-1315/768/1/012127

 First Second Third

 Input Calculate Output
 Set Feature Points Calibration
 Video Movement Data

 Figure 2. Video dynamic displacement acquisition process

3 Structural dynamic displacement tracking experiment, analysis and verification

3.1 Experimental overview
To verify the feasibility of the above method, seismic experiment of a power transformer were carried
with shake table as follows, to measure, analyse, and validate the dynamic displacement response of
structures, by monitoring a feather point on top of transformer with proposed method. Figure 3 shows a
transformer with a height of 14.08m, which is rigidly connected by five ceramic cylinders with a
diameter of 1.13m and a length of 2.18m. The bottom is 0.5m high and fixed to the vibration table. The
parameters of the high-speed camera and mobile phone are shown in Table 1. The shooting direction is
orthogonal to the axis of the transformer, and the distance from the transformer is 17m. The pull-wire
sensor in Figure 4 is arranged on the top of the structure to measure the horizontal displacement of the
top; the dynamic acquisition instrument (DEWE2-A4) is used to obtain the dynamic response
information of the transformer structure, and the acquisition frequency is 500 Hz. The sensor parameters
are shown in Table 2. The overall spatial location diagram is shown in Figure 5.

 Figure 3. Transformer test

 Table 1 Camera parameters
 Camera Fps Resolution
 FDR-AX700 50fps 1920*1080
 Iphone 8 plus 30fps 1920*1080

 4
MSGCE 2021 IOP Publishing
IOP Conf. Series: Earth and Environmental Science 768 (2021) 012127 doi:10.1088/1755-1315/768/1/012127

 Figure 4. Pull-wire displacement sensor

 Table 2 NS - WY06 pull-wire sensor parameters
 Specifications Technique data
 Precision 0.1%
 Measuring range 1200mm
 Non-linear error ≤0.5%
 Output 0~10V
 Displacement speed ≤0.7m/s

 Φ1.13m
 12m
 pull wire sensor camera
 wire
 wire

 pull wire sensor transformer 17m
 transformer
 17m

 14.08m

 16m

 Vibrating table

 19m
 camera
 (a) Top view (b) Front view

 Figure 5. Schematic diagram of transformer test

 Excitation is applied through the bottom vibrating table, traditional measurement and video shooting
are started before the excitation is generated and the experimental data of continuous response is
recorded until it stops.
 As shown in Figure 6, the distance between the two flanges is = 420mm, the pixel distance is
 = 43 pixel, and the final scale factor is = 9.76 pixel, which is expressed as 1 pixel = 9.76 mm.

 5
MSGCE 2021 IOP Publishing
IOP Conf. Series: Earth and Environmental Science 768 (2021) 012127 doi:10.1088/1755-1315/768/1/012127

 figure 6. Pixel and actual distance calibration

3.2 Analysis of results
This section compares the actual measurement results with the program calculation results to verify the
feasibility of the program. Figure 7 is the traditional measurement method using the pull-wire
displacement sensor (500Hz) to measure the displacement time history curve of the top of the
transformer, Figure 8 (FDR-AX700, 50fps, 1920*1080) and Figure 9 (Iphone 8 plus, 30fps, 1920* 1080)
is the time history curve of the top displacement of the transformer after processing the captured video
using the developed characteristic optical flow method.

 80 pull-wire displacement sensor
 60
 displacement(mm)

 40

 20

 0

 -20

 -40

 -60

 -80
 0 1 2 3 4 5 6 7 8 9 10
 time(s)

 Figure 7. Displacement time curve by pull-wire sensor

 6
MSGCE 2021 IOP Publishing
IOP Conf. Series: Earth and Environmental Science 768 (2021) 012127 doi:10.1088/1755-1315/768/1/012127

 80 Sony
 60
 displacement(mm)

 40

 20

 0

 -20

 -40

 -60

 -80
 0 1 2 3 4 5 6 7 8 9 10
 time(s)

 Figure 8. Displacement time curve by Sony FDR-AX700

 80
 Iphone 8 plus
 60
 displacement(mm)

 40

 20

 0

 -20

 -40

 -60

 -80
 0 1 2 3 4 5 6 7 8 9 10
 time(s)

 Figure 9. Displacement time curve by Iphone 8 plus

 As shown in Figure 10, the video taken at a distance of 17m from the test object using two devices
at the same resolution and different frame rate, the results obtained have the same line shape, the gap is
very small, the higher the frame rate, the more data and the smoother the curve, and the maximum error
of the displacement value is 1.6%.

 80 Iphone 8 plus

 60
 Sony
 displacement(mm)

 40

 20

 0

 -20

 -40

 -60

 -80
 0 1 2 3 4 5 6 7 8 9 10
 time(s)

 Figure 10. Comparison of iphone 8 plus and Sony FDR-AX700 captured results

 The frequency of the sensor sampling frequency is 500Hz, and the video frame rate of the shooting
is 30fps and 50fps respectively. After the processing is completed, a section of the data(0-3s) obtained
by the cable displacement sensor data and the characteristic optical flow measurement is intercepted and
placed in Figure 11 for analysis. It can be seen that the two measurement results are very consistent, and
the maximum error of the displacement value is 3.3%, indicating that the characteristic optical flow

 7
MSGCE 2021 IOP Publishing
IOP Conf. Series: Earth and Environmental Science 768 (2021) 012127 doi:10.1088/1755-1315/768/1/012127

method can meet the requirements in the structural displacement measurement.

 80
 Pull-wire displacement sensor
 60 Camera captured
 displacement(mm)

 40

 20

 0

 -20

 -40

 -60

 -80
 0.0 0.5 1.0 1.5 2.0 2.5 3.0 3.5 4.0 4.5 5.0
 time(s)

 Figure 11. Comparison of traditional measurement and camera captured results

4. Conclusion
This paper proposes a new non-contact structural dynamic displacement detection method based on
feature point and optical flow theory, and has achieved the target point tracking and the acquisition of
the history diagram of the point in structures. By dynamic displacement analysis of a transformer in
vibration experiments, comparing with traditional detection methods, the following conclusions are
obtained:
 (1) The method proposed in this paper can select any feature point on the structure and obtain the
displacement data of this point, which solves the cumbersome problem of the traditional displacement
measurement method.
 (2) The results obtained from long-distance shooting at different frame rates, after using the method
proposed in this article, the error of the same point displacement data result is up to 1.6%.
 (3) The displacement calculation result obtained by using the method proposed in this paper is very
consistent with the displacement time history curve of the result obtained by the traditional measurement
method. The maximum error of the displacement value is 3.3%, which can meet the detection
requirements.
 (4) The method in this article is very adaptable. In the whole test process, the displacement can be
detected directly without adding any artificial marks to the structure.
 The method proposed in this paper uses ordinary civilian shooting equipment for video capture, and
lacks industrial-grade high-resolution, high frame rate video and the ability to detect in extreme
environments needs further testing and verification.

Acknowledgments
The authors acknowledge the support provided by NSFC (51778094; 51708068). We also acknowledge
State Key Laboratory of Mountain Bridge and Tunnel Engineering for providing experimental
equipment.

References
[1] Guilan Zhou, Kaiqi Xu. (2019) The Status and Development of Long-span Bridge Structure Health
 Monitoring Technology. J. Highway Traffic Technology (Applied Technology Edition),
 15(04): 168-169.
[2] Abdel-Ghaffar A M, Scanlan R H. (1985). Ambient vibration studies of golden gate bridge: I.
 Suspended structure. J. Journal of Engineering Mechanics, 111(4): 463-482.
[3] Soyoz S, Feng M Q. (2009) Long-Term monitoring and identification of bridge structural
 parameters. J. Computer-Aided Civil and Infrastructure Engineering, 24(2): 82-92.

 8
MSGCE 2021 IOP Publishing
IOP Conf. Series: Earth and Environmental Science 768 (2021) 012127 doi:10.1088/1755-1315/768/1/012127

[4] Parisa Asadollahi, Jian Li. (2017) Statistical Analysis of Modal Properties of a Cable-Stayed Bridge
 through Long-Term Wireless Structural Health Monitoring. J. Journal of Bridge Engineering,
 22(9).
[5] Chuanzhi Dong, Xiaowei Ye, Tan Liu. (2017) Identification method and test verification of non-
 contact structure dynamic characteristics. J. Vibration and shock, 36(01):188-193.
[6] Dongming Feng, Maria Feng,Ekin Ozer, Yoshio Fukuda. (2015) A Vision-Based Sensor for
 Noncontact Structural Displacement Measurement. J. Sensors, 15(7).
[7] Xiaowei Ye, Chuanzhi Dong. (2019) Survey of structural displacement monitoring based on
 computer vision. J. Journal of China Highway, 32(11):21-39.
[8] LUCAS, B. D., AND KANADE, T. (1981) An iterative image registration technique with an
 application to stereo vision. In Proceedings of IJCAI, 674–679.
[9] Jianbo Shi and Tomasi. (1994) Good features to track. In: Proceedings of IEEE Conference on
 Computer Vision and Pattern Recognition, Seattle, WA, USA. pp. 593-600.
[10] C. Harris and M. Stephens. (1988) A Combined Corner and Edge Detector. In: The 4th Alvey
 Vision Conference. Manchester. pp. 147-151.

 9
You can also read