Simultaneous determination of paracetamol and diphenhydramine hydrochloride mixture in the presence of their degradation products
←
→
Page content transcription
If your browser does not render page correctly, please read the page content below
IOSR Journal of Pharmacy and Biological Sciences (IOSR-JPBS)
e-ISSN: 2278-3008, p-ISSN:2319-7676. Volume 6, Issue 5 (May. – Jun. 2013), PP 44-52
www.iosrjournals.org

        Simultaneous determination of paracetamol and
 diphenhydramine hydrochloride mixture in the presence of their
                    degradation products
         NouruddinW. Ali1, M. Abdelkawy2 and Nessreen S. Abdelhamid3
    1
      (Pharmaceutical Analytical Chemistry Department, Faculty of Pharmacy, Beni-Suef University, Egypt)
       2
         (Pharmaceutical Analytical Chemistry Department, Faculty of Pharmacy, Cairo University, Egypt)
    3
      (Pharmaceutical Analytical Chemistry Department, Faculty of Pharmacy, Beni-Suef University, Egypt)

Abstract: New accurate, selective, sensitive and precise methods were developed and validated for
determination of paracetamol and diphenhydramine hydrochloride in the presence of P-amino phenol, the
hydrolytic degradate and the most potential impurity of paracetamol and the N oxide degradation product of
diphenhydramine in bulk form and in pharmaceutical formulation.Method A uses double divisor second
derivative of ratio spectrophotometric technique, at 304nm for paracetamol and 256.4nm for diphenhydramine
hydrochloride. Method B utilizes Principle Component Regression (PCR) and Partial Least Squares (PLS)
chemometric techniques for quantification of the four components using a UV spectrum range of 210-350 nm.
The proposed methods were successfully applied to the analysis of the mentioned drugs either in bulk powder or
in pharmaceutical formulation without interference from other dosage form additives, and the results were
statistically compared with the pharmacopoeial method.
Keywords:Paracetamol, diphenhydramine hydrochloride, P-amino phenol, double divisor spectrophotometric
method, multivariate spectral analysis.

                                           I.        Introduction
         Paracetamol (PC) is N-(4-hydroxy phenyl) acetamide. It is Para- aminophenol derivative; it has
analgesic and anti-pyretic properties [1].Diphenhydramine hydrochloride (DH) is 2-Diphenyl methoxy-
N,Ndimethylethanamine, it has antihistaminic action and used for symptomatic relief of hypersensitivity
reactions [2].Their structures are shown in “Fig.1”.

                                   figure 1.structures of the studied drugs.

       PC and DH are co-formulated in Panadol night tablets for temporary relief of pain associated with
sleeping disorders. Simultaneous determination of the two drugs is time saving and less tedious than the
determination of the two drugs by separate methods. The U.S. Pharmacopeia (USP 2007) has described a
monograph to determine the binary mixture of PC and DH, depending on RP-HPLC using C18 column and
phosphate buffer- acetonitrile in the ratio of 94:6 v/v as a mobile phase with UV detection at 225 nm [3].
       Few analytical methods have been described for simultaneous determination of PC/DH binary mixture
including HPLC methods [4-6], NIR spectroscopy [7] and multivariate spectrophotometry [8]. A single
published literature described the simultaneous quantification of PC and DH in presence of P-amino phenol
(PAP); by first derivative (1D) spectrophotometric, the first derivative of ratio spectra ( 1DD), multivariate
spectrophotometric and HPTLC-densitometric methods , in bulk material and pharmaceutical preparations [9].
       Therefore the aim of this work is to describe a simple, sensitive, precise, accurate and time saving
method for the simultaneous determination of PC and DH in the presence of both PAP and the N oxide

                                                www.iosrjournals.org                                 44 | Page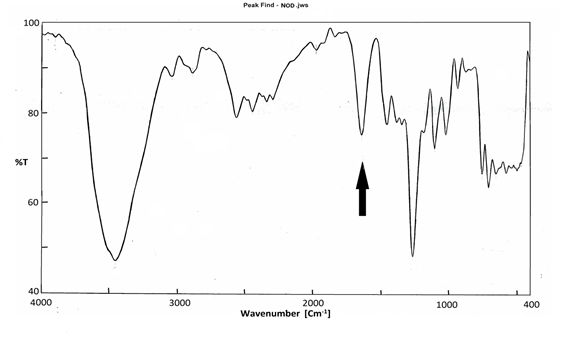
Simultaneous determination of paracetamol and diphenhydramine hydrochloride mixture in the

degradation product of DH, Diphenylmethoxy-N,N-dimethyl ethanamine N-oxide (NOD),which can be used in
pure forms or in pharmaceutical formulation.

                                           II.        Experimental
2.1. Materials
2.1.1. Pure standards.
          Paracetamol and Diphenhydramine Hydrochloride were kindly supplied by GlaxoSmithKline
Company Egypt. Their purity was found to be 100.11±1.197% and 99.96±0.743%, respectively according to the
official HPLC method [3].

2.1.2. Pharmaceutical formulation.
          Panadol night® tablets (Batch No. 124992) labeled to contain 500 mg of Paracetamol and 25 mg of
Diphenhydramine Hydrochloride , manufactured by GlaxoSmithKline company .
2.1.3. Chemicals and reagents.
          All reagents and chemicals used throughout this work were of analytical grade and were used without
further purification. Methanol was of HPLC grade and obtained from ChromasolvW, Sigma-Aldrich
ChemieGmbh,Germany. Ethyl acetate was from E. Merck, Germany, Hydrogen peroxide solution, sodium
lauryl sulphate and acetone and acetic acid were from Al-Nasr pharmaceutical chemicals company, Abu Zaabal,
Cairo, Egypt. P-aminophenol was from Riedel-dehaen-AG- Germany; its purity was certified to be 99%.
2.1.4. Preparationof N oxide degradation product (NOD).
         A 0.2g aliquot of DH powder was mixed with 5mL of 1 M sodium hydroxide solution to liberate the
free base which was then extracted by ether followed by spontaneous vaporization of the solvent. 5 mL of 30%
hydrogen peroxide solution is added to the free base and covered carefully. Six hours were sufficient for
complete oxidation of the free base. The reaction progress was followed via TLC using ethyl acetate - acetone -
methanol - acetic acid - sodium lauryl sulphate (5:5:1:0.25:0.2, v/v/v/v/w)as a developing system. After
complete oxidation, the solution was left to dry at room temperature and the degradation product powder was
identified by IR and mass spectrometry, and used for preparation of the stock solution of the degradation
product.

2.2. Instruments
         A UV lamp with short wavelength 254nm (USA) and a double beam UV-visible spectrophotometer
(SHIMADZU, Japan) model UV-1601 PC with quartz cells of 1 cm path length, connected to IBM compatible
computer. The software was UVPC personal spectroscopy software version 3.7. Data analysis was performed
using PLS-Toolbox 2.0 running under MATLAB, version 6.5.

2.3. Prepared solutions
2.3.1. StandardsolutionsFor stock standard solutions of PC, DH, PAP and NOD (1 mgmL-1 in methanol), 0.1 g
of each of the four components were accurately weighed into four separate 100 mL volumetric flasks; 50 mL of
methanol was added to each flask and shaken to dissolve, then the volume was made up to the mark with
methanol. For working standard solutions of PC, DH, PAP and NOD (100 µgmL-1), 10 mL of each stock
standard solutions (1 mgmL-1) were transferred accurately into four separate 100 mL volumetric flasks, and then
the volume was completed to the mark with methanol.

2.3.2. Laboratory prepared mixtures
         Mixtures containing different ratios of PC, DH, PAP and NOD were prepared using their respective
working solutions in methanol.

2.4. Methodology
2.4.1. Double divisor second derivative of ratio 2DD spectrophotometric method
2.4.1.1. Linearity and construction of calibration curves
          The 2DD spectra of PC and DH in a concentration range of 2-45 µgmL-1 for each drug were recorded
using a mixture of PAP and NOD containing 10µgmL-1 of each as a divisor, Δλ=8 and scaling factor =500. The
peak amplitudes were measured at 304nm for PC and at 256.4nm for DH.
      The calibration curves were constructed relating the peak amplitudes to the corresponding concentrations
for each drug. The regression equations were computed.
2.4.1.2. Analysis of laboratory prepared mixtures of PC, DH, PAP and NOD
Mixtures containing different concentrations of PC, DH, PAP and NOD were analyzed by applying the above-
described procedure“Table 1”.
2.4.2. Chemometric methods

                                                 www.iosrjournals.org                                 45 | Page
Simultaneous determination of paracetamol and diphenhydramine hydrochloride mixture in the
2.4.2.1. Construction of the training set
Five level four factor calibration design was used [10]. Different mixtures containing different ratios of PC, DH,
PAP and NOD were prepared “Table 2, mixtures 1-13”.
The absorption spectra of the mixtures were recorded and transferred to MATLAB for data manipulation.
Thirteen mixtures were used to construct the calibration model and twelve mixtures were used as a validation
set. PCR and PLS multivariate calibration models were constructed and were found to have high spectral
residuals in the regions below 210nm and above 350nm; so these regions were rejected.
For the selection of the optimum number of factors;the cross validation method was used leaving one
sample out at each time, then predicting its concentration. The root mean square error of validation was
calculated by comparing the predicted and the actual concentrations of each drug in the thirteen calibration
mixtures. Data mean centering gave better results upon building PCR and PLS models.
2.4.2.2. Construction of the validation set
Twelve different mixtures containing different ratios of PC, DH, PAP and NOD were prepared and used as
a validation set (table 2, mixtures14-25); where the concentrations of all components were predicted using the
developed models.
Table 1. Determination of paracetamol (PC) and diphenhydramine hydrochloride (DH) in presence of P-
aminophenol (PAP)and the N-oxide degradation product of diphenhydramine (NOD) in laboratory prepared
mixtures by the double divisor 2DD method.
Table 2. Mixtures of paracetamol (PC), diphenehydramine hydrochloride (DH), P-aminophenol (PAP) and N
oxide degradation product of diphenehydramine (NOD) used in training and validation sets.
2.4.3.Application to pharmaceutical formulation;Panadol night® tablets
The contents of 10 Panadol night® tablets were powdered and mixed well. An accurately weighed
portion of the powdered tablet equivalent to 100 mg of PC and 5 mg of DH was transferred into 100-mL
www.iosrjournals.org 46 | PageSimultaneous determination of paracetamol and diphenhydramine hydrochloride mixture in the
volumetric flask; 75 mL methanol was added and sonicated for 30 min, completed to volume with methanol,
and then filtered. Part of the above solution is diluted to obtain working solution of the dosage form containing
100 μgmL-1 of PC and 5 μgmL-1 of DH. Applying the same procedure under double divisor 2DD and
multivariate spectral techniques, the concentrations of PC and DH were in the tablets were calculated from the
computed regression equations.
III. Results and discussion
The main task of this work was to establish new simple, sensitive and accurate analytical methods for
the simultaneous determination of PC and DH in presence of their degradates PAP and NOD in bulk powders
and pharmaceutical dosage form with satisfactory precision for good analytical practice.
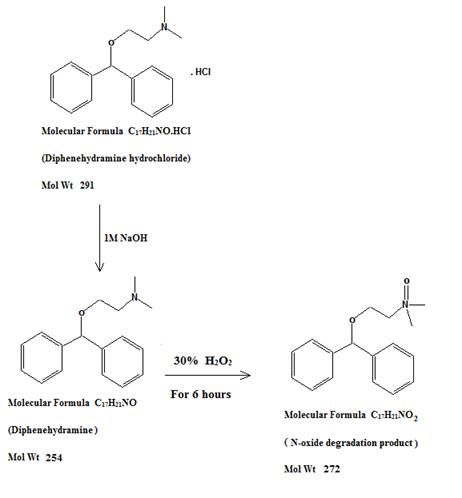
Upon adding 1 M NaOH to DH, the free base was liberated from the hydrochloride salt of DH. When 30%
hydrogen peroxide solution is added to the free base and left for Six hours, complete oxidation took place into
the N-oxide form (NOD) as shown in “Fig.2”.
figure 2.scheme of oxidative degradation of diphenhydramine hydrochloride.
The solution was evaporated at room temperature and the degradation product (NOD) was identified by IR
and mass spectrometry, where the appearance of a strong band corresponding to the N-oxide group at 1550/cm
in the IR spectrum of NOD which is almost absent in the IR spectrum of DH is an evidence of the oxidation to
the N-oxide form of the drug under the stated conditions as shown in “Fig.3”.
The mass spectra of DH and NOD also confirmed their identity as mass molecular ion peaks at m/z 290
and 272 corresponded to the intact drug (DH) and its degradation product (NOD), respectively, as shown in
“Fig.4”.
www.iosrjournals.org 47 | PageSimultaneous determination of paracetamol and diphenhydramine hydrochloride mixture in the
(a)
(b)
figure 3.infrared spectra of diphenhydramine hydrochloride (a) and its N-oxide degradation product
Diphenylmethoxy -N,Ndimethylethanamine N-oxide (b).
(a)
(b)
figure 4.mass spectra of diphenhydramine hydrochloride(a) and its N-oxide degradation product
Diphenylmethoxy-N,N-dimethyl ethanamine N-oxide(b).
www.iosrjournals.org 48 | PageSimultaneous determination of paracetamol and diphenhydramine hydrochloride mixture in the
3.1.Double divisor 2DD spectral method
The double divisor derivative ratio spectral method depends on the use of coincident spectra of the
derivative of the ratio spectra obtained by using a double divisor consisting of a sum of the spectra of two
different components and measuring the amplitude at the maximum or the minimum wavelength.
The zero order absorption spectra of PC, DH, PAP and NOD show strong overlapping which prevents the
direct spectrophotometric assay of PC or DH as shown in “Fig.5”.
figure 5.the UV absorption spectra of paracetamol (- - - -), diphenhydramine hydrochloride (-.-.-.), p-
aminophenol (………) and N oxide degradation product of diphenhydramine hydrochloride ( -..-..-..-..).
The double divisor derivative ratio technique was applied to solve this problem for selective determination
of each of PC and DH in presence of the two degradates PAP and NOD.
Selection of the divisor: differentconcentrations of PAP and NOD mixtures were tried as divisors. The best
results in terms of sensitivity, selectivity and signal to noise ratio were obtained upon using a mixture of
PAP/NOD (10µgmL-1 of each) as a divisor for determination of both PC and DH.
The absorption spectra were divided by the spectrum of a mixture of PAP/NOD (10µgmL-1 of each) used
as a divisor and2DD spectra were obtained were PC could be determined at 304nm (a zero crossing point for
DH) and DH could be determined at 256.4nm (a zero crossing point for PC) as shown in “Fig.6”.
figure 6.the double divisor 2DD spectra of paracetamol (- - -), diphenhydramine hydrochloride (-.-.-.), p-
aminophenol (………) and N oxide degradation product of diphenhydramine hydrochloride ( -..-..-..-..), using a
mixture of 10 µg mL-1 of each of PAP and NOD as a divisor.
Linear correlations were found between concentrations of drugs and peak amplitudes at 304nm for PC and
at 256.4nm forDH in the concentration range of (2-45 µgmL-1) for both drugs. The regression equations were
calculated and found to be:
“Y1 =0.0392 C1 + 0.0021 (1) r1=0.9999 for PC and
“Y2 =0.0180 C2+ 0.0038(2) r2=0.9999 for DH
where Y1 and Y2 are the peak amplitudes at 304 and 256.4nm , C1 and C2 are the concentrations in µgmL-1, and
r1and r2 are the correlation coefficients for PC and DH, respectively.
www.iosrjournals.org 49 | PageSimultaneous determination of paracetamol and diphenhydramine hydrochloride mixture in the
Good linearity is evident from the high values of the correlation coefficients and low values of intercepts,
“Table 3”.
The precision of the method was evident, as shown in “Table 3”. The methods accuracy was checked by
applying the methods for determination of pure samples of the studied compounds. The concentrations were
calculated from the corresponding regression equations and good recoveries are shown in “Table 3”.
Table 3. Results of assay validation parameters of the proposed double divisor 2DD method for determination of
paracetamol (PC) and diphenhydramine hydrochloride (DH) in presence of P-aminophenol (PAP) and the N-
oxide degradation product of diphenhydramine (NOD).
Parameter PC DH
-1
Range (µgmL ) 2-45 2-45
Linearity
Slope 0.0393 0.0180
Intercept 0.0021 0.0038
Correlation coefficient 0.9999 0.9999
Accuracy (mean ± SD) 100.526±0.773 100.103±0.545
Precision (RSD%)
Repeatability a 0.235 0.264
Intermediate precision b 0.275 0.436
a
The intraday precision (n = 3), average of three different concentrations repeated three times within one day.
b
Theinterday precision (n = 3), average of three different concentrations repeated three times on three successive days.
Accuracy was further assessed by applying the standard addition technique on Panadol ® tablets, for which
good recoveries were obtained, revealing no interference from excipients, and good accuracy of the methods
“Table 4”.
Table 4.Determination of paracetamol (PC) and diphenhydramine hydrochloride (DH) in Panadol night®
tablets (batch no. 124992) by the proposed double divisor 2DD method and multivariate techniques and
application of standard addition technique.
2
DD method PLS PCR
Components
Taken Standard Standard Standard
Found Found Found
µgmL-1 addition addition addition
(%±SD) (%±SD) (%±SD)
mean±SD mean±SD mean±SD
PC 98.360 100.250 98.300 100.057 98.320 100.833
40 ±0.046 ±1.090 ±0.067 ± 1.875 ±0.067 ±1.258
DH 103.840 100.307 103.750 100.557 103.81 100.307
2 ±0.380 ± 0.992 ± 0.431 ±0.916 ±0.468 ±1.481
Selectivity of the proposed method is evident from the 2DD spectra in “Fig. 6”.Also, the method was applied for
determination of PC and DH in laboratory-prepared mixtures as shown in “Table 1”.
3.2. Chemometric method:
Different chemometric techniques were used for the simultaneous determination of PC, DH, PAP and
NOD including PLS and PCR. The first step of the determination is the construction of the calibration set which
consists of 13 mixtures containing different ratios of PC, DH, PAP and NOD, as shown in “Table.2 ,mixtures 1-
13”. The best results were obtained upon using the wavelength range of 210-350 nm.
A validation set including 12 mixtures was used to validate the predictability of the models, where good
results wereobtained“Table 2, mixtures 14-25”.
Predicted concentrations were plotted against actual concentrations todetermine if the models accounted
for the variation in the concentrations in the validation set.
The root mean square error of prediction [RMSEP] is a diagnostic tool which examines the errors in
predicted concentrations, it indicates both precision and accuracy[10]. Model validation parameters are shown
in “Table 5”.
www.iosrjournals.org 50 | PageSimultaneous determination of paracetamol and diphenhydramine hydrochloride mixture in the
Table 5.Results of assay validation parameters of the proposed multivariate methods for the determination of
paracetamol (PC) and diphenhydramine hydrochloride (DH) in presence of P-aminophenol (PAP) and the N-
oxide degradation product of diphenhydramine (NOD).
PLS PCR
Validation parameters
PC DH PAP NOD PC DH PAP NOD
100.047 100.003 99.954 99.679 99.964 99.914 99.751 99.86
Mean ± SD
±1.357 ±0.822 ±1.314 ±1.211 ±1.068 ±0.947 ±1.271 ±1.206
RMSEP 0.1903 0.0548 0.1038 0.0676 0.1485 0.0587 0.0887 0.0903
Predicted versus actual concentration plot
a-Slope 0.9955 0.9922 1.0037 1.0054 0.9969 0.9932 1.010 1.0116
b-Intercept 0.0769 0.0453 -0.0253 -0.0485 0.0409 0.0330 -0.0685 -0.0744
c-Correlation coefficient (r) 0.9996 0.9999 0.9998 0.9998 0.9998 0.9999 0.9999 0.9996
Table 6 shows statistical comparison of the results obtained by the proposed method and the official
method, which is an HPLC method that uses C18 column and a mobile phase consisting of phosphate buffer-
acetonitrile in the ratio of 94:6 v/v [3] when applied to pure PC and DH . The calculated t and F values were
smaller than the theoretical ones, indicating that there is no significant difference between the proposed method
and the established method with respect to accuracy and precision.
Table 6.Statistical comparison of the results obtained by the proposed methods and the established method for
determination of pure paracetamol (PC) and diphenhydramine hydrochloride (DH).
2 established
DD method PLS PCR
methodc
Items
PC DH PC DH PC DH PC DH
Mean 100.720 100.130 100.047 100.003 99.964 99.914 100.11 99.96
SD 0.493 0.618 1.357 0.822 1.068 0.947 0.868 0.743
N 10 10 12 12 12 12 6 6
Variance 0.243 0.382 1.841 0.676 1.141 0.897 0.753 0.552
Student’s 0.470 0.703 0.921 0.922 0.806 0.901
t-test (2.228) a (2.228) a (2.179) a (2.179) a (2.179) a (2.179) a
3.099 1.445 2.445 1.225 1.515 1.625
F-value
(3.217) b (3.217) b (2.996) b (2.996) b (2.996) b (2.996) b
a
Figures in parentheses represent the corresponding tabulated values of t at P = 0.05.
b
Figures in parentheses represent the corresponding tabulated values of F at P = 0.05.
c
HPLC method,[3].
Table 7 shows statistical comparison of the results obtained by the proposed method and the official
method [3] when applied to PC and DH in Panadol night® tablets. The calculated t and F values were smaller
than the theoretical ones, indicating that there is no significant difference between the proposed method and the
established method with respect to accuracy and precision.
www.iosrjournals.org 51 | PageSimultaneous determination of paracetamol and diphenhydramine hydrochloride mixture in the
Table 7.Statistical comparison of the results obtained by the proposed methods and the established
method for determination of paracetamol (PC) and diphenhydramine hydrochloride (DH) in Panadol night®
tablets(batch no. 124992).
2 established
DD method PLS PCR
Items methodc
PC DH PC DH PC DH PC DH
Mean 98.36 103.84 98.30 103.75 98.32 103.81 98.35 103.80
SD 0.045 0.380 0.067 0.431 0.067 0.468 0.064 0.421
N 6 6 6 6 6 6 6 6
Variance 0.002 0.144 0.004 0.186 0.004 0.219 0.004 0.177
Student’s 0.92 0.86 0.20 0.84 0.44 0.95
t-test (2.23)a (2.23)a (2.23)a (2.23)a (2.23)a (2.23)a
2.00 1.29 1.00 1.06 1.00 1.22
F-value
(4.28) b (4.28) b (4.28) b (4.28) b (4.28) b (4.28) b
a
Figures in parentheses represent the corresponding tabulated values of t at P = 0.05.
b
Figures in parentheses represent the corresponding tabulated values of F at P = 0.05.
c
HPLC method,[3].
IV. Conclusion
The present work provides new sensitive, accurate and selective analytical techniques for the
determination of PC and DH in the presence of their degradates PAP and NOD in bulk powder or in
pharmaceutical formulation. Application of the proposed method to the analysis of PC and DH in laboratory-
prepared mixtures and pharmaceutical formulation shows that neither the degradation products nor the
excipients interfere with the determination, indicating that the proposed methods could be applied as stability-
indicating methods for the determination of pure PC and DH and in the presence of the mentioned degradation
products either in bulk powder or in pharmaceutical formulations.
References
[1] Martindale, the complete drug reference(The Extra Pharmacopoeia, 31st Edition Pharmaceutical press London, 2007).
[2] The Merk Index, 13th Edition(Merk Research Laboratories Division Of Merk and Co., Inc., Whitehouse Station, NJ, 607, 2001).
[3] The United States Pharmacopeia and National Formulary (The official Compendia of Standards, Asian Edition, USP 30-NF 25.The
United States Pharmacopeial Conversion Inc., Rockvill, MD, 2007).
[4] C.Martínez-Algaba, JM.Bermúdez-Saldaña, RM.Villanueva-Camañas, S.Sagrado, MJ.Medina-Hernández, Analysis of pharmaceutical
preparations containing antihistamine drugs by micellar liquid chromatography,J Pharm Biomed Anal,40,2006, 312-321.
[5] M. L.Qi, P.Wang, L.Zhou, Y.Sun, Simultaneous determination of four active components in a compound formulation by liquid
chromatography,Chromatographia, 58, 2003, 183-186.
[6] H.Luo, L. J.Wang, J.Wang, Studies on quantitative determination of ingredients in Dextromethorphan Hydrobromide
Diphenhydramine Hydrochloride Paracetamol Pseudoephedrine Hydrochloride dispersed tablets by HPLC,YaowuFenxi
Zazhi,22,2002, 222-224.
[7] D.Ying, S. Ying, R. Yuqiu, R. Yulin, Artificial neural network for simultaneous determination of two components of compound
paracetamol and diphenhydramine hydrochloride powder on NIR spectroscopy,AnalyticaChimicaActa, 528,2005, 55-61.
[8] C. G. Héctor, CO. Alejandro,Simultaneous multivariate spectrophotometric analysis of paracetamol and minor components
(diphenhydramine or phenylpropanolamine) in tablet preparations,J Pharm Biomed Anal,20,1999, 255- 261.
[9] NW. Ali, HE. Zaazaa, M. Abdelkawy, MA. Magdy,Simultaneous Determination of Paracetamol and Diphenhydramine Hydrochloride
in Presence of Paracetamol Degradation Product, Pharm Anal Acta, 2, 2011,140.
[10] R. Kramer,Chemometric Techniques for Quantitative Analysis (Marcel Dekker, Inc.,New York,1998).
www.iosrjournals.org 52 | PageYou can also read