Applying MODIS Data for Asian Dust Weather Categorization
←
→
Page content transcription
If your browser does not render page correctly, please read the page content below
MODIS 資料在亞洲地區沙塵天氣分類之應用
Applying MODIS Data for Asian Dust Weather Categorization
Tang-Huang Lin1, N. Christina Hsu 2, Si-Chee Tsay 2 , and Gin-Rong Liu1
1
Center for Space and Remote Sensing Research, National Central University, Jhongli, 32001 Taiwan
2
Earth Sciences Division, NASA Goddard Space Flight Center, Greenbelt, MD 20771 USA
Abstract
This study categorizes various types of dust weather by means of satellite remote sensing over
central Asia. Datasets consisting of collocated products from MODIS/Aqua and surface measurements are
analyzed. Results suggest an exponential relationship between the surface visibility and the satellite
retrieved aerosol optical depth (AOD), which is subsequently utilized to categorize dust weather. The
satellite-derived spatial frequency distributions in the dust weather types are seen to be quite consistent
with China’s weather station reports during 2003, indicating that dust weather classification with satellite
data is highly feasible. Although the period during the springtime from 2004 to 2007 may be not
sufficient statistical significance, our results reveal an increasing tendency in both intensity and frequency
of dust weather over Central Asia during this time period.
Key Words: Dust weather categorization, Aerosol optical depth, Visibility, MODIS
1. Introduction al., 2005). Given the different observational aspects of
the problem, establishing a correlation between the
In recent decades, dust storms originating from the remotely sensed aerosol properties and surface visibility
arid regions in Central Asia have become more powerful for dust weather categorization is not an easy task, and
and frequent (e.g., Qiu and Yang, 2000; Wang et al., has been a subject of many ongoing studies (Qiu and
2004). The concentration of suspended particles Yang, 2000). In this study, satellite retrieved aerosol
increases dramatically when a dust storm forms. Such properties, such as optical depth, particle size and
particles can travel in long distances, swiftly reaching turbidity coefficient, are analyzed with ground-based
regions such as China, the Korean Peninsula, Japan, weather stations’ visibility data. Their respective
Taiwan, and even North America (Ichikawa and Fujita, correlation is subsequently used to categorize the
1995; Arndt et al., 1998; VanCuren and Cahill, 2002; corresponding dust weather.
Hsu et al., 2006). They can affect, among many things,
the regional air quality, environment and the energy 2. Methodology
budget of the atmosphere and surface (Siheng et al.,
1999; Liu and Shiu, 2001; Li et al., 2004; Liu and Lin, In this study, the newly developed Deep Blue
2004; Yoshioka et al., 2007). algorithm by Hsu et al. (2004) was employed to
Aside from the important dust storm intensity characterize the aerosol properties over and near the dust
research, extensive investigations on the source areas, storm source regions. The surface reflectance for a given
frequency, pathway, condition and trend of Asian dust pixel was determined from a clear-scene database based
storms have been performed over the past two decades, upon its geo-location. The reflectance measured at the
as well. In most studies, the intensity of dust weather has 412, 470, and 650 nm channels (from MODIS) were
often been categorized using standard visibility subsequently compared to the radiances in a lookup table
observations (CCMB, 1979) from ground-based weather for different solar zenith, satellite zenith and relative
stations. However, it is difficult to ensure that the azimuth angles, surface reflectance, AOD (a measure of
measurement standard is consistent among hundreds of aerosol loading) and single scattering albedo (SSA; the
stations located in China. Since satellite remote sensing probability of scattering). Finally, the dust particles can
can retrieve relevant atmospheric and/or surface be distinguished from the fine-mode pollution particles
variables more consistently over large geographic areas, based upon the Ångström exponent (AE or ; an
it is a more viable tool in obtaining a more spatially and indicator of size mode) derived by the Deep Blue
temporally coherent categorization of dust weather. As algorithm. In regard to the atmospheric turbidity,
improvements continue to be made in techniques that Ångström turbidity coefficient (β), AOD and Linke
retrieve dust properties near source regions from satellite
measurements, comprehensive analysis of these turbidity ( TL ) are typically used in turbidity
observations provide scientists with a better measurements. The Ångström turbidity coefficient can
understanding of the spatial distribution, frequency and be obtained with the retrievals of AOD and , while the
trend of dust storms (Hsu et al., 2004 and 2006; Remer et Linke turbidity is defined as the ratio of total optical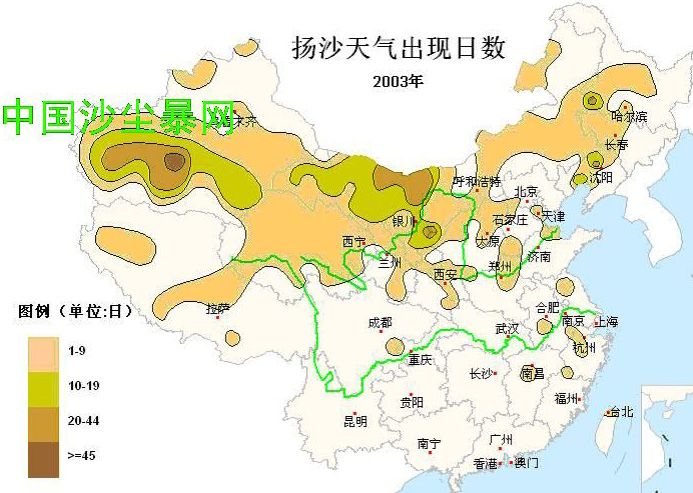
depth to that of a clean and dry atmosphere (Zakey et al., described above, aerosol properties, such as the AOD,
2004). Due to the aerosol properties can be provided AE, and SSA, can be retrieved from satellite data by
from satellite data regularly, Ångström turbidity using the newly developed Deep Blue approach. Figure 1
coefficient is employed to examine the correlation to the shows the AOD and AE distributions estimated from the
visibility in this study. MODIS/Aqua data from 1 February to 31 May in 2007.
Despite the different observed directions (vertical The AOD data displayed in figure 1a are the composite
and horizontal), the long-term and short-term surface products of Deep Blue (over land) and Dark Target
measurements still reveal an inverse relationship approaches (over ocean; Kaufman et al., 1997). There
between the AOD and visibility (Solis, 1999). The are two regions with high AOD values in the study area.
correlation between the visibility and surface aerosol One is near the northern Taklimakan Desert and the other
concentration (PM10) in the Pearl River Delta Region is below the city of Beijing. The AOD values over the
under heavy haze had been examined by the observation two areas were quite similar but, as shown by figure 1b,
of ground stations (Deng et al., 2008). The correlation the AE values were different. This indicates that the two
coefficient was about 0.8 based on an exponential regions’ particle size distribution contained different
function under a high aerosol concentration, which may particle types.
have been caused by anthropogenic pollutants. The result
suggests that the relationship between the AOD and (a)
visibility appears to be exponential rather than linear, but
somehow differs with the behavior of dust particles 70E 80E 90E 100E 110E 120E 130E
60N
revealed by remotely sensed data. They also pointed out
that there was a weak association between the aerosol
concentration (PM10) and visibility range during a low 50N
visibility event. Therefore, this study attempts to shed
light on the association between the station-measured
Taklimakan Beijing City
visibility data and satellite-retrieved AOD during dust Desert 40N
weather events. Although many studies have already
been made in calculating the correlation between the
AOD and visibility, they are mostly not for dust weather 30N
circumstances.
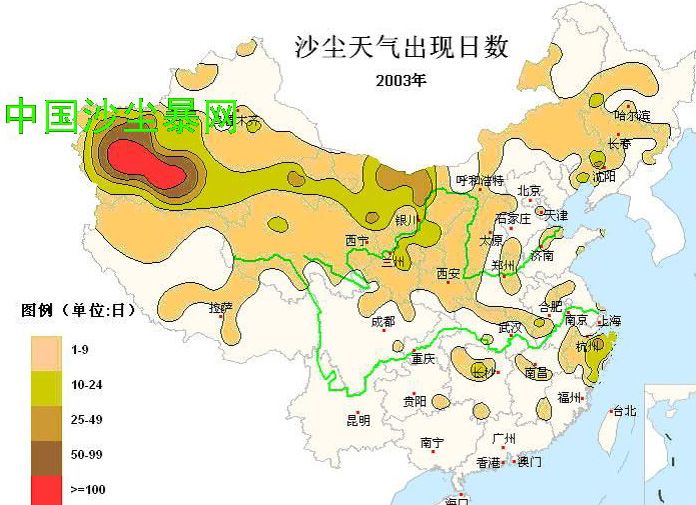
In general, four types of dust weather (dust haze,
blowing dust, dust storm and dust devil) are considered 0.25 0.5 0.75 1.0 1.25 20N
for the daily observations in China (CCMB, 1979; Qian
et al., 2002). As satellites observe very few dust devil (b)
events, only the first three types of dust weather are
70E 80E 90E 100E 110E 120E 130E
investigated in this study. After constructing the 60N
relationship between the AOD and visibility, the type of
dust event will be discerned and categorized by satellite
data based on the aforementioned definition. 50N
3. Data and results Taklimakan Beijing City
Desert 40N
In order to identify the dust weather
characteristics in eastern Asia, a region ranging from 20
30N
˚ N to 60˚ N and from 70˚ E to 130˚ E was selected
for our study area (figure 1). Two kinds of datasets are
used for the dust weather analysis. The first contains
0 0.25 0.5 0.75 1.0 1.25 20N
satellite retrieval data from the MODIS/Aqua
atmosphere daily level 3 product (available at
http://ladsweb.nascom.nasa.gov) covering the regions of Figure 1. The aerosol properties retrieved from the
interest in this study during springtime from 2003 to MODIS/Aqua data during 1 February to 31 May in 2007,
2007. The second is the ground-measured visibility data (a) Averaged AOD, (b) Averaged AE.
observed every 3 hours from about 200 ground stations
located within the study area during April 2006 (figure 1). The results shown in figure 1 completely
Our analysis also utilizes the pertinent dust weather correspond to the actual local environment, where dust
reports (from http://www.duststorm.com.cn), which was particles are the main aerosol composition (Coarse mode:
mainly used for verifying the dust weather classification The average AE is about 0.25) over the Taklimakan
result by means of satellite remote sensing. Desert, and anthropogenic pollutants (Fine mode: The
The investigation period was focused on the average AE is about 0.75 to 1.0) are heavily concentrated
springtime, which usually marks the highest level of nearby Beijing. Thus, the AE parameter serves as the
sandstorm activity. As stated in the methodology section
principal indicator for dust weather circumstances (i.e.,       distribution was quite consistent with the ground-based
dust particle identification) in the satellite analysis.        observations (see also figure 2b). These results indicate
                                                                that dust weather can indeed be categorized by
3.1 Case study of dust storm event                              satellite-observed aerosol properties.

         According to the previous discussion, the              3.2 Correlation between AOD and visibility
satellite-observed data of a significant dust storm event
(26-28 March 2004) in China was examined to determine                    The visibility observations from 204 ground
the characteristics of the particle size distribution (AE) in   stations scattered within the study area during April 2006
categorizing areas affected by dust weather. During the         were gathered in this study. The observation frequency
ACE-Asia field campaign in April 2001 (Huebert et al.,          and quality of the visibility data from each station was
2003), the monthly AE values from the AERONET                   first inspected. Only stations with more than 20
measurements in Beijing and Inner Mongolia sites were           observations and visibility values not limited to 3
0.78 and 0.82, respectively. Accordingly, the average AE        constant values are qualified for inclusion in the analysis
(0.8) was selected to identify the dust particles for the       of the correlation with the satellite-retrieved AOD. figure
dust weather classification.                                    3a displays an exponential relationship with a high
                                                                correlation coefficient (about 0.75) between the AOD
  (a) Averaged AOD 26-28 Mar, 2004(Aqua/MODIS)                  values and visibility. A similar result was observed from
                                                                the in-situ measurements during 5-day period over
                                                                South-West Germany, and the reciprocal relationship
                                                                between the horizontal visibility and the vertical AOD
                                                                was demonstrated (Baumer et al., 2008). In addition to
                                                                the AOD, the correlation between Ångström turbidity
                                                                and visibility was also examined and depicted in figure
                                                                3b. From figure 3, it can be seen that since the
                                                                relationship between the AOD and visibility was stronger
           0.25         0.5   0.75      1.0      1.25           than that of the turbidity and visibility, the AOD
   (b) Dust weather report
                                                                retrieved from MODIS data was applied to estimate the
                                                                visibility in the following dust weather categorization
                                                                discussion.

                                                                                         8.00          (a)         Y = -0.727 * ln(X) + 2.443
    Dust weather type
                                                                 Aerosol Optical Depth

        Dust Haze
                                                                                                                   R-squared = 0.58
        Blowing Dust
        Dust Storm
        Dust Devil
                                                                                         4.00

Figure 2. Dust event during 26 - 28 March in 2004. (a)
The spatial distribution of the AOD (for values of AE
less than 0.8) retrieved from MODIS. (b) The surface                                     0.00
report of dust weather types from a spatial distribution                                        0.00    4.00        8.00          12.00          16.00
perspective (from http://www.duststorm.com.cn).                                                                Visibility(km)

        Dust storm outbreaks occurred over the                                           8.00          (b)          Y = -1.069 * ln(X) + 3.164
Taklimakan Desert and Mongolia Plateau on 25 March                                                                  R-squared = 0.43

2004. The time series AOD variations from the MODIS
                                                                 Turbidity

data illustrated clearly that the dust storms from the
Mongolia Plateau passed through Inner Mongolia and                                       4.00

moved southeast during 26-28 March. The spatial
distribution of the AOD (for AE values less than 0.8)
showed that the area around the Inner Mongolia Plateau
                                                                                         0.00
experienced a strong dust storm. Meanwhile, the
                                                                                                0.00    4.00        8.00          12.00          16.00
formation of a dust storm at the Hexi Corridor, located to                                                     Visibility(km)
the west of the Taklimakan Desert area, could also be
seen (figure 2a). In addition, a heavy aerosol plume over       Figure 3. (a) Respective visibility and AOD scatter plot
the region near Bohai Bay and Yingkou City was                  of the study area during April 2006, (b) Same as (a) but
detected by the MODIS data, but was not found in the            for the visibility and turbidity.
surface weather reports. The discrepancy may have been
caused by the combination of dust particles and
pollutants in the plume. However, the overall AOD
                                                                3.3 Results of dust weather categorization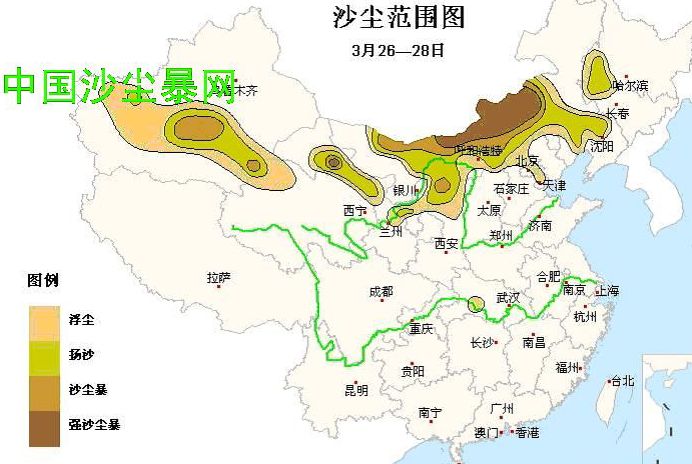
As shown in figure 3a, the surface visibility can
be calculated from the satellite-retrieved AOD when the
AE value is constrained. The criteria of the dust weather
categorization with respect to AOD and AE values and                          (a) Days of Blowing Dust in 2003
the levels of visibility over China are shown in table 1.
From the criteria listed in the table, three types of dust
weather were categorized for 2003 using the
MODIS/Aqua products.

Table 1. Criteria used for dust weather classification in
China (CCMB, 1979).                                                             1-9       10-19         20-44      > 45
                                                                              (b) Blowing Dust report of 2003

                                 AOD                     AE        VIS
  Dust Weather                                                    (km)        Frequency
                                                                              (in Days)
   Dust Haze                    < 0.769                  < 0.8    > 10
  Blowing Dust                0.769 ~ 2.443              < 0.8    1 ~ 10
   Dust Storm                   > 2.443                  < 0.8      25
                                                                              (b) Dust Storm report of 2003
to Inner Mongolia Plateau, and the eastern coastal areas
(figure 5). The spatial frequency distribution of the dust
storm analyzed by the satellite observations matched
well with the weather reports, except for the area around
                                                                              Frequency
the central Tibet Plateau and the Hexi Corridor to Inner                      (in Days)
Mongolia Plateau (figure 6).

   (a) Days of Dust Haze in 2003

                                                                           Figure 6. Same as figure 4, but for dust storm cases.

                                                                                    The discrepancies may be caused by the lack of
                                                                           satellite-observed AOD, due to the cloudy pixels or
                                                                           absence of ground observations. An analysis of the
   1-9   10-24       25-49                       50-99             > 100   number of days where aerosol information was retrieved
   (b) Dust Haze report of 2003
                                                                           from MODIS/Aqua in 2003 indicated that aerosol
                                                 Inner Mongolia            products over areas around the Tibet Plateau and the
          Taklimakan Desert      Hexi Corridor
                                                    Plateau
                                                                           Inner Mongolia Plateau were frequently absent in 2003.
                                                                           In particular, fewer than 40% of the days contained
    Frequency
    (in Days)                                                              retrievals for the region between the Tibet Plateau and
                                                                           Yangtze River Basin. This is possibly caused by the
                                                                           terrain effect or frequent cloud cover. Although some
                                                                           areas like the Tibet Plateau and the Inner Mongolia
                                                                           Plateau exhibited differences in the number of dust
Figure 4. (a) The result of dust haze spatial frequency                    weather days between the satellite observations and
from MODIS/Aqua in 2003, (b) The dust weather reports                      weather reports, the overall spatial frequency dust
of 2003 (from http://www.duststorm.com.cn).                                weather distributions from the satellite observations were
                                                                           quite similar to the dust weather reports made by the
                                                                           ground stations.
Gao, T., Y. Xu, Y. Bo, and X. Yu, 2006, Synoptic
characteristics of dust storms observed in Inner
4. Summary Mongolia and their influence on the downwind area
(the Beijing-Tianjin region). Meteorological
In this paper, the ability to use satellite product to Applications, 13, pp. 393-403.
categorize dust weather has been verified by comparison Huebert, B. J., T. Bates, P. B. Russell, G. Shi, Y. J. Kim,
to ground truth data. Due to their wide spatial coverage K. Kawamura, G. Carmichael, and T. Nakajima, 2003,
and highly consistency, satellite remote sensing offers an An overview of ACE-Asia: Strategies for quantifying
alternative to uncertain and limited spatial-surface dust the relationships between Asian aerosols and their
storm observations. Comparisons between ground station climatic impacts. Journal of Geophysical Research,
and satellite measurement revealed an exponential Vol. 108, pp.ACE1.1-ACE1.20 .
relationship with a high correlation coefficient (greater Hsu, N. C., S. C. Tsay, M. D. King, and J. R. Herman,
than 0.75) between the visibility and retrieved AOD 2004, Aerosol properties over bright-reflecting source
under dust weather conditions. Thus, the AOD criteria regions. IEEE Transactions on Geoscience and
can be used as a substitute for the levels of visibility in Remote Sensing, Vol. 42, pp. 557-569.
dust weather categorization provided that the AE value is Hsu, N. C., S. C. Tsay, M. D. King, and J. R. Herman,
constrained to be lower than 0.8. The results of dust 2006, Deep-Blue retrievals of Asian aerosol
weather classification generally conform to the dust properties during ACE-Asia. IEEE Transactions on
storm reports, except for the areas near the Hexi Corridor Geoscience and Remote Sensing, Vol. 44, pp.
and Inner Mongolia, which underestimated the spatial 3180-3195.
distribution of dust storms during 2003. The main reason Ichikawa, Y., and S. Fujita, 1995, An analysis of wet
for the discrepancy is the lack of satellite observations deposition of sulfate using a trajectory model for East
due to some cloudy cases. The effect is significantly Asia. Water, Air, and Soil Pollution, Vol. 85, pp.
mitigated when long-term data is applied. Overall, it can 1921-1926.
be seen that the dust weather categorization using remote Kaufman, Y. J., A. E.Wald, L. A. Remer, B. C. Gao, R.
sensing data can be more consistently and efficiently R. Li, and L. Flynn, 1997, The MODIS 2.1 μ m
delineated, especially for long-term dust weather channel—Correlation with visible reflectance for use
investigations. in remote sensing of aerosol. IEEE Transactions on
Geoscience and Remote Sensing, Vol. 35, pp.
Acknowledgement. The authors would like to thank 1286–1298.
Dr. Douglas Westphal for providing the visibility data, Li, F., A. M. Vogelmann, and V. Ramanathan, 2004,
and the MODIS team from Goddard Space Flight Center Saharan dust aerosol radiative forcing measured from
for MODIS data set. Also, we are grateful for the data space. Journal of Climate, Vol. 17, pp. 2558–2571.
processing assistance by Dr. Myeong-Jae Jeong. The Liu, G-R., and T-H. Lin, 2004, Application of
research was supported by the National Science Council geostationary satellite observations for monitoring
and the Environmental Protection Administration of dust storms of Asia. Terrestrial, Atmospheric and
Taiwan under grants: NSC-96-2752-M-008-005-PAE, Oceanic Sciences, Vol. 15, pp. 825-837.
NSC 96-2745-M-008-003, NSC Liu, S. C. and C.-J. Shiu, 2001, Asian dust storms and
97-2752-M-008-012-PAE, NSC 97-2745-M-008-012, their impact on the air quality of Taiwan. Aerosol and
and NSC 97-EPA-M-008-001. Air Quality Research, Vol. 1, No. 1, pp1-8.
Qian, W., L. Quan, and S. Shi, 2002, Variations of the
References dust storm in China and its climatic control. Journal
of Climate, Vol. 15, pp. 1216-1229.
Arndt, R. L., Carmichael, G. R., and J. M. Roorda, 1998, Qiu, J. and L. Yang, 2000, Variation characteristics of
Seasonal source-receptor relationships in Asia. atmospheric aerosol optical depths and visibility in
Atmospheric Environment, Vol. 31, pp. 1553-1572. North China during 1980-1994. Atmospheric
Bäumer D., B. Vogel, S. Versick, R. Rinke, O. Möhler Environment, Vol. 34, pp. 603-609.
and M. Schnaiter, 2008, Relationship of visibility, Remer, L. A., Y. J. Kaufman, D. Tanré, S. Mattoo, D. A.
aerosol optical thickness and aerosol size distribution Chu, J. V. Martins, R.-R. Li, C. Ichoku, R. C. Levy, R.
in an ageing air mass over South-West Germany. G. Kleidman, T. F. Eck, E. Vermote, and B. N.
Atmospheric Environment, Vol. 42, pp. 989-998. Holben, 2005, The MODIS aerosol algorithm,
CCMB (China Central Meteorological Bureau), 1979, products, and validation. Journal of the Atmospheric
Standard on weather observation. Meteorological Sciences, Vol. 62, pp. 947-973.
Press, Beijing, pp. 1-22 (in Chinese). Solis, J., 1999, Correlation of aerosol optical depth with
Deng X., X. Tie, D. Wu, X. Zhou, X. Bi, H. Tan, F. Li weather variables. Institute of Climate and Planets,
and C. Jiang, 2008, Long-term trend of visibility and NASA Goddard Institute of Space Studies. Available
its characterizations in the Pearl River Delta (PRD) online at
region, China. Atmospheric Environment, Vol. 42, pp. http://icp.giss.nasa.gov/research/ppa/1999/solis/.
1424-1435. VanCuren, R., and T. Cahill, 2002, Asian aerosols in
North America: Frequency and concentration of finedust. Journal of Geophysical Research, Vol. 107, on Sahel Precipitation: Relative Importance of Dust pp.AAC19.1-AAC19.16. Compared to Sea Surface Temperature Variations, Wang, X., Z. Dong, J. Zhang, and L. Liu, 2004, Modern Vegetation Changes, and Greenhouse Gas Warming. dust storms in China: An overview. Journal of Arid Journal of Climate, Vol. 20, pp. 1445 - 1467. Environments, Vol. 58, pp. 559–574. Zakey, A.S., M.M. Abdelwahab, and P.A. Makar, 2004, Yoshioka, M., N. M. Mahowald, A. J. Conley, W. D. Atmospheric turbidity over Egypt. Atmospheric Collins, D. W. Fillmore, C. S. Zender, and D. B. Environment, Vol. 38, pp. 1579-1591. Coleman, 2007, Impact of desert dust adiative Forcing
You can also read