E-census in Italia: un'analisi regionale dei tassi di risposta web - Istat
←
→
Page content transcription
If your browser does not render page correctly, please read the page content below
GIORNATE DELLA RICERCA IN ISTAT | 10-11 NOVEMBRE 2014

  SESSIONE II
  PREVENZIONE, VALUTAZIONE E TRATTAMENTO
  DEGLI ERRORI NON CAMPIONARI

  E-census in Italia: un’analisi regionale dei
  tassi di risposta web

  Linda Porciani, Luca Faustini, Alessandro Valentini e Bianca Maria
  Martelli
GIORNATE DELLA RICERCA 10-11 NOVEMBRE 2014

  E-census in Italia: un'analisi regionale dei tassi di risposta web

         Linda Porciani, Luca Faustini, Alessandro Valentini, Bianca Maria Martelli
                                                   Istat
                porciani@istat.it; faustini@istat.it; alvalent@istat.it; bmartelli@istat.it

Sommario
Negli ultimi anni anche nel campo della statistica ufficiale, l’adozione di tecniche web
per la raccolta dei dati si è sviluppata in maniera significativa grazie alle evoluzioni tec-
nologiche, ai cambiamenti negli stili di vita, alla diffusione dell’uso di Internet da parte
dei cittadini, delle istituzioni e delle imprese. Un altro fattore determinante nella diffusione
del web nelle surveys riguarda la crescente necessità di ridurre i costi di rilevazione. te-
nendo conto di questi aspetti l’Istat ha adottato tecniche miste di rilevazione nella raccolta
dati nella tornata censuaria del 2011. Questo lavoro ha lo scopo di illustrare i tassi di ri-
sposta web e alcune determinanti da rintracciare nel tessuto socio-demografico, ponendo
particolare attenzione ai differenziali territoriali. A questo proposito un caso di studio è
rappresentato dalla Toscana, dove si è registrato il più basso tasso di risposta web nono-
stante l’elevata diffusione delle ICT tra i cittadini, le imprese e la pubblica amministrazio-
ne. I risultati dell’analisi sottolineano l’importanza della cooperazione tra l’Istat e le am-
ministrazioni locali come fattore chiave per incrementare la qualità dei dati e ridurre i co-
sti. Inoltre gli stessi potranno essere utili per una migliore pianificazione del prossimo
censimento permanente.

       Parole chiave: Censimento della popolazione e delle abitazioni, strategie
multicanale di rilevazione, valutazione

Abstract
In the last years several technological innovations affected survey designs and data collec-
tion methods in Official Statistics. It has been spurred by changes in lifestyles, a wide
spread use on Internet by people and enterprises, and the development of e-government. A
further factor supporting this trend is the increasing pressure to find effective methods to
reduce costs. In this framework, the Italian National Institute of Statistics (ISTAT), in col-
lecting data for the whole 2011 Census wave, strengthened its mixed mode approach in-
troducing also the web techniques. This paper aims at illustrating the challenges of the
web application in Population and Housing Census and Enterprises Census, devoting par-
ticular care at investigating the differences in territorial web response rates. An interesting
case study is Tuscany, due to its low web response rates associated with a high ICT pene-
tration rate. Results can be useful for better planning the forthcoming (rolling) census and
for highlighting the cooperation between NSI and local administrations as key factor to
improve data quality and reduce costs.

       Key words: Population and Housing Census, Web Mode Data Collection Mode,
Process Evaluation

ISTITUTO NAZIONALE DI STATISTICA                                                                    1
GIORNATE DELLA RICERCA 10-11 NOVEMBRE 2014
General framework
The Italian National Institute of Statistics (ISTAT) adopted web technologies with the gen-
eral purpose to improve data quality, reducing costs and maximizing data timeliness and
accuracy (ISTAT, 2007). These choices marked the transition from the traditional door-to-
door census to the e-census. Specifically, web techniques affected the data collection pro-
cesses of the censuses conducted since 2010, namely Agricultural Census, Population and
Housing Census (PHC), Enterprises Census (EC) and Non-Profit Institutions Census
(NPC), and Public Institutions Census. (ISTAT 2010, 2011, 2012). In all cases, except for
the Public Institution Census, returns of the questionnaires followed a mixed mode ap-
proach – web or paper– according to the choices of respondents. For the Public Institution
Census web was the only reply mode allowed. Furthermore, a web tool called SGR (Sur-
vey Management System) has been organized in order to monitor each step of the data col-
lection process. In this framework, the main role of ISTAT Territorial Offices – regional
branches of ISTAT – was to guarantee a constant monitoring of all census operations. A
team of people specifically devoted to census activities supervised the data collection net-
work and guaranteed the training of operators. Furthermore, after the end of the PHC, EC
and NPC data collection process, census operators replied to an on line questionnaire
(named IvalCens for PHC and IvalCis for EC and NPC) focused on the evaluation of tech-
nical, organizational, and methodological innovations, including the adoption of web tech-
niques. Given the increasing importance of the web in the near statistical future, a core
question considered in this paper is represented by the analysis of features of the web re-
spondents, both in terms of geographical and individual characteristics as items able to
drive the web response rates, apart from the effective availability of internet connection
among firms and population.
The paper has been organized as follows: the first chapter has been devoted to the descrip-
tion of data and methods, the second one describes the main results of the applied models
and illustrates the case-study of a specific Italian region, Tuscany, which had the lowest
web response rate during PHC,EC and NPC; and finally the last chapter debates some
thoughts for future census planning operations.
1. Analysis of web response: data and methods
PHC, EC and NPC represent the Censuses where firstly the mixed data collection mode
(DCM) was adopted on a large scale in Italy. Studying the impact of this innovation could
be a key factor for better planning future censuses. Indeed recently, thanks to a specific law
(D.L. 83/2012), Istat officially introduced the rolling census methodology (U.S. Bureau of
Census, 2001). PHC rolling census will be completely paperless; it will start in 2016 and
will become fully operative in 2020.
A first research idea was the investigation of the relationship between raw web response
rate (WRR), the most suitable kind of response rate to monitor the quality of a DCM pro-
cess (Martelli B., 2005), and the ICT penetration rate (Istat, 2013). WRR for Population
Census and Internet penetration rate shows a weak and inverse correlation level (r=-0,38
for Italy) suggesting to focus the analysis on other factors in order to better explain the
general behavior of web respondents observed in Italy during the last censuses (Figure 1).
Figure 1 – ICT penetration rate (horizontal axis) and WRR of PHC (vertical axis) in the Italian regions
(NUTS 2). Percentage values. Bubbles size is proportional to the households’ number
ISTITUTO NAZIONALE DI STATISTICA 2GIORNATE DELLA RICERCA 10-11 NOVEMBRE 2014
50
45 Sardinia
Molise
Campania
40 Calabria Apulia
Friuli V.G.
Lazio
Abruzzo
Marche
35
Basilicata
R = ‐0.38 Lombardy
Sicily Liguria
30 Umbria Aosta Valley
Piedmont Veneto Emilia Romagna
25
Südtirol
Tuscany
20
40 45 50 55 60 65
The driving idea is that web response could be linked to the specific characteristics of the
complex social system where survey units, persons, household and enterprises are settled.
As literature shows (Bech M. et al., 2009), socio-demographics features influence the web
propensity to surveys reply: gender, age, income, education level, civil status and health
status are some items often included in this kind of analysis. Unfortunately, at present a re-
lease of the complete micro census dataset is not yet available; for this reason, covariates
have been limited to some demographic and economic census data1, the IVALCENS and
IVALCIS ex-post evaluation surveys (Stassi G. et al., 2013), and the ICT survey data2
(ISTAT, 2013).
2. Main results
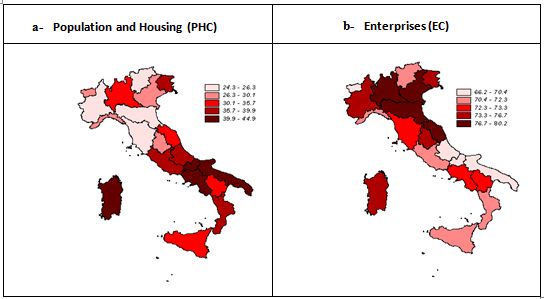
The web response rate mean by region is 33% in case of PHC and 74,7% in case of EC,
even if a high variability across regions has been observed. As shown in Figure 2, WRR
are not homogeneously distributed in the whole country. Following the regional level of
analysis, areas with the highest WRR in the PHC are Sardinia (44.9%), Molise (41.3%),
Apulia (40.6%) and Campania (40.5%). Vice-versa Trentino Alto Adige/Südtirol and Tus-
cany show the lowest recorded levels (24.3% and 24.5% respectively). In case of Enter-
prises Census, the region with the highest WRR is Veneto (80.2%), followed by Emilia-
1
Census data are available on: http://dati.istat.it/
2
Data are available on: http://www.istat.it/it/archivio/48388
ISTITUTO NAZIONALE DI STATISTICA 3GIORNATE DELLA RICERCA 10-11 NOVEMBRE 2014
Romagna (78%). The lowest levels are those of Molise (66.2%) and Val d’Aosta (68.1%).
Moreover, WRR of PHC and of EC are substantially uncorrelated (R2=0.11). In fact, for
PHC areas with the highest web response rates are located in the Southern part of Italy and
in the Islands; for EC, regions with the highest WRR are located in the North-Eastern part
of the peninsula. At the same time, for EC the lowest rates are located in the North for
PHC and in the South.
Figure 2 - Web response rates for Population and Housing and for Enterprises census in Italian re-
gions. Percentages: Quintiles distribution
WRR has been analysed at regional level through a logistic regression model applied to the
odds of WRR with six covariates for the PHC and three covariates for the EC. The model
is:
WRR n
log o i xi
1 - WRR i 1
All explaining variables are dichotomized using the median value and the baseline group
(reference) is that with values lower than the median.
The covariates for PHC analysis are the following3:
- Ageing index4 [Age]. The median value is 159.4: cut off between “young” and “old” re-
gions.
- Quota of foreigners [Foreigners]. The median value is 8%, cut off between low and high
presence of foreigners.
- Average family size [Family]. The median value is 2.3, cut off between large and small
family size.
- Quota of municipalities (LAU 2) over 20,000 inhabitants [Large Munic]. The median
quota is 4.3%, cut off between urban and rural regions.
3
In square brackets the name of variable used in the model
4
Ageing index is the ratio between the population over 64 years and the population less than 15 years.
ISTITUTO NAZIONALE DI STATISTICA 4GIORNATE DELLA RICERCA 10-11 NOVEMBRE 2014
- ICT users’ quota [ICT]. The median is 54.9%, cut off between cabled and not cabled re-
gions.
- Ex-post evaluation level of web mode data collection [Evaluation]. The evaluation sur-
veys collect data about the assessment of census operators also about the web data collec-
tion mode in a scale between 0 (minimum appreciation) and 3 (maximum appreciation).
The median value is 2.4; regions with a higher score have a good appreciation of the web
channel.
The covariates of the EC model are the followings:
- Quota of foreigner entrepreneurs [Foreigners]. The median value is 1.5%.
- Quota of enterprises with 10 or more employees [Large Enter]. The median value is
4.4%.
- ICT users’ quota [ICT], the same variable used in PHC model.
Table 1 and Table 2 show the results for the PHC and EC model. It is interesting to note
that results are quite similar for ICT use and size of municipalities (or enterprises). Areas
where web use is more spread have higher level of WRR. As a consequence, increasing the
use of technology will probably boost the web survey response rates. According to the lat-
est data released by Istat (Istat, 2013), the quota of web users markedly increased in the last
years (more than 5%), this should imply a rise in WRR. Furthermore around 86% of fami-
lies with a child less than 18 years use Internet at home. Vice versa only 13% of alone el-
derly (65 years and more) has a connection to Internet. Policies aimed to promote the use
of Internet especially for old people could be effective for the use of web in official sur-
veys and censuses.
A second insight regards the size of enterprises or municipalities, which has a positive cor-
relation with WRR. Probably, this type of correlation is affected by some typical organiza-
tional “biases” such as: the higher the number of units to collect (or their complexity), the
more significant the actions realized by census operators to promote web compilation. In-
deed, management of web questionnaires respect to paper ones is easier and faster for cen-
sus operators, so it is very convenient for them to support the web strategy. Instead census
operators which work in areas with simpler or less numerous organizations have to manage
simpler questionnaire and they can easy do it by hand. In planning new surveys it should
be also important to take into consideration the workload for survey units and for the dif-
ferent actors involved in the data collection process, such as municipalities or chambers of
commerce, in other words at micro and at macro level.
Finally individual characteristics such as citizenship or age affect the use of web. Foreign-
ers and old people tend to have in general a weak approach to web: this is confirmed by
applied models. So, in a society with an increased presence of foreigners and elderly tar-
geted actions focused on those sub set of population could be the keystone to increase
WRR.
Table 1 – Results of the model for PHC. Italy
Code Name Variable Parameter Estimate (β) P-value Effect:Exp (β)
Intercept -0.8517 159.4 -0.1011 8.0 -0.1234 2.3 0.0553 4.3 0.0116 54.9 0.1163GIORNATE DELLA RICERCA 10-11 NOVEMBRE 2014
Table 2 – Results of the model for EC. Italy
Code Name Variable Parameter Estimate (β) P-value Effect:Exp (β)
Intercept -0.9268 1.5 -0.0366 4.4 0.2818 54.9 0.0296GIORNATE DELLA RICERCA 10-11 NOVEMBRE 2014
Code Name Variable Parameter Estimate (β) P-value Effect:Exp (β)
Intercept -10.856 200.3 -0.079 7.5 0.0089 2.3 -0.187 5.6 0.0783GIORNATE DELLA RICERCA 10-11 NOVEMBRE 2014
of the organization system), and to a lesser extent the ICT users quota. Again, the foreign
entrepreneurship quota has a negative impact on the web response rates.
Then, in order to increase the web response rate, it could be useful to provide policies to
support the dissemination of knowledge, and use of computer tools for foreign and elderly
population, especially located in small domains (municipalities /enterprises). Further de-
velopments of analysis will be conditioned by the availability of additional information; as
soon as more data will become available it will be possible focusing on further features be-
sides the ICT literacy. This latter in fact is a very important motivation in web participation
but also a numerous set of social, demographic, and territorial characteristics could play an
important role to ensure an high participation rate.
References
Bech M., Bo Kristensen M.B. Differential response rates in postal and Web-based surveys among older re-
spondents, Survey Research Methods: 2009, Vol.3, No. 1, pp.1-6.
Istat. La progettazione dei censimenti generali 2010-2011. Analisi comparative di esperienze censuarie estere
e valutazione di applicabilità di metodi e tecniche ai censimenti italiani. Roma: 2007. (Documenti
n.9/2007).
Istat. Istruzioni per la rilevazione del 6° censimento generale dell’Agricoltura. Handbook of census. Catan-
zaro: 2010, Rubettino Print.
Istat. Istruzioni per la rilevazione del 15° censimento generale della popolazione e delle abitazioni. Handbook
of census. Roma: 2011. Postel.
Istat. Istruzione per la rilevazione – censimento dell’industria e dei servizi 2011. Handbook of census. Catan-
zaro: 2012. Rubettino Print.
Istat. Cittadini e nuove tecnologie. Roma: 2013 (Statistiche report,19 dicembre),
http://www.istat.it/it/archivio/108009.
Martelli, B.M. Relationship between response rates and data collection methods. Paper presented at OECD
Workshop / European Commission Working Group on Business Tendency and Consumer Opinion Sur-
veys, Brussells: 2005, November.
Stassi, Giuseppe, Valentini, Alessandro. L’Italia del censimento. Struttura demografica e processo di rileva-
zione. Roma: Istat,2013.
U.S. Bureau of Census. Introduction to Census 2000 Data Products. MSO/01-ICDP. Washington
D.C.:2001Available on http://www.census.gov/prod/2001pubs/mso-01icdp.pdf
ISTITUTO NAZIONALE DI STATISTICA 8You can also read