ELEMENTARY SCIENCE FAIR MANUAL 2018-2019 - Hernando County School ...
←
→
Page content transcription
If your browser does not render page correctly, please read the page content below
ELEMENTARY SCIENCE FAIR MANUAL 2018-2019
The School Board of Hernando County, Florida Superintendent of Schools
                            John Stratton

                    Director of Academic Services
                           Gina Michalicka

                  Supervisor of Elementary Programs
                          Michelle T. Barash

                           Board Members
                              Susan Duval
                           Linda K. Prescott
                           Gus Guadagnino
                               Kay Hatch
                             Jimmy Lodato
Vision: We’re all about students!

Mission: The Hernando County School District collaborates with parents and other community stakeholders to
effectively prepare all students for a successful transition into a diverse and changing world.

Guiding Principles:

We believe:

Education is the foundation for a better future.

Family and community involvement are critical to a high quality educational system. Diverse individuals, ideas, talents,
and learning styles strengthen our communities.
All stakeholders share in the responsibility and decision-making part of supporting student success and school
improvement.

Individuals and organizations are accountable for their behaviors and actions.

Commitment to teaching methodologies that foster student engagement, critical thinking, and content mastery will
prepare all students to graduate ready for work and postsecondary education.

Shared purpose, collaboration, commitment to continuous improvement, and an innovative spirit are essential in
effective teaching cultures.

Safe, caring environments are essential for learning and the well-being of all students.

High expectations and recognition empower individuals and lead to improved performance. Aligned expectations and
policies that reflect best business practices are essential for success.
Elementary Science Fair Manual Guidelines

This booklet describes the requirements and procedures for completing a Science Fair project.

The Scientific Method Project: Scientists use an orderly approach to learn new information and to solve problems. This is
called the scientific method and includes making observations to form a hypothesis, designing an experiment to test a
hypothesis, separating and controlling variables, and interpreting data. This method can be used to develop a science
fair project. All individual students and classes may complete this type of project. Students in grades 3-5 may do only
scientific method projects. Only scientific method projects will be eligible to participate in the district competition.

Please take the time to read this booklet carefully. An attempt has been made to fully explain all criteria and judging
procedures. It is recommended that you take time to review the judging sheets. If you have questions that are not
answered in this booklet, or if you need assistance, please contact your site based Science Fair Coordinator.

Selecting a Topic
Thoughtful consideration of several factors will help you choose a good topic for your science project. Consider topics
related to your hobbies, sports activities or life experiences. This will help you find a topic that is age-appropriate and
highly motivating. You may wish to probe for ideas within areas of study that are suggested by the Big Ideas in Florida’s
Next Generation Sunshine State Standards.

Next, choose a topic for your project that can be thoroughly studied and displayed within a time frame that is
reasonable and productive. Finally, if you have identified several topics to choose from, pick the one with the best
competitive edge. Novel projects with unknown results are better than overused, cook-book type projects. Projects that
require actual measurements yield more points then counted responses. All topics must be approved by the School
Science Fair Director prior to starting the project. Topics must comply with School Board Policy and FLDOE safety
guidelines.

Project selection is often frustrating because there are so many things to think about. Yet, it should be noted that doing
a science experiment is an ultimate exercise in thinking skills, strategizing, and problem solving. Seeing a project through
from deciding on a good topic to completion, and even competition, is a highly rewarding and profoundly important
learning endeavor.

Scientific Method Competition Guidelines
A science fair project has two main parts. They are the project board and the notebook.
   Participation will be judged according to grade level in both school-based and District
Science Fairs.
   Each project will be evaluated prior to interviews. Students must earn a designated number of points for the project
board and the project notebook in order to be eligible to be interviewed. Students must earn a minimum of 42 points on
the Scientific Method Project Notebook and earn a minimum of 72 points on the Scientific Method Project Board to be
interviewed.
Two judges will interview students eligible to be interviewed. Ties will be broken by a third interview and/or a
consultation of two or more objective observers in the school based science fair.

   Winning projects will be determined by totaling the points earned on the project board, the notebook and the
interviews.

   Any project that has been copied from another source and does not reflect the student’s original work, doesn’t follow
Fair guidelines and criteria, or repeated submissions will be disqualified.

  Students will be recognized for their participation in Science Fair.

   Individual winners of the District science fair may include any of the following options:
Trophy, medal, ribbon, or certificate MAY be awarded for each participant
Top 1/3rd top award
Middle 1/3rd second place
Bottom 1/3rd third place
Top score in each grade level will be awarded a Best of Show trophy

Award MAY be given to District First Place Class winner
   ● ribbons or certificates to one District class project per grade level

Criteria for Participation in the Scientific Method Competition
Projects not accepted: projects using allergens (i.e. mold), human/animal tissue/fluid, weapons or alcohol will be
accepted.
    ● All projects must be represented through photos or drawings. (No three-dimensional items may be attached to
         the project boards or brought to judging.) Glue or tape should be used to attach materials to the project board.
         PROJECT USING STAPLES OR ANY SHARP ITEMS WILL NOT BE ACCEPTED.
    ● No project which involves inflicting harm, injury or death of vertebrate animals will be accepted.
    ● The student should be able to set up the project backboard. The backboard must be free standing.
    ● Project boards must be no larger than 4 feet wide and 3 feet high.
    ● Project notebooks must accompany project boards.
    ● The student should be able to describe orally the details of the project.
    ● Class projects should include current year data and current enrolled students.
The student should use the judging sheet to make sure that all components of the scientific method are included in the
project.

A scientific method project is an investigation to discover the answer to a scientific problem. Scientific method is the
“tool” scientists use to find the answers to questions. It is a process of thinking through the possible solutions to
problems and testing each possibility to find the best solution. The scientific method involves the following steps:
identifying the problem or purpose of the project, stating a hypothesis, conducting project experimentation, reading
information about the topic, and reaching a conclusion.

Scientific Method Project Notebook
Students should begin their project by using their notebook to write research summaries, record data, describe
observations, and record data concerning their project. Students should use the information from the notebook to put
together the project board.

All items described below must be included in the project notebook. Each item must be clearly labeled.
Written report
● Read minimum of two books or articles related to the project.
● Take notes while reading.
● Summarize in your own words information learned from reading.
● Relate the reading materials to the project.
● Include a list of at least two sources in the report.
● Credit should be given to any individual that assisted with the project.
● Answer these questions when writing report
• Why were these topics chosen?
• How does the text evidence support my experiment?
• How will this information help me understand my experiment?
Sources List – Your sources list may include two or more of the any of the following:
● Books – Title, Author’s first and last name, pages read
● Magazines/Periodicals – Article Title, Author, Magazine Title, Date
● Internet sites – Title of article, Author(s), Internet address, Access date
(Internet sources must be reliable; no Widipedia)
● Experts in the Field – First and last name, Job Title or occupation, Date of Interview
Data Collection
Part of doing an experiment is observing and recording information about what is happening when one part of the
experiment is changed. This is called data collection. Details about the data collection should include measurements
and descriptions that can be written down in a journal or log. All of the following must be included in the data collection
section.
Observation Log
● Dates, times, measurements, conditions of experiment
● Description of all observations
Data Collection
● Minimum of three trials
● Control Group identified
● Comparison of Control Group average to the other trials
Variables
● Control Group
● Constant Variables
● Independent Variable
● Dependent Variable
Identify the Control Group. Control Group is used as the standard that you compare your other groups to. If you are
comparing product performance, set criteria so that you have something to compare the results of your project to. (Ex:
“most used,” “most sold” or “product claims”). Constant Variables is a long list of conditions in the experiment that
are kept the same. Identify the Independent Variable, the part of the experiment that is intentionally changed.
Identify the Dependent Variable, the part of the experiment that change in response to the Independent Variable. Give
details about the metric measurements taken.
Title
Title must appear on the cover of the project notebook, and it must be on the project board.
Scientific Method Project Board
The science fair project board must include a purpose, hypothesis, procedure with safety concerns, variables, materials,data display, title and conclusion. Each part must appear on the project board and be clearly labeled. Some of the information is taken from what is recorded in the notebook. Purpose The purpose of the project is a scientific question that can be solved by careful testing. It should be expressed as an “open-ended” question. An open – ended question is a question that is answered with a statement, not just a yes or no. For example, “How will the mass of a ball affect its speed when rolled down a ramp?” Try to limit the scope of the question to be answered and choose a problem that can be solved experimentally. The question should appear on the project board under the label “purpose”. Hypothesis A hypothesis is an idea about a solution to the question/purpose of the project. It is an educated prediction about what will happen when the experiment is completed. All of your project experimenting will be performed to test the hypothesis. (i.e.: If a plant receives more light, then the plant will grow faster because…….) Write your hypothesis statement using an “If______then_________because______” statement. Provide a prediction based on your past experience or from research. State facts and use text evidence to support your opinion and/or use examples that demonstrate your hypothesis. State hypothesis before beginning the experiment. The hypothesis should never be changed even if experimentation does not support it. Variables Begin experiment with a Control Group. The Control Group is the standard for comparison to see what affect changing the independent variable has on the dependent variable (outcome). If there is no set standard for experiment, then establish a criterion that you will compare your experiment to. (The battery I chose will be compared to XXXXXX because it’s the most used /most sold battery. Provide statistics to validate your criteria). Next, must be a detailed explanation of the variables. There are three kinds of variables that must be identified in the experiment. The Constant Variables are the parts of the experiment that are not hanged but remain the same throughout all experimentation. This is a detailed and complete list of conditions that remain the same throughout the experiment. Independent Variable, sometimes called the manipulated variable, is the one thing that has been intentionally changed in the experiment. There should only be ONE Independent Variable, one condition that is changed on purpose. Dependent Variable, sometimes called the responding variable, is the variable that is being observed and changes in response to the Independent variable. Variables should be titled on the board so the judges can identify this part. Procedure Safety: (Should be listed at the beginning of the procedural section.) All safety concerns should be identified in the procedure section on the board. If there are no safety concerns, please state that. Note: No projects dealing with micro-organisms, guns, or alcohol are allowed. The procedure section is a detailed description of how the project is done. First, detailed and specific step-by-step directions are written to describe how the experimentation will be done. The directions should explain how the measurements will be made. Metric measurement is required. If your experiment has no metric measurement, (for example you are counting specific items) please state that in your procedure. The next part of the procedure is a detailed description of a minimum of three trials. This description of the procedure must include an explanation of what has been observed and the metric measurements that have been made. It should also include how the experiment compares to the control group. The dates, times and conditions of each trial must be recorded in the notebook. Materials All materials used in the experiment should be clearly identified. The materials list must include specific information AND metric measurement about the amount of the materials and equipment being used in the experiment. Identify all metric measurement tools used, (ie: stopwatch, metric ruler, graduated cylinder, Celsius thermometer.) Data Display The data display is the place to organize the results of your experimentation. The results of the three trials should be organized into a chart or graph. Careful considerations should be given to selection the type of graph or chart that will
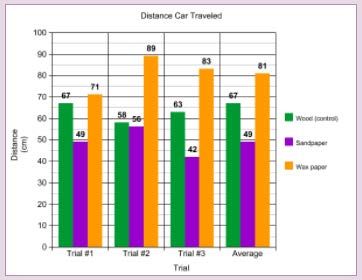
illustrate what happened in your experiment. There are 2 main types of graphs.
A bar graph- is used to display data that does not occur in a continuous manner.

Purpose: How does the road surface affect the distance the car travels?

A bar graph must include the following:
     ●        Title: The Title is a short description of the data being displayed.
     ●        Average of all trials.
     ●        Control Group labeled
     ●        A comparison of your results COMPARED to the Control Group.
     ●        Key or legend.
Plan your graph so that your data will be evenly distributed across the horizontal and vertical axes.

A line graph is used to show a relationship between the results. It is the appropriate tool to use when the responding
variable occurs over a specified period of time. A final line graph should include the average of all trials.

 A graph must include the following:
    ●        Title - the title is a short description of the data being displayed.
    ●        Label the horizontal and vertical axis.
    ●        Key or legend.
    ●        Control group labeled.
    ●        Final averages of all trials.
    ●        Averages compared to Control Group
    ●        Plan your graph so that your data will be evenly distributed across the horizontal and vertical axes.

Conclusion
The project conclusion is a summary of the results (data) of the project experimentation and a statement of how the
results relate to the hypothesis. The conclusion should explain if the hypothesis was supported or not supported. The
student must offer an explanation for the results of the experiment using data to support their explanation. Inferences
should be drawn from the data that has been collected as well as material that has been read. It includes ideas for
further experimentation and how this information relates to real life. Information from written report should be
included. Reasons for experimental results that are contrary to the hypothesis should be included. If results do not
support hypothesis:
● The hypothesis should not be changed.
● Include experimental results that support your hypothesis and results that do not support your hypothesis.
Include data in your conclusion.
● Give possible reasons for the difference between your hypothesis and the experimental results.
● Give ways that you can experiment further to find a solution
Each part of the project must be clearly labeled. Student work should be evident. Writing should be easily read or it may be typed.
All of the following items must be a part of the display and labeled properly. The following diagram is the suggested order of
placement of items on the board. The following labels must be on the Project Board: Purpose, Hypothesis, Control Group and
Variables, Title, Procedure (with Safety Concerns), Data Display, Materials and Conclusion. The following diagram is the suggested
order of placement of items on the board. Sample Scientific Method Project Board:
Project Boards must be no longer than 4 ft. wide and 3 ft. high and must fold flat. NO 3D objects may be attached to
the board. Student name/Class, grade level and school name must be on the back and bottom of the center panel.
Title
When the project board has been completed, the student must develop a title for the project that reflects the theme of
the project. The title must appear on the project board and the cover of the notebook.
Score Sheet for Scientific Method Project Notebook Grades Pre K-5
Project Name_________________________________ School_______________________ Grade_______0=Does not appear 1=Attempt made to include 2=Adequately Addressed 3=Addressed completely 4=Superior (goes above and
beyond)
WRITTEN REPORT:
Student titles and summarizes information read in student’s own words 01234
Summary includes information about: ‘Why were these topics chosen?’ 01234
Summary includes text evidence: ‘How does the text evidence support the experiment?’ 01234
Summary includes: ‘How will this information help ME understand my experiment?’ 01234
Identifies a minimum of two sources 01234
VARIABLES:
Identifies Control Group and Criteria for choosing the group 01234
Lists all the Constant Variables 01234
Identifies the Independent Variable 01234
Identifies the Dependent Variable 01234
DATA COLLECTION:
Observation Log includes: Dates, Times, Conditions, and Description of experiment (see example) 0 1 2 3 4
Describe Observations of experiment as it is conducted based on appropriate and safe senses 01234
Chart/Graph identifies a minimum of three trials 01234
Compares an average of trials to the Control Group 01234
FORMAT:
Student participation is evident (project may be typed or hand written and may include photos) 01234
Notebook is organized with sections clearly labeled 01234
Students must earn 42 points on the notebook and 72 points on the project board to be interviewed.
_____________ ____________
Judge Number Total Points
Examples of formatting Sources:
BOOKS:
________________________________________ ______________________ _____________________ ______
Book Title Author’s Last Name First Name Page #
INTERNET SITE:
_____________________ ______________________ _____________________________________ ___________
Title of Article Author(s) Site address Access date
EXPERTS in the FIELD:
___________________________________________ ______________________________ __________________
First and Last Name Job Title/Occupation Interview Date
Score Sheet for Scientific Method Project Board Grades Pre K-5
PROJECT BOARD MAY NOT BE 3D or HAVE ITEMS ATTACHED: PROJECT WILL BE DISQUALIFIEDProject Name__________________________________School_________________________ Grade________
0=Does not appear 1=Attempt made to include 2=Adequately Addressed 3=Addressed completely 4=Superior (goes above and beyond)
Title Reflects theme of the project 0 1 2 3 4
Purpose Stated in question form (with scientific vocabulary) in a “How does 0 1 2 3 4
the___________affect how the_____________?” statement.
Hypothesis Uses previous knowledge, text evidence and/or examples to predict the 0 1 2 3 4
outcome of the experiment in a “If_________then__________
because___________” statement.
PROCEDURE
List all steps taken with specific details. Metric measurement is used. 0 1 2 3 4
Project experiment is original, scientifically relevant, and innovative 0 1 2 3 4
Describes a minimum of three trials 0 1 2 3 4
Design of experiment is valid and sound 0 1 2 3 4
Safety Issues are recognized 0 1 2 3 4
VARIABLES
Identifies Control Group and establishes Control Group criteria 0 1 2 3 4
Identifies all Constant Variables 0 1 2 3 4
Identifies Independent Variable 0 1 2 3 4
Identifies Dependent Variable 0 1 2 3 4
MATERIALS
List all materials used 0 1 2 3 4
Lists specific measurement tools used 0 1 2 3 4
DATA DISPLAY
Complete and appropriate chart/graph is present (Control Group is labelled) 0 1 2 3 4
Identifies three separate trials and includes an average of three trials 0 1 2 3 4
Labels graph/chart correctly includes key or legend 0 1 2 3 4
CONCLUSION
Explains results based on hypothesis 0 1 2 3 4
Includes data in explanation 0 1 2 3 4
Uses information in written report 0 1 2 3 4
Explains how results relate to real life application 0 1 2 3 4
Includes information about further experimentation 0 1 2 3 4
FORMAT
Neat and attractive appearance (hand written work must be legible) 0 1 2 3 4
Grammar and spelling correct 0 1 2 3 4
Reflects student’s participation (may be typed and include photos) 0 1 2 3 4
Students must earn 72 points on the project board and 42 points on the notebook to be interviewed.
Judge Number______ Total points________
Score Sheet for Scientific Method Interview Grades Pre K-50=Doesn’t answer 1=Attempts answer 2=Addressed adequately 3=Addressed completely 4=Superior (goes above and beyond)
Project Name_________________________________ School_________________________ Grade________
Questions
1. What is the purpose of this project? 0 1 2 3 4
2. What was your hypothesis, and why did you choose it? 0 1 2 3 4
3. What are the steps to run your experiment? 0 1 2 3 4
4. What parts of the experiment stayed the same? (Constant Variables) 0 1 2 3 4
5. What part of the experiment was changed on purpose? 0 1 2 3 4
(Independent Variable)
6. What was the Control Group and why was it chosen? 0 1 2 3 4
7. What was observed as you were running the three trials? 0 1 2 3 4
8. What was the result of the change that was made? (Dependent Variable) What 0 1 2 3 4
was the data of the experiment? (Use board info to explain.)
9. How did the result of your experiment support or not support your hypothesis? 0 1 2 3 4
10. How could this information be used in life? 0 1 2 3 4
Judge Number_____________ Total Points
Judges will ask each question. Students will describe their project, explain what they did, and how they
conducted their experiment. Judges may reword/restate questions for younger students as necessary.You can also read