The 2021 Census: What's happening north and south of the border? - Amy Wilson, Census Director - Communications -presentation RSS
←
→
Page content transcription
If your browser does not render page correctly, please read the page content below
The 2021 Census: What’s happening
  north and south of the border?

                  Amy Wilson, Census Director
      Scotland’s Census 2021, National Records of Scotland.

 Garnett Compton, Head of Census Statistical Design and Outputs
           Census 2021, Office for National Statistics.
Introductions
        What to expect…
         UK harmonisation

       What’s new for 2021?

The challenge of “primarily online”

      2021 topics & questions

Statistical processing, SDC & outputs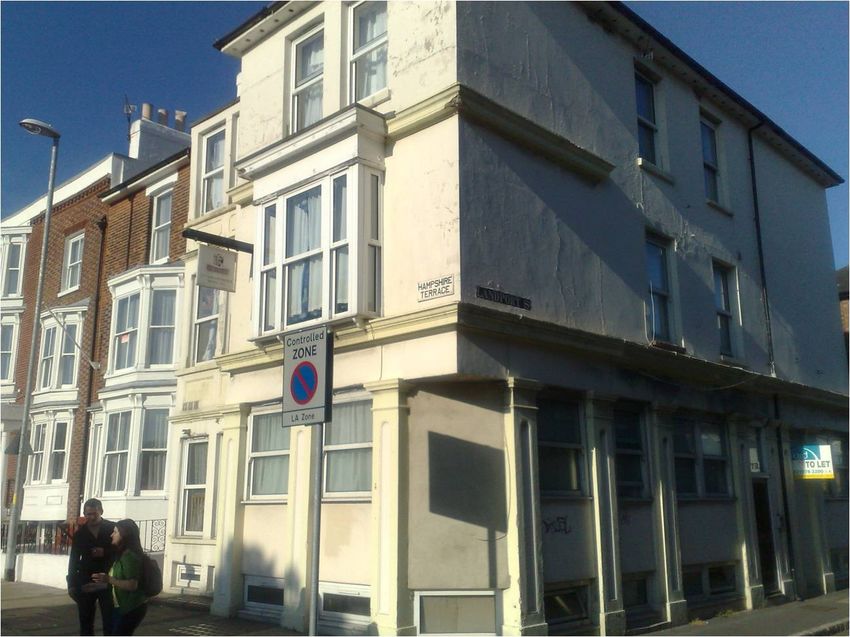
UK Harmonisation
•   Why harmonise?
     – Need for UK data and comparisons across whole of UK. Also required by Eurostat to
       produce data for member states
•   Censuses in the UK since 1801
•   Managed separately in Scotland since 1861
•   Whilst conducted under same legislation (the Census Act 1920), the
    Scottish Parliament has been responsible for Scotland’s Census since
    2001
•   UK Parliament (and WAG) responsible for Census in England & Wales
•   Therefore always and perhaps increasing risks that they might do different
    things.
Harmonisation by design
      Programme objectives - Scotland
  Produce high-quality census outputs that meet user needs

                 Maximise overall response

        Produce timely outputs to maximise benefits

  Protect, and be seen to protect, confidential information

                Do so in a cost effective way

Make recommendations for the approach to future censuses in
                       Scotland
Harmonisation by design
     Programme objectives – England and Wales
          Run a high quality 2021 online census data collection operation

Maximise overall response. Produce integrated outputs from census, administrative
                                and survey data
 Produce timely outputs to maximise benefits. Make a recommendation about the
  future nature of the census and methods for production of population statistics
                                   beyond 2021

             Protect, and be seen to protect, confidential information

  Do so in a cost effective way. Maximise the potential for wider benefits to ONS

Make recommendations for the approach to future census. Provide value for money
 Maximise benefits from Census for all stakeholders (local and central government,
                      public, private and voluntary sectors)
Potential difference across the UK – what
        did that look like for 2011?
                            Religion
        Scotland                          England and Wales

Same topic, different question (and response options)
Potential difference across the UK – what
       did that look like for 2011?

                  Ethnicity

            Scotland          E&W

              Same questions,
              different response
              options.
Potential difference across the UK – what
       did that look like for 2011?

                         Unique questions
What did 2011 look like?
                                   Scotland              England and Wales
Delivery/ contact method     Hand delivery of forms         Post out of forms
Enumeration and follow up       6,000 field staff.      Prioritised follow up with
                            Addresses treated equally   around 35,000 field staff
 Online response option       Introduced, but form        Introduced, but form
                              design for paper first      design for paper first
     Questions and            38 individual and 12         43 individual and 14
     questionnaire            household questions          household questions
  Outputs – timing and       First results, 20 months   First results 15 months and
       content                with huge number of          huge number of tables
                                tables and limited         with limited flexibility
                                     flexibility
    Use of admin data           Quality assurance           Quality assurance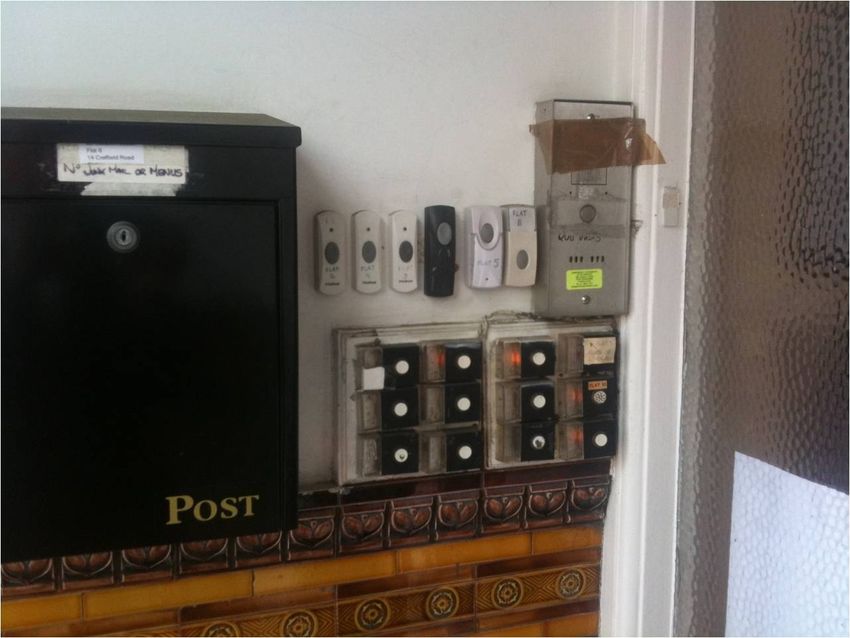
Does harmonisation matter to you?
What’s new for 2021?
                                   Scotland              England and Wales
Delivery/ contact method    Post of Internet Access       Post of Internet Access
                                      Code                          Code
Enumeration and follow      Different treatment and       Different treatment and
         up                    targeted follow up            targeted follow up
Online response option      Designing for online first   Designing for online first
     Questions and         Initial view published post   Initial view published post
     questionnaire             consultation but still        consultation but still
                                  working on this               working on this
  Outputs – timing and     Within a year and fewer      Fewer tables, increased
       content                  tables, increased        flexibility. But always
                             flexibility. But always   maintaining confidentiality
                           maintaining confidentiality

   Use of admin data         Planning, processing,         Planning, processing,
                             quality assurance and         quality assurance and
                             alternative estimates         alternative estimates
2021 - making contact with
householdsThe challenge ..... Why it’s hard • We have an excellent starting point but addresses are complicated and change a lot. There will be error & error clusters itself in the areas we care about the most – Very difficult to check quality • Extracting the right ones is difficult. Small errors can be significant – and cause trauma • Communals are important and particularly challenging • We plan to do MUCH more with addresses than post-out – huge opportunity but attribute thinking is new • Addresses are complex so matching is really hard
Flat 1                Flat 2
The Emerging
     Flat 3  Strategy
              Flat 4
        what’s the plan?
     Flat 5                Flat 6

     Flat 7
7
The Emerging Strategy
      what’s the plan?
5 ? 5 B
2 4
10The challenge ..... Why it’s hard this time • We have an excellent starting point but addresses are complicated and change a lot. There will be error & error clusters itself in the areas we care about the most – Very difficult to check quality • Extracting the right ones is difficult. Small errors can be significant – and cause trauma • Communals are important and particularly challenging • We plan to do MUCH more with the register than post-out – huge opportunity but attribute thinking is new • Addresses are complex so matching is really hard
The challenge ..... Why it’s hard this time
• We have an excellent starting point but addresses are
  complicated and change a lot. There will be error & error
  clusters itself in the areas we care about the most – Very
  difficult to check quality

• Extracting the right ones is difficult. Small errors can be
  significant – and cause trauma

• Communals are important and particularly challenging

• We plan to do MUCH more with addresses than post-out – huge
  opportunity but attribute thinking is new

• Addresses are complex so matching is really hard
Lists of Linked to Linked to Compared to
communals Address Business counts from
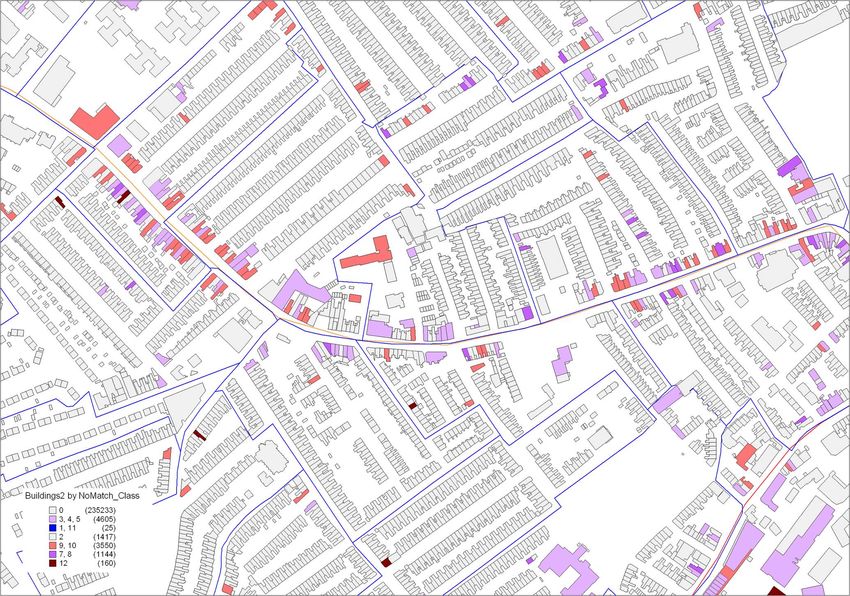
Index Index admin dataAddressing
Non-Response Follow Up
Follow up - Scotland
•   The final HtC Index will provide a ranked list of the ~7,000 datazones based on
    their expected difficulty to enumerate.
•   Previous distribution from 2011 (for illustration)

•   Once operation underway, the field force will be deployed based on need
    prescribed by the business rules
•   These will balance need to maximise response overall with minimising variation
    within estimation areas
The 2011 Hard To Count (HTC) Index
What is it?
i. Index of predicted levels of non-
response for 34,000 small areas
Used to:
i. Prioritise field resources
ii. Stratify CCS and Coverage Assessment
and Adjustment
HTC-1 (40% - Easiest)
HTC-2 (40%)
HTC-3 (10%)
HTC-4 (8%)
HTC-5 (2% - Hardest)Census response rates, 2001 and 2011
Person Response Rate
100
98
96
94
92
90
88
2001 Census 86 2011 Census
84
82
80
78
76
74
72
70
68
66
64
62
60
100 80 60 40 20 0 0 20 40 60 80 100
Number of local authoritiesCensus response rates, 2001 and 2011
Person Response Rate
100
98
96
94
92
90
88
2001 Census 86 2011 Census
84
82
80
78
76
74
72
70
68
66
64
62
60
100 80 60 40 20 0 0 20 40 60 80 100
Number of local authoritiesChannel shift from paper to online – why?
…and more of
this!
We want
less of thisChannel shift in the Census - from paper
to online
Current planning assumptions for channel split
Country Assumed Assumed Online Paper response 2011
online paper response (%)
response response 2011 (%)
2021 (%) 2021 (%)
England 75 25 17 83
Scotland 80 20 20 80
Northern Ireland 67 33 15 85International Comparisons – assumed/actual
response rate in next census
Country Year of (next) Assumed/actual Previous online
census online response response achieved
rate in next census
(%)
England 2021 75 c 17 (2011)
Scotland 2021 80 c 20 (2011)
Northern Ireland 2021 67 c 15 (2011)
New Zealand 2018 70 34 (2013)
Australia 2016 58* 33.1 (2011)
Canada 2016 68.3 54.4 (2011)
Ireland 2021 50-70 n/a
USA 2020 52.5 n/aBroader digital behaviour
• 2016 - 89% households in GB had an internet connection, up
from 86% in 2015
• 2016 – 82% adults in GB used the internet every day or
almost every day, compared to 78% in 2015 and 35% in 2006
Devices used to access %
internet, 2016 (GB)
Mobile or smartphone 71
Laptop or netbook 62
Tablet computer 52
Desktop computer 40
Smart TV 21
Other mobile device 18Digital behaviour by age
Access to internet at home by age group %
16-24 years 92
25-34 years 93
35-54 years 93
55+ years 73
Frequency of daily internet use at home %
by age group
16-24 years 87
25-34 years 87
35-54 years 82
55+ years 64Common strategies to help achieve online
targets
To help achieve the planning assumptions we need to
• design and build the online capacity to handle current planning assumptions,
as well as developing additional contingency measures for processes and
systems
• ensure online collection systems are easy to use
• steer householders towards completing an online return
• offer a wide range of support services and potentially offer telephone data
capture
• offering Assisted Digital to support the government digital by default agenda
• develop strategies to engage with poor responders, for example:
- recent migrants
- the unemployed
- those living in urban centres
- young men
- older people2021 Index plans . . . • Using evidence from 2017 Test develop a stratification(s) for 2021, that will be used to: • Prioritise field staff resource • Guide work/support with assisted digital • Guide use and timing of reminder letters • Guide use of paper questionnaires • Census Coverage Survey design • Quality assurance • Based on admin sources that can be updated
2021 index plans . . .

Objectives to inform key collection decisions

1. Maximise response

2. Minimise variation in response

3. Maximise online response

4. Efficient use of resources
Segmentation for 2017 Census Test . . .

Key learning points for 2021:
• Understanding characteristics of non-responders
• Understanding characteristics/volumes of those that want to
  comply but digitally challenged

Prototype ‘hard to count’ index for 2017
• 2 x measures:
   – Traditional ‘unwillingness’
     based on self-response rates from 2011 (day 10 returns)
   – Digital ‘inability’
     based on Ofcom data on take-up of broadband, 2014
• 3 levels of each measure (low, medium, high) - 9 ‘hard to count’
  groups
England and Wales segmentation for 2017
• Test is slightly skewed to
harder areas
Proportion of Area*
Area type 2017 Test E &W
Easier 10 22
Hard 41 49
Harder 47 30
* May not add up due to roundingEngland and Wales segmentation for 2017
(by LSOA)
Online take-up of broadband
Harder Hard Easier
Harder Hard Hard
Harder Harder Harder
Self-response in 2011Follow up- challenges and lessons • Team sizes • Follow up workloads • Resource • Allocation • Size of follow up area • Field work management tool • Recruitment – right people, right place….
Flexible follow up and channel shift
challenges – thoughts and questions?
Questions and questionnaire - 2021
         challenges and opportunities
• Meeting user need, minimising respondent burden
   • User consultation to identify user need
   • Considering some new topics/questions
   • Paper v online constraints

• Minimising and understanding modal differences

• Designing internet questionnaire – improving quality
   • Self coding
   • Number of different devices/routes to complete

• Technological developments
New question – Volunteering
• The question will collect data on frequency of voluntary activity
• This should minimise respondent burden and it more closely
meets the needs of three stakeholders: DCMS, NCVO and Sports
England. The terms ‘official’ and
‘unpaid’ have been
• Evaluated in 2017 Census Test in England and Wales dropped by request of
stakeholders
Thinking of the last 12 months, have you taken part in any We’re only measuring
volunteering for any groups, clubs or organisations? formal volunteering
We’ll be testing and this will need to
respondents ->Do not include any Court ordered activities made clear in the
understanding of guidance
the term •No
volunteering
•Yes, at least once a week
•Yes, less than once a week but at least once a month
•Yes, less often
Community Life Survey
response options will allow
us to compare our findingsNew question – Sexual
identity/orientation
• Based on the APS question
• For 16 and over
• Appears before religion and after ethnicity following cognitive testing which showed worked
better before religion
• Voluntary question assuming
similar approach as religion
question
• No ‘prefer not to say’ option
Added write-in other box following
cognitive testingRedesigned question (online) - Ethnicity
Two stage tick box
option approach
51Ethnicity question (Paper)
• Same as 2011 question
• Some considerations underway to
changing/improving question for 2021 and testing
these independently of 2017 Test
52Revised question (online) – Address one year ago
Address one year ago
       question (Paper)

• Same as 2011
  question

                            54
Questions and questionnaire – questions?
2011 Census Processing - Simplified Linear View
2021 Census Processing – Overview of Data Journeys (illustrative!!)
PU       Council Area
PU       Council Area                                                              1   Orkney, Shetland, Na h-Eileanan Siar
     A   Scottish Borders, East Lothian, South Lanarkshire
                                                                                   2   Glasgow
     B   Dumfries & Galloway, East Ayrshire, North Ayrshire, South Ayrshire
     C   Edinburgh, Midlothian                                                     3   Edinburgh, Aberdeen, Dundee
     D   North Lanarkshire, West Lothian                                           4   Inverclyde, Stirling, Renfrewshire, Fife
     E   Clackmannanshire, Falkirk, Fife                                           5   North Ayrshire, Falkirk, Perth & Kinross, North Lanarkshire
     F   Glasgow                                                                       South Lanarkshire, West Dunbartonshire, Scottish Borders,
         West Dunbartonshire, East Dunbartonshire, East Renfrewshire,              6   Highland, East Lothian
     G   Inverclyde, Renfrewshire                                                      Argyll & Bute, Angus, East Ayrshire, East Renfrewshire
     H   Angus, Dundee, Perth & Kinross, Stirling                                  7   East Dunbartonshire, West Lothian, Clackmannanshire
     I   Aberdeen, Aberdeenshire, Shetland                                             Dumfries & Galloway, South Ayrshire, Aberdeenshire
     J   Argyll & Bute, Highland, Moray, Orkney, Na h-Eileanan Siar                8   Midlothian, Moray
Outputs - Previously (for 2011
Census)
• ONS Published more than 650 tables – 8 billion cells of data
• First results out 16 months after Census day
• Still publishing tables 2 - 3 years later
• Specific required data hard to find within the expanse of
tablesFor 2021 Census… • Improve on 2011 in terms of: • Flexibility • Timeliness • Accessibility • By developing a flexible web-based dissemination system with dynamic Statistical Disclosure Control method • Targeted record swapping with ‘light touch’ cell key method • Beyond any other similar approaches internationally
Some high level requirements – as
        provided by our users so far….
• Users to be able to design their own tables.
• Key tables to be easy to find/search.
• Fuller metadata to be available through a link from all tables.
• Tutorials/Help pop ups to be available
• Home page to be visually pleasing and easy/intuitive to use
• High level data to be accessible on different types of device
  e.g. mobiles and tablets
• Application Programming Interfaces to be available giving 5-
  star data.
Mock-up – what the home page may look like
Document ID A16095736Mock-up - where you go if you click on health icon
Document ID A16095736Mock-up - where you go if you click on health icon
Document ID A16095736Mock-up of Table searcher with improved
search and metadata links
Document ID A16095736View of selected table
Document ID A16095736View of different table showing limited edit
options for pre-built tables
Document ID A16095736When you click to enter the create your own
tables you will get a message about SDC
Document ID A16095736Create your own table -selected variables
and groupings are displayed
Document ID A16095736Pressing “Get Data” shows the data with
SDC automatically added
Document ID A16095736Mock up of high level data on mobile
devices
Document ID A16095736Trade-offs
• Inconsistency when same
information is extracted in
two different ways :
namely aggregated totals
• Amount and complexity of
information requested will
be limited with front-end
‘business rules’ (e.g. no
more than 4 variables in
any request)Next steps for both of us • User engagement • Seeking views on trade-offs • Understanding priorities for development • Further development • Refining methods • Assuring security • System enhancement • Ongoing user engagement
Outputs – views and what matters to
               you?
Using administrative data - Strands of
Work
Admin Data Based Population Estimates
• Developing linkage methods to de-identify data
• Joining lots of large datasets together
Using data to plan and design/quality assure/ enhance the 2021
Census
• Hard to count index and addressing
• GP Patient register, school pupil stage and tenure
• Using the methods for matching the Census Coverage Survey to the
Census to adjust for non-response
• Census Under Enumeration Project
• Enhanced outputs e.g. incomeWhat are the benefits?
• Potential to produce population and household estimates for
much lower cost?
• Do estimates perform better between censuses?
• Can we produce estimates more quickly?
– Currently mid-year population estimates produced within nine months of 30
June.
– Household estimates follow around 11 months after.
– Heavily dependent on timeliness of data sources.Admin data estimates – are they possible?
Population Estimates – probably yes
• Age
• Sex
• Location
Household Estimates –possibly yes
• Number of occupied properties if have address information.
• Relationship structure from Council Tax/ Benefits/Tax??
Other Characteristics
• This is very hard!Limitations of Admin Data • Some information isn’t collected in admin data. • Will need a Population Coverage Survey (PCS) to check and adjust admin population estimates – e.g. 1% sample. • May also require an annual characteristics survey. Would need to be separate from PCS as a different design would be required.
In conclusion

Very similar approaches/design/challenges with harmonisation
  on outputs a key objective

Stakeholder engagement will be key to:
Understand and overcome key challenges such as providing
  assistance/moving people online etc
Assure the census designs and assumptions underpinning the
  designs
General Questions
You can also read