An example of using the OptD method to optimization of point clouds in the buildings diagnostics
←
→
Page content transcription
If your browser does not render page correctly, please read the page content below
4th Joint International Symposium on Deformation Monitoring (JISDM), 15-17 May 2019, Athens, Greece

                   An example of using the OptD method to optimization
                        of point clouds in the buildings diagnostics
                  Czesław Suchocki1, Wioleta Błaszczak-Bąk2, Marzena Damięcka-Suchocka3,
                                      Marcin Jagoda4, Andrea Masiero5

 1
    Koszalin University of Technology, Faculty of Civil Engineering Environmental and Geodetic Sciences,
 Śniadeckich 2, 75-453 Koszalin, Poland, czeslaw.suchocki@tu.koszalin.pl
 2
   University of Warmia and Mazury in Olsztyn, Institute of Geodesy, Oczapowskiego 2, 10-719 Olsztyn, Poland,
 wioleta.blaszczak@uwm.edu.pl
 3
    Koszalin University of Technology, Faculty of Civil Engineering Environmental and Geodetic Sciences,
 Śniadeckich 2, 75-453 Koszalin, Poland, marzena.damiecka@wilsig.tu.koszalin.pl
 4
    Koszalin University of Technology, Faculty of Civil Engineering Environmental and Geodetic Sciences,
 Śniadeckich 2, 75-453 Koszalin, Poland, marcin.jagoda@tu.koszalin.pl
 5
   Interdepartmental Research Center of Geomatics (CIRGEO), University of Padova, via dell’Università 16, 35020
 Legnaro (PD), Italy, masiero@dei.unipd.it

 Key words: OptD method; TLS; optimization of the dataset; defect detection

 ABSTRACT
    Terrestrial Laser Scanner (TLS) measurements can be used to assess the technical condition of buildings and
 structures: in particular, very high resolution TLS measurements should be taken in order to detect defects on
 building walls. This consequently results in the creation of a huge amount of data in a very short time. Despite
 high resolution measurements are typically needed in certain areas of interest, e.g. to detect cracks, reducing
 redundant information on regions of low interest is of fundamental importance in order to enable
 computationally efficient and effective analysis of the dataset. In this work, data reduction is made by using the
 Optimum Dataset (OptD) method, which allows to significantly reduce the amount of data while preserving the
 geometrical information of interest area. As a result, more points are kept on areas corresponding to cracks and
 cavities than on flat and homogeneous surfaces. This approach allows for a thorough analysis of the surface
 discontinuity in building walls. In this investigation, TLS dataset was acquired by means of the time-of-flight
 scanner Riegl VZ-400i. The results obtained by reducing the TLS dataset by means of OptD show that this method
 is a viable solution for data reduction in building and structure diagnostics.

                   I. INTRODUCTION                          speeds of above 1 million points per second with
                                                            millimetre accuracy. Furthermore, TLS can register the
  Terrestrial laser scanning (TLS), also called high-
                                                            radiometric information of returned laser beam signal,
definition surveying (HDS), is a simple method for high
                                                            so-called intensity. The intensity value can be used for
accuracy mapping of real objects. TLS is a non-contact
                                                            defect detection on wall surfaces, e.g. cracks, cavities
method for rapidly capturing a rich amount of details of
                                                            (Armesto-González et al., 2010), (Suchocki, Jagoda, et
the measured object. The most common applications of
                                                            al., 2018) or change humidity saturation and moisture
TLS are geodetic, structural, and civil engineering
                                                            movement in building (Suchocki, Katzer and Rapiński,
measurements, such as topographic surveys et al.,
                                                            2018)(Suchocki and Katzer, 2018a). Intensity
2013), landslide monitoring (Kasperski et al.,
                                                            information can be a useful tool to assess the technical
2010),(Suchocki, 2009), monitoring and diagnostic of
                                                            state and the need of restoration of the historical
structures and buildings (Liu, Chen and Hauser,
                                                            buildings (Li and Cheng, 2018).
2011),(Suchocki and Katzer, 2018b),(Suchocki et al.
                                                              In recent years, TLS has gained popularity in several
2008), roadway surveys (Pu et al., 2011)(Guan et al.,
                                                            applications related to cultural heritage conservation.
2014), cultural heritage documentations (Yastikli,
                                                            Typical symptoms of the poor state of conservation of
2007),(Pavlidis et al., 2007).
                                                            historical buildings are cracks, cavities and various
  Cultural heritage sites, which are spread all around
                                                            discontinuities on the building surfaces. Therefore,
the World, should be protected, monitored and
                                                            collection of high-resolution point clouds on cavities
renewed. The use of a proper remote sensing
                                                            and cracks is very important to monitor conservation
documentation technique is of fundamental
                                                            status of buildings. The ability to test the geometry of
importance in order to obtain 3D models of cultural
                                                            the building and simultaneously detect visible cracks
heritage sites with high accuracy and details, but
                                                            and cavities is very useful during the technical
reducing the risk of damages. To this aim, the TLS
                                                            inspection of a building.
technology can be conveniently carried out. Indeed, it
provides the ability to collect data with high density at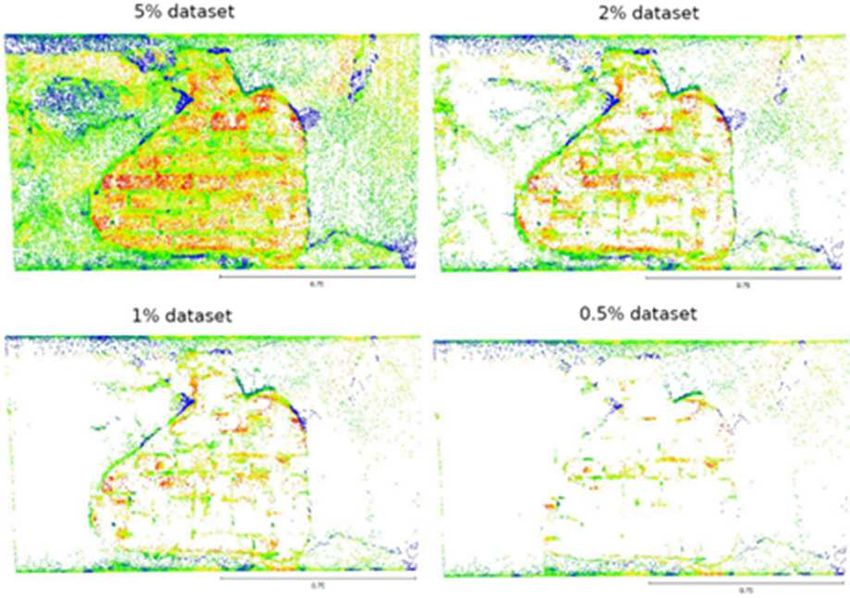
4th Joint International Symposium on Deformation Monitoring (JISDM), 15-17 May 2019, Athens, Greece

  The need of detecting also minor defects on the            criterion. If so, the reduction process is completed. If
surfaces of walls imposes the acquisition of TLS             not, suitable steps are repeated.
measurements at very high resolution. However, this            The use of OptD methods has a positive impact on the
often leads to very large datasets, which are                following aspects:
consequently difficult to efficiently process with           • Geometry visibility. Improvement of visibility and
commercial software. This motivates the usage of                  readability of the measured details. After applying
automatic optimization methods for reducing the size              OptD it is possible to better distinguish object
of the above-mentioned datasets.                                  shapes that might originally be hard to be seen due
  Typically data reduction is performed by using                  to the large amount of data (W. Błaszczak-Bąk,
a random method which in consequence causes the                   Sobieraj-Złobińska and Wieczorek, 2018);
loss of important information.                               • Processing time. Reduction of the dataset in the
  Point cloud data reduction is often achieved by                 pre-processing stage enables less labor-intensive
randomly subsampling the dataset. Despite this                    and time-consuming computations of e.g. DTM, 3D
method is clearly simple and computationally                      modeling (Błaszczak-Bąk, Sobieraj-Żłobińska and
extremely efficient, it does not consider the possible            Kowalik, 2017).
consequences of such subsampling, hence potentially            The OptD method works in such a way that it keeps
leading to the loss of important information.                more points in places where there is a large variation
Differently, this work considers the use of the Optimum      due to the examined characteristic, e.g. height,
Dataset (OptD) reduction method to reduce the                intensity. On the other hand, less points are preserved
number of points without the potential loss of useful        where the object shape is very smooth e.g. where it can
information cardinality while carefully taking into          be locally well approximated with a planar surface.
control the potential loss of useful information, e.g. the   Consequently, the application of OptD produces point
method is expected to properly reduce the number of          clouds with non-homogeneous densities: degree of
points on flat surfaces while keeping points on              data reduction is highly dependent of the local object
defect/damaged areas (cracks and cavities).                  complexity (i.e. of the information contained in such
  The OptD method was typically used to reduce a large       area of the 3D model).
dataset of LIDAR measurement for building digital              Differently from simple subsampling methods, OptD
terrain model (Błaszczak-Bąk, Sobieraj-Żłobińska and         checks the usefulness of each point in the model:
Kowalik, 2017). Instead, the OptD method has not been        a tolerance parameter is used to determine whether
used to optimise point clouds for building and structure     a point should be preserved or discarded. The OptD
diagnostics so far: this paper investigates the potential    method is rather automatic, i.e. the user only selects
of the usage of OptD method to this aim, and presents        the optimization criterion. Actually, just one criterion
the obtained results on scans of a historical building.      shall be used in the OptD-single variant (Wioleta
                                                             Błaszczak-Bąk, 2016), which is the one adopted in this
      II. THEORETICAL BACKGROUND OF OPTD METHOD              work, whereas a multiple-criteria optimisation is
  OptD method was originally proposed in (Błaszczak-         implemented in the OptD-multi case (Wioleta
Bąk, 2016 and Błaszczak-Bąk, Sobieraj-Żłobińska and          Błaszczak-Bąk et al., 2017).
Kowalik, 2017) with the aim of decreasing the size of a        Figure 1 summarizes the workflow of the OptD-single
measurement dataset while preserving most of the             method taking into account all the parameters that
information contained in such data (Bauer-                   affect the reduction results.
Marschallinger, Sabel and Wagner, 2014).
  The OptD method is different from the reduction of
height data conducted by DTM generalization (Bakuła,
2014) because it is used in the pre-processing stage,
without the need to build DTM. The OptD method starts
the processing from determination of the optimization
criterion (f). This parameter can be for example percent
of points or standard deviation. OptD method works in
two planes. In the first steps the OptD method
determine the initial width of the measuring strip (L) in
the horizontal plane . Then the selection of points for
each measuring strip begins and in each strip the
cartographic generalization method is used but this
time in vertical plane (Douglas and Peucker 1973). Very
important in this stage is right choice of tolerance
parameter (t). Each measuring strip is processed
separately. The last stage is verification, whether
obtained dataset fits the specified optimization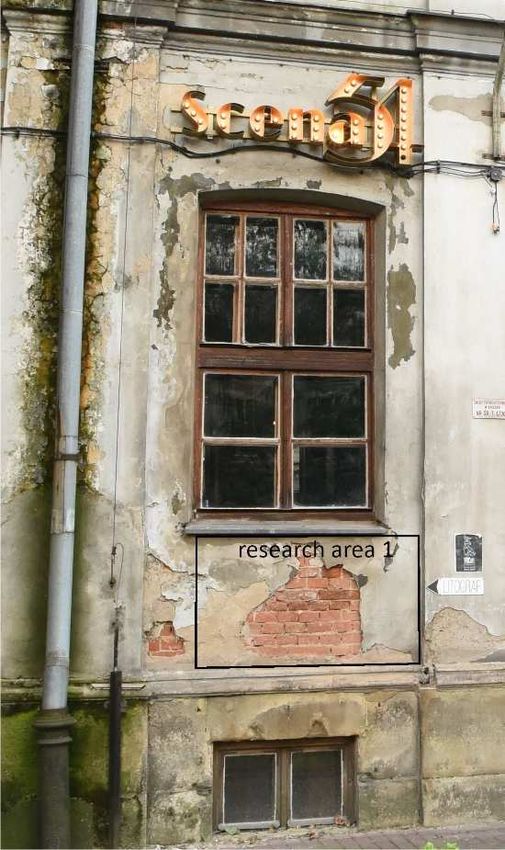
4th Joint International Symposium on Deformation Monitoring (JISDM), 15-17 May 2019, Athens, Greece

                  Figure 1. OptD workflow
                                                               Figure 2. The research object 1- wall with damaged plaster

                  III. SCOPE OF WORK
A. Object of research and used equipment
   In this work, a time-of-flight terrestrial laser scanner
Riegl VZ-400i was used. This TLS uses a narrow infrared
laser beam. Laser pulse repetition is from 100 kHz to
1200 kHz. The maximum measurement range of this TLS
is up to 800 meters for laser pulse repetition rate 100
kHz. The scanner works with a maximum measurement
rate of 500,000 pixel/sec for laser pulse repetition rate
1200 kHz. The laser beam diameter is approximately 3.5
mm and laser beam divergence is equal 0.35 mrad.
Accuracy of conformity of a measured quantity to its
actual value is approximately 5 mm.
   The object of research was the building of an old
tobacco factory in Cracow. The building is part of the
Dolne Młyny complex, which is under the supervision of
the conservator. The interior part of the building has
been restored. The outside part of the building is
characterized by poor conservation state (Figure 2). The
Dolne Młyny complex was enriched with a prestigious
club offering a rich entertainment and cultural program.       Figure 3. The research object 2- concrete element with the
The club refers to the legendary New York Studio 54                                     cracks
(West 54th Street in Manhattan). A part of wall with
damaged plaster (Figure 2) and concrete structural           B. Research and results
element with cracks (Figure 3) were used to carry out        The RiSCAN PRO software was used for the pre-
the tests. Measurements were conducted by TLS from           processing of data. The CloudCompare software was
distances of 10 m, with 1200 kHz laser pulse repetition      used to visualize and present the reduced dataset.
rate. The angle measurement resolution was set on the        Detailed characteristics of obtained datasets are
scanner at horizontally 0.01 deg. and vertically 0.01 deg.   provided in Table 1.
respectively.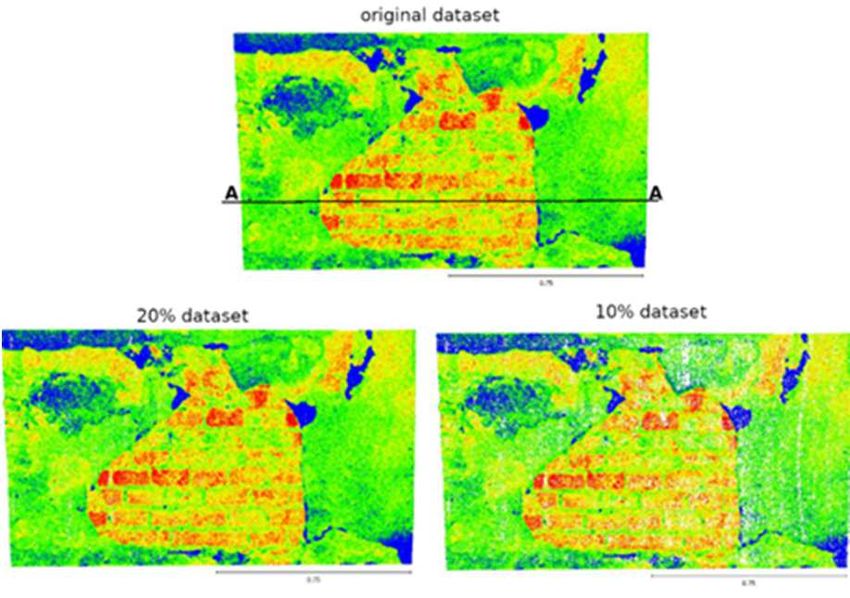
4th Joint International Symposium on Deformation Monitoring (JISDM), 15-17 May 2019, Athens, Greece
Table 1: Characteristics of tested samples
Dimensions No points/
Sample No points
[m] 0.01 m2
wall with
damaged 1.50 ∙ 0.90 2,377,449 170
plaster
concrete
element with 2.30 ∙ 0.38 762,480 90
cracks
The TLS datasets were processed by means of the OptD-
single method. The percentage of points to be kept
after the data reduction was assumed as optimization
criterion in the OptD. During the processing of the
OptD-single method, the Douglas-Peucker
generalization method was used (Douglas and Peucker,
1973). In OptD-single method six different criteria have
been adopted: 20%, 10%, 5%, 2%, 1% and 0.5%. To
meet accepted criteria the appropriate parameters
were selected.
Table 2 and Table 3 report the parameter values used
by OptD to satisfy the optimization requirements (such
values depend only on the specifically selected
optimization criterion).
Table 2: Parameters adopted by the algorithm - wall with
damaged plaster Figure 4. Results of processing based on OptD-single
p% 20% 10% 5% 2% 1% 0.5% method for test area 1
L [m] 0.001 0.001 0.001 0.001 0.001 0.001
t [m] 0.002 0.003 0.004 0.009 0.016 0.031 The main advantage of the OptD method is low data
iteration 9 14 14 13 11 10 reduction on areas corresponding to defects (cavities,
cracks, other surface discontinuities) and large data
Table 3: Parameters adopted by the algorithm - concrete
reduction on regular areas (without defects). This can
element
clearly be seen by means of visual evaluation in the
p% 20% 10% 5% 2% 1% 0.5%
L [m] 0.001 0.001 0.001 0.001 0.001 0.001
presented examples (Figure 4 and Figure 5). For
t [m] 0.002 0.003 0.005 0.013 0.022 0.036 instance, the number of points in the 2% and 1%
iteration 15 13 13 12 12 10 datasets in Figure 4 have been largely reduced on the
flat areas, while leaving enough points on the defects of
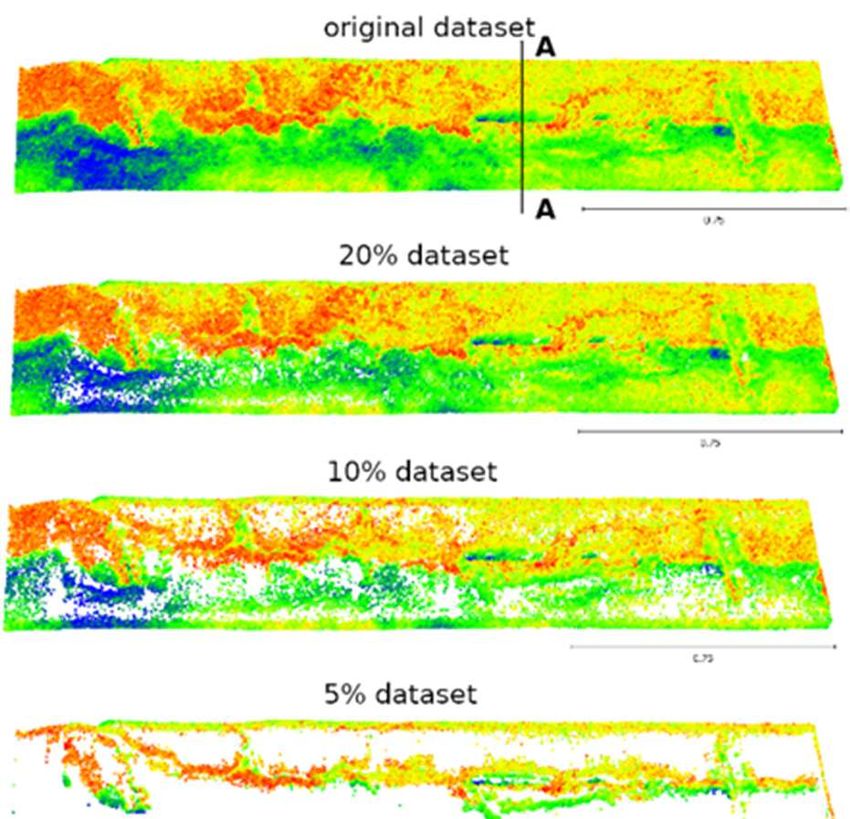
The results of the OptD-single method optimization the wall. Since the number of points kept on the
of the point clouds in the test areas 1 and 2 are damaged areas is still high, it allows to make a proper
presented in Figure 4 and Figure 5 respectively. diagnosis of the conditions of such area.
A similar observation can be repeated for 5%, 2% and
1% datasets in Figure 5.
It is also worth to be noticed that in both the cases (see
Figure 4 and 5), the 0.5% dataset does not allows
a proper diagnosis and detection of defects. This is
a direct consequence of the dramatic data reduction
imposed in such cases and of the specific behaviour of
the OptD algorithm, which always preserves
a significant amount of points on the borders of the
considered area, e.g. 0.5% dataset in Figure 5.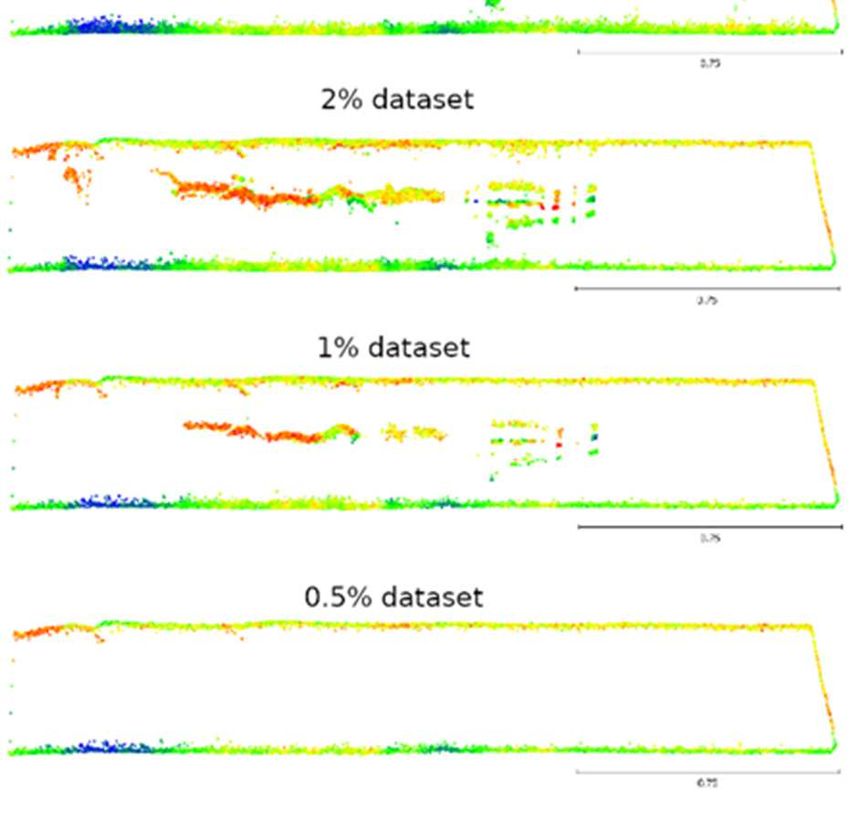
4th Joint International Symposium on Deformation Monitoring (JISDM), 15-17 May 2019, Athens, Greece

                                                                             Figure 6. Profiles for test area 1

                                                              In Figure 6 a dashed line was located in a mortar layers.
                                                              In most cases the mortar layers have been damaged. By
                                                              analyzing the individual profiles, it can be concluded
                                                              that the OptD reduction method left more points in the
                                                              above-mentioned places than on the flat surfaces.

Figure 5. Results of processing based on OptD-single method
                        for test area 2

AA profiles were made for both the cases to carefully
analyze the obtained results, which are shown in
Figure 6 and 7. The profiles show strips of 0.008 m                          Figure 7. Profiles for test area 2
width (see Figure 4 and Figure 5).
It is worth to notice that points close to sudden profile        The profiles shown in Figure 7 corresponds to
changes should be preserved by the data reduction             a defected area in the concrete element. As shown in
method to properly maintain the possibility of defect         this figure (e.g. 2% dataset), OptD method clearly kept
detection on the wall surface. Positions corresponding        a larger amount of points on areas associated to profile
to such sudden changes are marked with dashed lines           variations, which are those more informative for
in Figure 6 and 7 to ease the readability of these figures.   detecting defects.
                                                                 Since OptD keeps a larger number of points on
                                                              defected areas, it is quite clear that it allows high data
                                                              reduction while still preserving the possibility of
                                                              detecting cavities and cracks.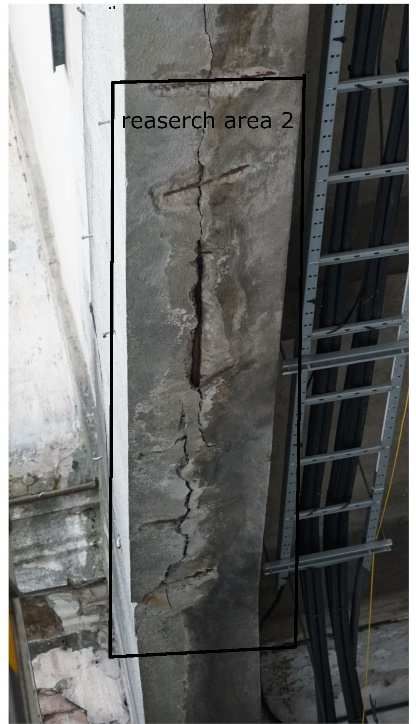
4th Joint International Symposium on Deformation Monitoring (JISDM), 15-17 May 2019, Athens, Greece

                     IV. CONCLUSIONS                              Guan, H., Li, J., Yu, Y., Wang, C., Chapman, M. and Yang, B.
                                                                    (2014). Using mobile laser scanning data for automated
   The paper presents the application of the OptD                   extraction of road markings, ISPRS Journal of
method for the optimized size reduction of point clouds             Photogrammetry and Remote Sensing, vol. 87, pp. 93–107.
in the diagnosis and monitoring of historical buildings.          Kasperski, J., Delacourt, C., Allemand, P., Potherat, P., Jaud, M.
Results reported in this paper show that, thanks to its             and Varrel, E. (2010). Application of a Terrestrial Laser
careful optimized point selection, the use of OptD                  Scanner (TLS) to the study of the Séchilienne landslide
allows to obtain a significantly smaller dataset while              (Isère, France), Remote Sensing, vol. 2, no. 12, pp. 2785–
also highlighting defects, discontinuities in the wall with         2802.
damaged plaster and in the concrete element.                      Lague, D., Brodu, N. and Leroux, J. (2013). Accurate 3D
   Based on the results obtained in the considered case             comparison of complex topography with terrestrial laser
studies, the following conclusions can be drawn:                    scanner: Application to the Rangitikei canyon (N-Z), ISPRS
• The reduced dataset obtained with OptD has                        Journal of Photogrammetry and Remote Sensing, vol. 82,
     a significantly lower point density on regular areas           pp. 10–26.
     (wall without defects) than on defects (cavities and         Li, Q. and Cheng, X. (2018). Damage detection for historical
     cracks).                                                        architectures based on tls, In The International Archives of
                                                                     the Photogrammetry, Remote Sensing and Spatial
• Obtained results show that OptD can be effectively
                                                                     Information Sciences Vol. XLII, Beijing, China, pp. 7–10.
     used for optimizing cloud points from diagnostic
                                                                  Liu, W., Chen, S. and Hauser, E. (2011). LiDAR-based bridge
     measurements buildings and other structures.
                                                                     structure defect detection, Experimental Techniques, vol.
• The results of this work indicate the possibility of               35, no. 6, pp. 27–34.
     using OptD as a tool for easing the detection of
                                                                  Pavlidis, G., Koutsoudis, A., Arnaoutoglou, F., Tsioukas, V. and
     defects in buildings and structures. Our future work           Chamzas, C. (2007). Methods for 3D digitization of Cultural
     will be dedicated to the investigation of this aspect.         Heritage, Journal of Cultural Heritage, vol. 8(1), pp. 93–98.
                                                                  Pu, S., Rutzinger, M., Vosselman, G. and Oude Elberink, S.
                 V. ACKNOWLEDGEMENTS                                (2011). Recognizing basic structures from mobile laser
  The authors would like to express their gratitude to              scanning data for road inventory studies, ISPRS Journal of
the National Science Center (PL - Narodowe Centrum                  Photogrammetry and Remote Sensing, vol. 66, no. 6, pp.
Nauki), Poland for the financial support for this study             S28–S39.
under     Project    Miniatura      1    (No:      DEC-           Suchocki, C. (2009). Application of terrestrial laser scanner in
2017/01/X/ST10/01910).                                              cliff shores monitoring, Rocznik Ochrona Srodowiska, vol.
                                                                    11, pp. 715–725.
                        References                                Suchocki, C., Damięcka, M. and Jagoda, M. (2008).
                                                                    'Determination of the building wall deviations from the
Armesto-González, J., Riveiro-Rodríguez, B., González-              vertical plane', In 7th International Conference on
  Aguilera, D. and Rivas-Brea, M. T. (2010). Terrestrial laser      Environmental Engineering, ICEE 2008 - Conference
  scanning intensity data applied to damage detection for           Proceedings (pp. 1488–1492).
  historical buildings, Journal of Archaeological Science, vol.
                                                                  Suchocki, C., Wasilewski, A. and Aksamitauskas, C. (2008).
  37, no. 12, pp. 3037–3047.
                                                                    'Application of scanning technology in cliff shores
Bakuła, K. (2014). The role of the reduction of elevation data      monitoring', In 7th International Conference on
  obtained from airborne laser scanning in the process of           Environmental Engineering, ICEE 2008 - Conference
  flood hazard map creation, PhD Thesis, Warsaw University          Proceedings (pp. 1493–1496).
  of Technology.
                                                                  Suchocki, C., Jagoda, M., Obuchovski, R., Šlikas, D. and
Bauer-Marschallinger, B., Sabel, D. and Wagner, W. (2014).          Sužiedelytė-Visockienė, J. (2018). The properties of
  Optimisation of global grids for high-resolution remote           terrestrial laser system intensity in measurements of
  sensing data, Computers and Geosciences, vol. 72, pp. 84–         technical conditions of architectural structures, Metrology
  93.                                                               and Measurement Systems, vol. 25 (2018), no 4, pp. 779–
Błaszczak-Bąk, W. (2016). New optimum dataset method in             792.
  LiDAR processing, Acta Geodynamica et Geomaterialia, vol.       Suchocki, C. and Katzer, J. (2018a). Terrestrial laser scanning
  13, no. 4, pp. 381–388.                                           harnessed for moisture detection in building materials –
Błaszczak-Bąk, W., Sobieraj-Żłobińska, A. and Kowalik, M.           Problems and limitations, Automation in Construction, vol.
  (2017). The OptD-multi method in LiDAR processing,                94, pp. 127–134.
  Measurement Science and Technology, vol. 28, no. 7, pp.         Suchocki, C. and Katzer, J. (2018b). TLS technology in brick
  7500–7509.                                                        walls inspection, (pp. 359–363), Olsztyn: IEEE.
Błaszczak-Bąk, W., Sobieraj-Złobińska, A. and Wieczorek, B.       Suchocki, C., Katzer, J. and Rapiński, J. (2018). Terrestrial Laser
  (2018). The Optimum Dataset method - Examples of the              Scanner as a Tool for Assessment of Saturation and
  application, In E3S Web of Conferences, Vol. 26, pp. 1–6.         Moisture Movement in Building Materials, Periodica
Douglas, D. H. and Peucker, T. K. (1973). Algorithms for the        Polytechnica Civil Engineering, vol. 62, no. 3, pp. 1–6.
  reduction of the number of points required to represent a       Yastikli, N. (2007). Documentation of cultural heritage using
  digitized line or its caricature, Canadian Cartographer, vol.     digital photogrammetry and laser scanning, Journal of
  10(2), pp. 112–122.                                               Cultural Heritage, vol. 8, no. 4, pp. 423–427.
You can also read