Carbon Heroes Benchmark Program - whole building embodied carbon profiling - One Click LCA
←
→
Page content transcription
If your browser does not render page correctly, please read the page content below
Carbon Heroes Benchmark Program – whole building
embodied carbon profiling

                P Pasanen1 and R Castro2
                1
                    CEO Bionova Ltd. , Helsinki, Finland
                2
                    Senior LCA Expert, Bionova Ltd., Helsinki, Finland

                Email: panu.pasanen@bionova.fi

                Abstract. Reducing the embodied carbon of the building stock requires a better understanding
                of the life cycle impacts of the materials used in those buildings. However, the characteristics of
                the building stock vary significantly by geography and building type. The “Carbon heroes
                benchmark program” is a cooperative initiative for carbon profiling by building type across
                different countries. The program's aim is to create uniform, full life-cycle of materials
                benchmarks for common building types. The benchmark program is on track to achieve 1000
                fully completed and verified buildings by end of 2019, and contains data breakdowns for over
                100 different material types and essential structural parts of a building. All data used in the
                program is rigorously anonymized and statistically small sets of data are also not used to protect
                data anonymity. The program implements the EN 15978/ISO 21930 standards as the basis of
                measurement, and includes life-cycle stages A1-A3, A4, B4-B5, and C1-C4. This presentation
                will share the preliminary findings of this project. 659 verified buildings (February 2019 cut-
                off), with substantial datasets for many European countries for some of the most common
                building types. The benchmark is generated using One Click LCA.

1. Introduction
Embodied carbon in the built environment is not well understood, and designers and project teams lack
reference points to analyze their project performance. When a subject is at the same time new, and it
does not have a clearly established reference point, it’s easy to get lost and the issue of embodied carbon
remains unaddressed.
Among the findings of the Embodied Carbon Review [1], five (5) methodologies were identified that
help deal with embodied carbon in the building sector. These methodologies are carbon reporting,
carbon comparison (in design), carbon rating, carbon caps, and decarbonization. With the exception of
the first method, all share the need to develop a benchmark or baseline to measure or compare against
to drive carbon reductions. Thus, carbon benchmarks can become instrumental for policy-making as
they serve to set actionable targets.
The present study shares the preliminary results of the Carbon Heroes Benchmark program developed
with anonymized building data. The article will describe the design of the data collection procedure, the
assumptions in the organization of data, and the challenges found to this date in the program.

2. Developing embodied carbon benchmarks for buildings
The role of embodied carbon benchmarks for buildings is recognized as an important instrument for
policy makers to help reduce the impacts of the building stock. However, a single benchmark cannot be
applied across the all buildings as the normalization of embodied carbon per unit area ignores the impact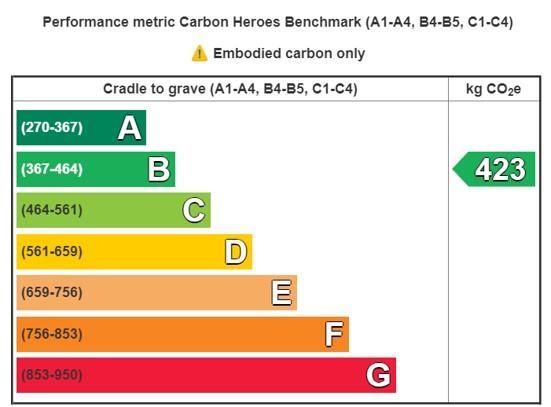
of building type on its carbon footprint [2]. Moreover, previous attempts at establishing carbon
benchmarks, several challenges have been identified in their creation. Some of these challenges include
the use of different life cycle inventory (LCI) databases, variability in the reported LCA methodologies
used and variability in the material scopes of existing studies, inconsistent meta data to properly classify
the data, and the reduced sample size to make significant statements [3,4]. Another study for multi-unit
residential buildings done in Canada also highlighted the limitations of sample size and the impact of
regionalization in the development of the benchmarks [5].
In order to address these issues, the Carbon Heroes Benchmark program is capable of leveraging the use
of a single LCA software platform, One Click LCA, to guarantee consistency in the input of data and
the calculation of its impacts.

2.1. Pre-requisites for the quality of embodied carbon benchmarks for buildings
As previous experiences have shown, ensuring consistency of embodied carbon benchmarks is all but
easy. Carbon Heroes Benchmark Program is designed to ensure high quality control and robustness of
the results. These include:

2.1.1. Consistent building information meta data. Each project includes information on building type
(refer to Table 1), LCA scope reported according to EN-15978 standard, and gross internal floor area.

2.1.2. Relevant material classification. The materials included are classified by types and sub-types.
For example, metals as a type is sub-divided into reinforcement steel, structural steel, aluminium,
copper, etc.

2.1.3. Automated material feedback. An internal algorithm checks the quantities of materials per
building element and the ratio between material sub-types to guarantee that the quantities reported are
plausible and/or fall within expected ranges. This information is provided to the users so they may
review the data introduced and make necessary corrections. For example, ratio of concrete mix to steel
reinforcement.

2.1.4. Anonymized data. All identifiable information is removed before generating the dataset for
statistical analysis. This is to ensure privacy and avoid bias in the analysis. Only the country location
of the building is reported for the development of national and regional benchmarks.

2.1.5. Expert verification and removal of incomplete datapoints. An LCA expert reviews the scope of
materials and results. Some potential sources of errors include incomplete scope for calculation,
unusual quantities by building area, or suspected values. If errors or incomplete data cannot be
resolved, the building is withdrawn from the sample.

2.2. Scope of benchmark program
The aim of this program is to create uniform, life-cycle embodied carbon benchmarks for common
building types. The benchmark program is on track to achieve 1000 anonymized, verified buildings by
end of 2019, and contains data breakdowns for over 100 different material subtypes and essential
structural parts of a building. The benchmarks are generated and updated approximately every six
months.
This program is operated in cooperation with Green Building Council Ireland, Green Building Council
Italia, Green Building Council Hungary, Dutch Green Building Council, Romanian Green Building
Council and Norwegian government real estate organization Statsbygg. Also, Chile Green Building
Council has joined the program, but no verified datapoints from Chile are available. The synthetized
results of the program are made available to the participating partners and software users.
The benchmark is developed by building type through a standardized life cycle model. Results are
regionalized and communicated in a clear way to the non-expert public.
2.2.1. Building typologies. Currently, the program is collecting data for 18 building types. These
typologies are listed in Table 1.
Table 1. Building typologies in Carbon Heroes Benchmark program
Building group Building Type
Residential Apartment buildings
Attached or row houses
One-dwelling buildings
Social welfare buildings
Educational / Institutional Cultural buildings
Day care centres for children
Educational buildings
Historic or protected monuments
Hospitals and healthcare centers
Schools (primary education)
Sports halls
Commercial Hotels and similar buildings
Industrial production buildings
Office buildings
Retail and wholesale buildings
Transport buildings
Warehouses
Other buildings
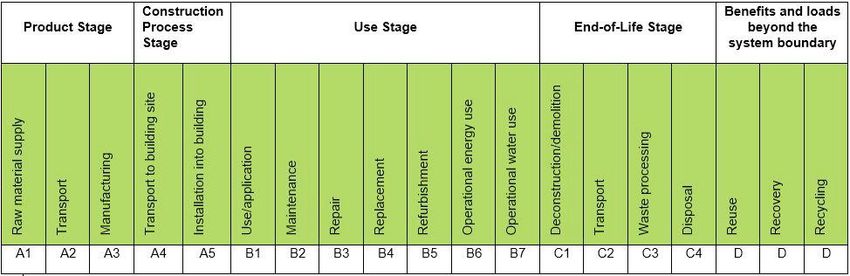
2.2.2. Standardised life cycle model. The scope of the analysis follows the EN-15978 / ISO-21930
standard as the basis of measurement. The system boundary and essential methodology of the
benchmark calculations is standardized. All calculations included in the program are uniform and cover
life-cycle stages A1-A3, A4, B4-B5, and C1-C4; it excludes the module D. In other words, this covers
the impacts from material production, the replacement and/or refurbishment due to the end of the
material service life, and the end of life stage. Figure 1 includes the information modules described in
the EN-15978 standard.
Participants in the program pursue specific requirements in green building certifications such as
BREEAM [6] and LEED [7], that require a whole building life cycle assessment to measure the
environmental impacts of the materials used to build and operate the building. As a requirement of these
certifications, the period of study is 60 years. Also, the certifications require the report of embodied
carbon as Global Warming Potential (GWP) 100 years in Kg CO2-eq. Other environmental categories
differ between the certifications. As a consequence, this benchmark was developed with GWP as a
common denominator and easy to understand indicator associated with climate change.
Moreover, the benefits of biogenic carbon are not included in the benchmark. This is a result of the
uncertainty associated with the disposal method or end of life scenario. For example, the incineration of
vegetated products releases the stored carbon back to the atmosphere and results in a zero sum for the
purposes of the analysis. Consequently, the assumed carbon storage benefits reported in module A1 are
added back in module C. Nevertheless, biogenic carbon is calculated and reported as a separate indicator
in One Click LCA.Figure 1. Life cycle stages according to EN-15978
2.2.3. Regionalized samples. The sample is classified by countries at the moment with the aim at
grouping buildings with similar construction techniques. Table 2 shows the breakdown of countries for
the sample of European projects. Additional data is available for North America, Middle East, and
Asia.
Table 2. Countries by region, Europe
Region Countries
Northern Europe Denmark, Finland, Iceland, Norway, Sweden
Eastern Europe Croatia, Czech Rep., Estonia, Hungary, Latvia,
Lithuania, Poland, Romania, Serbia, Slovak Rep.,
Slovenia, Ukraine
Southern Europe Italy, Portugal, Spain
Western Europe Austria, Belgium, France, Germany,
Luxembourg, Netherlands, Switzerland
British Isles Ireland, United Kingdom
2.2.4. Facilitate the consistent input of building data. The collection of building information for the
development of these benchmarks are the result of material quantity inputs made by users of One Click
LCA. To assist the users in the correct input of information, the software includes two tools: Model
Checker and LCA Checker. The Model Checker reviews the quality of the geometric information found
in the Building Information Models (BIM) during the import process into One Click LCA. And, LCA
Checker reviews that the material quantities are plausible using a set of proprietary algorithms and
automated verifications.
2.2.5. Sample size. Currently, there are 659 buildings included in the program. The aim of the Carbon
Heroes Benchmark Program is to reach 1000 buildings by the end of 2019, at which point the analysis
is repeated. The results included in section 3 show the preliminary findings of this study for a limited
number of building types: multi-family apartment, office, and warehouse/industrial. Also, this analysis
will include only buildings in Eastern Europe Another review/update is expected at the end of 2019 and
it will determine which building types will be reported based on their statistical significance.
2.3. Communicating results
Results are reported in two graphical forms that are easy to read. First, in a Boxplot with whiskers
showing the median and range, including outliers. And, second as a performance metric as shown in
Figure 2. The performance metric includes the range of results at two standard deviations of the mean
for the building type. The range is divided into 7 (seven) bands equally distributed. The mean of theresults falls within band “D” and the lower and upper extremes of the range are in bands “A” and “G”
respectively.
Figure 2. Performance metric Carbon Heroes Benchmark, example
3. Results & Discussion
For this article, three building types for Eastern Europe are presented here as an example of our data
analysis process. In Table A1, the descriptive statistics for the sample of office buildings is included.
The high values of Kurtosis and Skewness show the possibility that this dataset is not normally
distributed. The histogram for the same dataset presented in Figure 3, seems to corroborate this
assumption. The data shows positive skewness and a long tail to the left.
Histogram of Embodied Carbon, Office building
25
20
Frequency
15
10
5
0
0 400 800 1200 1600 2000
Embodied carbon, Kg CO2-eq / m2
Figure 3. Histogram of office building, Eastern Europe
As a consequence, a 1-sample sign non-parametric test was applied to check if the median is a better
test of central tendency for this dataset. The results of the test are included in Table 4, with similar test
results for two other building types: “apartment buildings” and “warehouse/industrial facilities”.Overall, the median shows to be on target in its central tendency, and the resulting range (lower and
upper values) captures with 95% confidence the values of the dataset.
Table 4. Median embodied carbon results per building type
Building type Median embodied carbon, Confidence Interval,
Kg-CO2-eq/m2 95%
Apartment buildings 444 285, 886
Office 531 410, 591
Industrial & warehouses 609 357, 1115
Alternatively, additional building information can shed insights into the skewness of the distribution.
This will be tested as the sample grows. Meanwhile, using the histogram of the office building subset,
the outliers to the left were extracted from the sample, and a set of descriptive statistics were calculated.
With a reduced sample (n=70), the mean and median were closer to each other, and the results are more
normally distributed (M=538; SD=238) and range (63,1013) p=0.05. Figure 4 shows boxplot of the
sample. Table A2 shows the descriptive statistics of this sub-sample.
Figure 4. Boxplot of mean/median embodied carbon, Eastern Europe
In addition, global warming potential (GWP) is reported by information module as a percentage of
overall embodied carbon (Kg CO2-e) in Figure 5. It is not surprising that the largest share of GWP takes
place during the construction phase. However, a study we conducted about modelling the impact of
retrofit on accumulated impacts has shown that the impacts of module B4-B5 might be underrepresented
[8]. At the moment, the results in B4-B5 represent changes in materials due to the technical service life
of materials and do not consider changes in building renovations or retrofit scenarios. This can lead to
a review of the scope of the analysis for module B.C1-C4
B4-B5 2%
20%
A1-A3
78%
Figure 5. Distribution of %GWP, office buildings, Eastern Europe
Closing remarks
Finally, it is expected that as the sample grows the dataset will tend towards a normal distribution. This
will facilitate its use in the performance metric shown in Figure 2. However, it is also possible that
underlying effects are responsible for the spread in the dataset. This will be subject of future analysis
and could lead to explain what other factors are correlated with the embodied carbon in buildings, and
help improve its representation in the Carbon Heroes Benchmark.
References
[1] Bionova (2018) Embodied Carbon Review [Online]. Accessed on 31 May 2019:
https://www.oneclicklca.com/embodied-carbon-review/
[2] Hammond, Geoffrey & Jones, Craig. (2009). Embodied Carbon: The Concealed Impact of
Residential Construction. 10.1007/978-1-4419-1017-2_23.
[3] Simonen, K., Rodriguez, B., Barrera, S., Huang, M., McDade, E,. Strain, L. (2017)
Embodied Carbon Benchmark Study: LCA for Low Carbon Construction. Available at
http://hdl.handle.net/1773/38017.
[4] Simonen, S., Rodriguez, B., De Wolf, C. (2017) Benchmarking the Embodied Carbon of
Buildings, Technology|Architecture + Design, 1:2, 208-218
[5] Bowick, M. and O'Connor,J.(2017) Carbon Footprint Benchmarking of BC Multi-Unit
Residential Buildings.
[6] BREEAM Technical Standards. Accessed on 31 May 2019:
https://www.breeam.com/discover/technical-standards/
[7] LEED Building life-cycle impact reduction credit. Accessed on 31 May 2019:
https://www.usgbc.org/node/2614363?return=/credits/new-construction/v4/material-
%26amp%3B-resources
[8] Castro, R. and Pasanen, P. (2018) How to design buildings with Life Cycle Assessment by
accounting for the material flows in refurbishment. Conference proceeding. SBE19 Brussels -
BAMB-CIRCPATH "Buildings as Material Banks - A Pathway For A Circular Future" 5–7
February 2019, Brussels, Belgium.Acknowledgments We wish to acknowledge the assistance of our colleagues at Bionova, Artur Alsins (Software), Tytti Bruce-Hyrkäs (Customer Success), and Veselin Vihaylov (Data) and their teams in the continuous collection and revision of the sample data. Appendix Table A1. Descriptive statistics, office buildings Eastern Europe (Kg CO2-e/m2) Mean 630 Standard Error 48 Median 550 Mode #N/A Standard Deviation 417 Sample Variance 173,702 Kurtosis 4 Skewness 2 Range 2,010 Minimum 97 Maximum 2,107 Sum 47,214 Count 75 Confidence Level (95.0%) 96 Table A2. Descriptive statistics, sub-sample office buildings Eastern Europe (Kg CO2-e/m2) Mean 538 Standard Error 28 Median 531 Mode #N/A Standard Deviation 237 Sample Variance 56,402 Kurtosis 0 Skewness 1 Range 1,136 Minimum 97 Maximum 1,232 Sum 37,641 Count 70 Confidence Level (95.0%) 57
You can also read