EDUCATION REFORMS FOR SYSTEM-LEVEL CHANGE: EVIDENCE FROM MULTIPLE INDIAN STATES - ABHIJEET SINGH - RESEP
←
→
Page content transcription
If your browser does not render page correctly, please read the page content below
Education reforms for system-level change:
  Evidence from multiple Indian states

                  Abhijeet Singh

            Stockholm School of Economics

       RESEP Conference, Stellenbosch University
                6th September 2018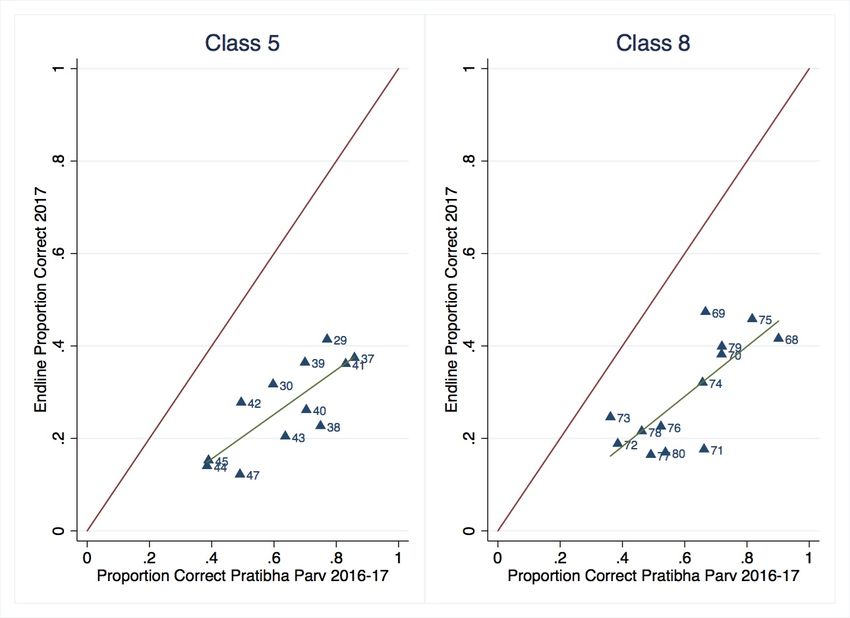
Introduction
The Indian context

       I   Learning levels in India are low and stagnant (or potentially
           decreasing)
             I   Despite a tripling of government spending
             I   Unlikely to improve in business-as-usual (Muralidharan 2013).
             I   Little evidence that raising inputs is effective
             I   Interventions focused on improving governance and pedagogy
                 are much more promising (Glewwe & Muralidharan 2015).
       I   Inequality in test scores among the highest in the world
             I   in TIMSS, second only to South Africa (Das and Zajonc, 2010)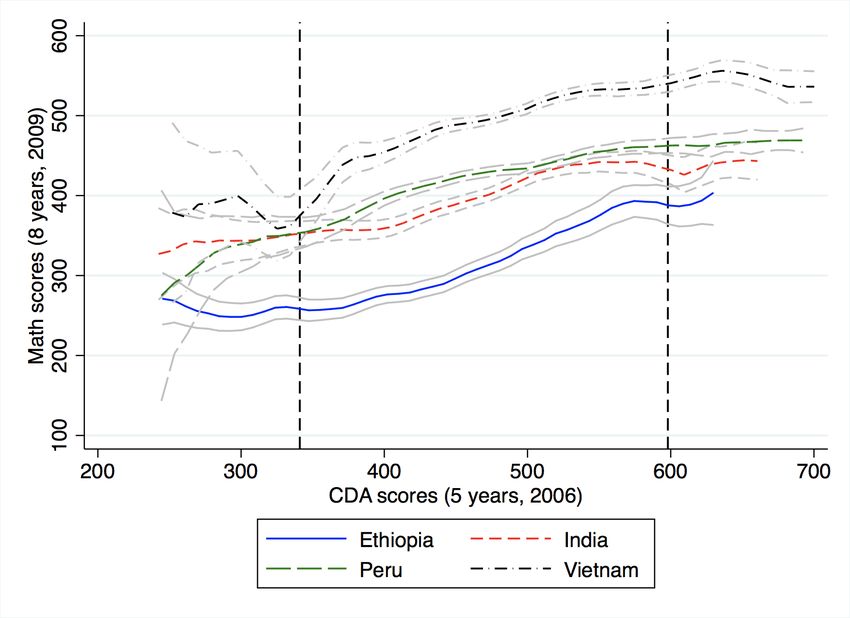
       I   States are responsible for much of frontline education delivery
             I   States can differ a lot, both in business-as-usual and
                 interventions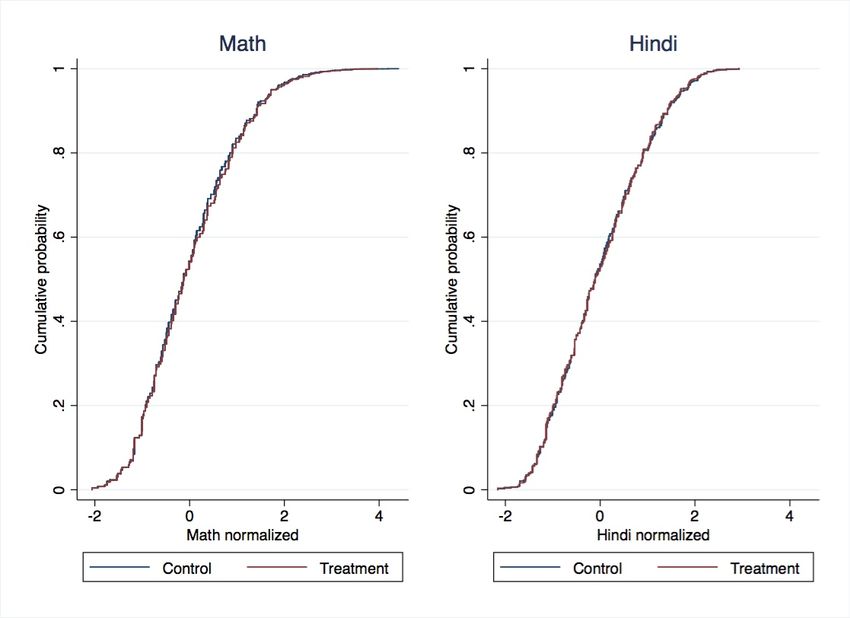
       I   This presentation is largely about our attempt to evaluate
           policy reforms in multiple states
             I   all reforms in the state sector, intended eventually for scale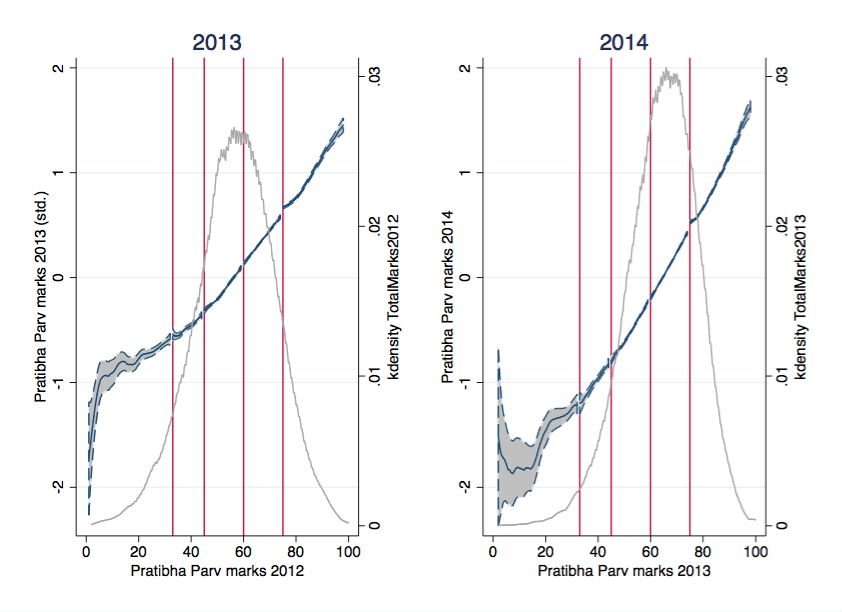
Agenda

  Introduction

  Comparing system-level productivity
     Comparing India and Vietnam

  Evaluating policy reforms
     Test based accountability at scale
     Comprehensive School Evaluations
     Technology to “Teach at the Right Level”

  Summary
A tale of two education systems
Contrasting India and Vietnam
I India and Vietnam look similar in many respects
I both middle income countries (~6000-6500 PPP$)
I both have grown fast in the past 15 years
I both have seen sharp rise in the average years of education
I both have seen an increasing share of recent cohorts entering
higher education (Sanchez and Singh, 2018)A tale of two education systems
Contrasting India and Vietnam
I India and Vietnam look similar in many respects
I both middle income countries (~6000-6500 PPP$)
I both have grown fast in the past 15 years
I both have seen sharp rise in the average years of education
I both have seen an increasing share of recent cohorts entering
higher education (Sanchez and Singh, 2018)
I Yet, they differ in a very important dimension – the levels of
learning
I in PISA, Vietnam is the highest performing developing country
at roughly the level of UK and Germany (both in 2012 and
2015)
I India, only entered once for two states, and had the
second-worst results in the world (after Kyrgyztan!)How early do these gaps start?
Learning Differences at 5 and 8
Ethiopia India Peru Vietnam
5 years old (2006) Mean 412.8 466.7 494.0 500.0
SD 112.2 100.0 105.0 100.0
N 1826 1796 1796 1822
8 years old (2009) Mean 294.4 397.7 427.1 500.0
SD 119.4 104.8 80.5 100.0
N 1826 1796 1796 1822
Scores are IRT test scores generated within an age sample, pooling data from
all countries, and normalized to have a mean of 500 and an SD of 100 in the
Vietnamese sample. Scores are comparable across countries but not across age
groups.How early do these gaps start?
Learning Differences at 5 and 8
Source: Singh (2018)Does this reflect the productivity of schooling?
(1) (2) (3) (4) (5) (6)
Dep var: Proportion correct on:
VARIABLES Number recognition Addition Subtraction Applied problems Multiplication Division
Enrolled grade in 2009 0.094*** 0.12*** 0.12*** 0.15*** 0.21*** 0.20***
(0.035) (0.020) (0.012) (0.016) (0.038) (0.033)
Grade x Ethiopia 0.059 -0.050** -0.081*** -0.060*** -0.21*** -0.20***
(0.037) (0.023) (0.014) (0.018) (0.038) (0.033)
Grade x India -0.034 -0.019 -0.047*** -0.081*** -0.15*** -0.15***
(0.036) (0.020) (0.013) (0.018) (0.039) (0.034)
Grade x Peru -0.0062 0.025 -0.013 -0.0075 -0.11** -0.11***
(0.036) (0.024) (0.016) (0.019) (0.044) (0.038)
Age in months -0.00083 0.0011 0.0021*** 0.0036*** 0.0056*** 0.0047***
(0.0012) (0.00093) (0.00062) (0.00092) (0.0013) (0.0011)
Test score (2006) 0.00020*** 0.00033*** 0.00031*** 0.00036*** 0.00020*** 0.00016***
(0.000028) (0.000038) (0.000032) (0.000042) (0.000032) (0.000029)
Constant 0.50*** -0.16* -0.33*** -0.38*** -0.78*** -0.67***
(0.10) (0.090) (0.068) (0.090) (0.13) (0.11)
Observations 7,130 7,130 7,130 7,130 7,130 7,130
R-squared 0.201 0.236 0.205 0.201 0.144 0.137
Country-specific mean of the dependent variable
Ethiopia 0.58 0.20 0.11 0.37 0.01 0.01
India 0.89 0.45 0.27 0.56 0.12 0.09
Peru 0.93 0.67 0.37 0.54 0.09 0.07
Vietnam 0.96 0.73 0.65 0.71 0.37 0.36The challenge for the Indian education system
I The challenge for the Indian education system is of improving
learning quality
I Low level that has been stagnant for over 10 years
I Over 50% of Grade 5 students can’t read at Grade 2 level!
I If we could improve the per-year productivity of the Indian
system to Vietnamese levels, we would close 90% of the gap
with Vietnam at 8
I this is despite keeping initial levels of achievement unchanged!
I Change of this magnitude is hard, and especially so at scale
I but various state governments are trying
I The rest of this presentation is about our attempts to evaluate
various policy reformsAgenda
Introduction
Comparing system-level productivity
Comparing India and Vietnam
Evaluating policy reforms
Test based accountability at scale
Comprehensive School Evaluations
Technology to “Teach at the Right Level”
SummaryWhy evidence on schooling reforms is necessary
I Existing reforms may be ineffective
I but governments will continue to spend money/time on them
because they believe the reforms work.Why evidence on schooling reforms is necessary
I Existing reforms may be ineffective
I but governments will continue to spend money/time on them
because they believe the reforms work.
I Reforms may be partly effective
I but there is no feedback to improve them.Why evidence on schooling reforms is necessary
I Existing reforms may be ineffective
I but governments will continue to spend money/time on them
because they believe the reforms work.
I Reforms may be partly effective
I but there is no feedback to improve them.
I Reforms may be effective but
I they end (due to political opposition or turnover)
I or not replicated in other settings (due to lack of awareness).Why evidence on schooling reforms is necessary
I Existing reforms may be ineffective
I but governments will continue to spend money/time on them
because they believe the reforms work.
I Reforms may be partly effective
I but there is no feedback to improve them.
I Reforms may be effective but
I they end (due to political opposition or turnover)
I or not replicated in other settings (due to lack of awareness).
I This presentation will focus on results from different projects
I goal not to push for specific interventions
I more for an illustration of what some states in India are trying
and how evaluations can feed into thisPublic Sector Reforms at Scale
I The first two reforms were studied in Madhya Pradesh state
and focus on governance and accountability
I fifth largest state in India by population
I 72.6 million people in 2011, 72% rural
I More deprived than the all-India averagePublic Sector Reforms at Scale
I The first two reforms were studied in Madhya Pradesh state
and focus on governance and accountability
I fifth largest state in India by population
I 72.6 million people in 2011, 72% rural
I More deprived than the all-India average
I The public education system illustrates national problems, with
greater severity:
I Learning levels are low (e.g. 31% of Grade 5 students can read
a Grade 2 text)
I Teacher absence is high, possibly getting worse (26% in 2010,
8 pp worse than 2003)
I Student attendance is low, and getting worse (68% in 2010,
55% in 2016)
I Schools are small, and getting smaller (18% of schools with
less than 60 students in 2010, 40% in 2016)Districts in the evaluations
Reform 1: Test-based accountability at scale
     I   The Govt of MP instituted annual standardized state
         assessments administered to all students in Grades 1–8 from
         2011
     I   Objectives (as per official circulars):
Reform 1: Test-based accountability at scale
I The Govt of MP instituted annual standardized state
assessments administered to all students in Grades 1–8 from
2011
I Objectives (as per official circulars):
1. Diagnosis: Understanding the true situation of quality of
education and tracking progress at regular intervals
2. Signalling: To demonstrate the commitment and priority
of the government towards children’s educational achievements
and to sensitize society
3. Action: To set up programs and strategies to improve the
academic achievements of the children of the state
4. Remediation: To take therapeutic / diagnostic steps for the
children not able to achieve the required skills
5. Sensitization: To educate teachers, education
administration, public representatives and society towards
the educational achievements of children
6. Levers: To know the correct position of the school operations
and facilities and make necessary corrections.The Pratibha Parv assessments
Content and administration
I Content: Grade-appropriate test questions closely linked to
the state curricula
I in lower grades, mix of individual-oral questions and written
I in higher grades, exclusively written
I mix of MCQs and open-ended responses
I most questions focused on knowledge and recall of factsThe Pratibha Parv assessments
Content and administration
I Content: Grade-appropriate test questions closely linked to
the state curricula
I in lower grades, mix of individual-oral questions and written
I in higher grades, exclusively written
I mix of MCQs and open-ended responses
I most questions focused on knowledge and recall of facts
I Administration:
I standardized test paper designed at state HQ, sent to schools
I tests in school over two days, graded by teachers
I aggregated scores available digitally, student-wise scores on
paper in schools
I several anti-cheating measures developed over time
I “flying squads” of external inspectors
I for Grades 5 and 8, test papers sent to another school for
grading
I multiple sets of question papers to avoid copying by students
I one day of extra-curricular activities, communicating with
parents/officialsThe Pratibha Parv assessments
Letter grade thresholds
I A key objective of the assessments is to enable
therapeutic/diagnostic steps that improve the status of
learning
I a focus on both diagnosing who is below-par and on
directing effort and attention to themThe Pratibha Parv assessments
Letter grade thresholds
I A key objective of the assessments is to enable
therapeutic/diagnostic steps that improve the status of
learning
I a focus on both diagnosing who is below-par and on
directing effort and attention to them
I The diagnosis classifies student/school scores into discrete
letter-grades
I A Grade: 76 and above
I B Grade: 61-75
I C Grade: 46-60
I D Grade: 34-45
I E Grade: 0-33The Pratibha Parv assessments
Letter grade thresholds
I A key objective of the assessments is to enable
therapeutic/diagnostic steps that improve the status of
learning
I a focus on both diagnosing who is below-par and on
directing effort and attention to them
I The diagnosis classifies student/school scores into discrete
letter-grades
I A Grade: 76 and above
I B Grade: 61-75
I C Grade: 46-60
I D Grade: 34-45
I E Grade: 0-33
I These grades are applied both to schools and to students
I for students, D & E is supposed to target remedial instruction
I for schools, D & E is supposed to target extra focus on school
improvement (e.g. Shaala Siddhi)Important unknowns
I How reliable are data from such assessments?
I Test score manipulation documented in OECD settings (Jacob
and Levitt 2003, Angrist and Battistin 2017, Borcan et al.
2017)
I Governance and monitoring plausibly weaker in LMICsImportant unknowns
I How reliable are data from such assessments?
I Test score manipulation documented in OECD settings (Jacob
and Levitt 2003, Angrist and Battistin 2017, Borcan et al.
2017)
I Governance and monitoring plausibly weaker in LMICs
I How effective are current uses of this data?
I for formative assessments?
I for instituting accountability mechanisms?
I for measuring progress over time?Important unknowns
I How reliable are data from such assessments?
I Test score manipulation documented in OECD settings (Jacob
and Levitt 2003, Angrist and Battistin 2017, Borcan et al.
2017)
I Governance and monitoring plausibly weaker in LMICs
I How effective are current uses of this data?
I for formative assessments?
I for instituting accountability mechanisms?
I for measuring progress over time?
I What can these data be used for?
I No test is perfect, but many can be useful
I Even with weaknesses in reliability and administration, it might
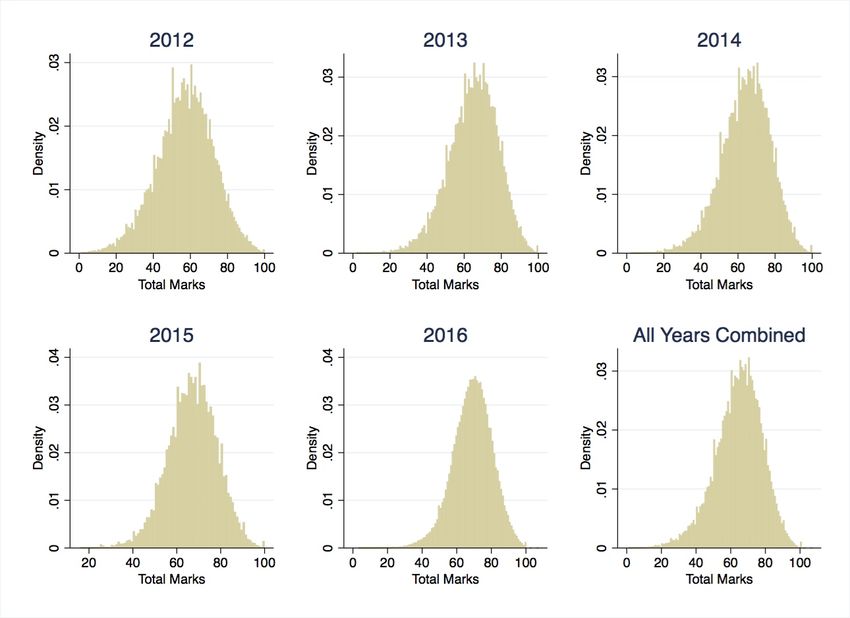
be possible to use these assessments effectivelyPratibha Parv marks are mostly well-distributed Although getting tighter, more skewed over time
The level of student achievement is overstated in PP
PP 2016 vs. independent assessment in Feb 2017 (Math)

        Note: Each dot shows the proportion of students correctly answering an
     identical question in PP (Dec 2016) and independent assessment (Feb 2017).
No evidence that letter-grades matter for future scores Note: Lines are local linear smoothed lines plotted separately within each letter grade. We see no evidence of a break at any of the thresholds.
Reform 2: Comprehensive School Evaluations
The MP School Quality Assessment intervention (Muralidharan and Singh, 2018)
       I   The program (MPSQA, Shaala Gunwatta) is modelled after
           global “best practices” in school accountability
             I   Based on strong political and bureaucratic support within the
                 state
             I   With substantial technical inputs from Ark, funded by DFID
             I   Modelled on the UK system for school inspections and
                 accountability (Ofsted) with substantial adaptation to context
                 over 2 years
Reform 2: Comprehensive School Evaluations
The MP School Quality Assessment intervention (Muralidharan and Singh, 2018)
I The program (MPSQA, Shaala Gunwatta) is modelled after
global “best practices” in school accountability
I Based on strong political and bureaucratic support within the
state
I With substantial technical inputs from Ark, funded by DFID
I Modelled on the UK system for school inspections and
accountability (Ofsted) with substantial adaptation to context
over 2 years
I The goal is to substantially improve school management
I Draws on prevailing understanding that in management theory
(Gibbons and Henderson, 2011) that low-performing
organizations may stay unproductive because they may not:Reform 2: Comprehensive School Evaluations
The MP School Quality Assessment intervention (Muralidharan and Singh, 2018)
I The program (MPSQA, Shaala Gunwatta) is modelled after
global “best practices” in school accountability
I Based on strong political and bureaucratic support within the
state
I With substantial technical inputs from Ark, funded by DFID
I Modelled on the UK system for school inspections and
accountability (Ofsted) with substantial adaptation to context
over 2 years
I The goal is to substantially improve school management
I Draws on prevailing understanding that in management theory
(Gibbons and Henderson, 2011) that low-performing
organizations may stay unproductive because they may not:
I (a) Know they are performing poorly
I (b) Know what they need to do to improve
I (c) Be motivated or held accountable for improvements
I (d) Or they are affected by external factors beyond their
control
I The program tries to address each of these constraints.Program Components
StandardsProgram Components
Define standards that
Standards
schools should focus onProgram Components
Define standards that
Standards
schools should focus on
Assess-
mentProgram Components
Define standards that
Standards
schools should focus on
Assess- Comprehensive assessments by
ment internal and external assessorsProgram Components
Define standards that
Standards
schools should focus on
Assess- Comprehensive assessments by
ment internal and external assessors
PlanningProgram Components
Define standards that
Standards
schools should focus on
Assess- Comprehensive assessments by
ment internal and external assessors
School Improvement Plans
Planning
with concrete actionsProgram Components
Define standards that
Standards
schools should focus on
Assess- Comprehensive assessments by
ment internal and external assessors
School Improvement Plans
Planning
with concrete actions
Follow-upProgram Components
Define standards that
Standards
schools should focus on
Assess- Comprehensive assessments by
ment internal and external assessors
School Improvement Plans
Planning
with concrete actions
Continuous follow-up
Follow-up Provide monitoring and support
Leverage ICT toolsProgram Components
Define standards that
Standards
schools should focus on
Assess- Comprehensive assessments by
ment internal and external assessors
School Improvement Plans
Planning
with concrete actions
Continuous follow-up
Follow-up Provide monitoring and support
Leverage ICT toolsThis is very similar to a (since introduced) national policy With a target of reaching 1.6 million schools!
Experimental design

    I   Intervention scale:
          I   2014-16: ~2000 schools in 5 districts, randomly assigned
Experimental design
I Intervention scale:
I 2014-16: ~2000 schools in 5 districts, randomly assigned
I Randomization: Program assigned at academic cluster
level (JSK, ~40 schools on average)
I Program assignment at JSK level to avoid spillovers
I Implemented in 153 JSKs; 51 to treatment, rest to control
I All schools in the treatment JSK covered by the intervention
I 1890 schools in treatment (1774 elementary, 116 secondary)
I 3994 schools in control (3661 elementary, 273 control)Experimental design
I Intervention scale:
I 2014-16: ~2000 schools in 5 districts, randomly assigned
I Randomization: Program assigned at academic cluster
level (JSK, ~40 schools on average)
I Program assignment at JSK level to avoid spillovers
I Implemented in 153 JSKs; 51 to treatment, rest to control
I All schools in the treatment JSK covered by the intervention
I 1890 schools in treatment (1774 elementary, 116 secondary)
I 3994 schools in control (3661 elementary, 273 control)
I Evaluation at scale: intervention schools are a representative
subset of the population of ~12k schools in these districtsResults
Four main results:
1. Near-universal implementation of the assessments
I ~93% of elementary schools, 89% of secondary schools in
treatment group were covered by the assessments and had
SIPs preparedResults
Four main results:
1. Near-universal implementation of the assessments
I ~93% of elementary schools, 89% of secondary schools in
treatment group were covered by the assessments and had
SIPs prepared
2. The assessments were meaningful
I Contain meaningful variation across schools
I Most schools rated inadequate
I Predicts future value-added and future teacher absenceResults
Four main results:
1. Near-universal implementation of the assessments
I ~93% of elementary schools, 89% of secondary schools in
treatment group were covered by the assessments and had
SIPs prepared
2. The assessments were meaningful
I Contain meaningful variation across schools
I Most schools rated inadequate
I Predicts future value-added and future teacher absence
3. Yet, there was no change in the functioning of schools
I No increased monitoring and accountability
I No change in classroom practiceResults
Four main results:
1. Near-universal implementation of the assessments
I ~93% of elementary schools, 89% of secondary schools in
treatment group were covered by the assessments and had
SIPs prepared
2. The assessments were meaningful
I Contain meaningful variation across schools
I Most schools rated inadequate
I Predicts future value-added and future teacher absence
3. Yet, there was no change in the functioning of schools
I No increased monitoring and accountability
I No change in classroom practice
4. Also, no change in test scores
I At 2, 14, 18 months!
I Across administrative tests or our ownNo effect on test scores
Student-level test scores
Note: Results on individual test scores in sample elementary
schools from independent test data collectionPolicy Implications
I Our results are relevant for informing the design of school
governance programs in LMICs more generallyPolicy Implications
I Our results are relevant for informing the design of school
governance programs in LMICs more generally
I Similar program now mandated nationally, also of interest in
other developing countries
I Just this “pilot” exercise represents min. 27,000 man-days of
work (13.5 man-days per school)
I Only including days for assessment, SIP preparation by
assessors and school staff alone
I Universalizing just in MP implies 55x multiplication in time
spent (~1.5 mn man-days)
I Excludes all logistical costs, opportunity costs for senior
management, crowding out of other reformsReform 3: Personalized computer-aided instruction
Using technology to “Teach at the Right Level”
I One option that excites policy-makers is education technologyReform 3: Personalized computer-aided instruction
Using technology to “Teach at the Right Level”
I One option that excites policy-makers is education technology
I In 2015, we evaluated a blended learning program (Mindspark)
I Developed by a leading Indian education firm over a decade
I Over 45,000 question Item Bank, used by over 400,000
students, administering over a million questions daily
I Individual, dynamically updated, assessment and content
I Instruction is targeted at children’s actual level of
achievement, not the curriculum-mandated levelReform 3: Personalized computer-aided instruction
Using technology to “Teach at the Right Level”
I One option that excites policy-makers is education technology
I In 2015, we evaluated a blended learning program (Mindspark)
I Developed by a leading Indian education firm over a decade
I Over 45,000 question Item Bank, used by over 400,000
students, administering over a million questions daily
I Individual, dynamically updated, assessment and content
I Instruction is targeted at children’s actual level of
achievement, not the curriculum-mandated level
I We evaluate the after-school model (Mindspark centers),
which provide supplementary after-school instruction to
students six days/week
I 45 mins individual study using CAL software (Mindspark); 45
mins small group teaching (12-15 students)
I 619 students, individual level randomization, 4.5 months
treatment, treated students received a complete fee waiver
I all students from government secondary schools in DelhiThe problem
Low and dispersed achievement, mismatch with curriculum
Math Hindi
10
10
8
8
Assessed level of ability
Assessed level of ability
6
6
4
4
2
2
0
0
5 6 7 8 9 10 5 6 7 8 9 10
Grade enrolled in Grade enrolled in
Linear fit Line of equality
This figure shows, for treatment group, the estimated initial level of student
achievement (determined by the Mindspark CAL program) plotted against the grade
they are enrolled in.The potential of CAL to personalize instruction
Math Hindi
Grade 6 Grade 7 Grade 6 Grade 7
10
8
6
Grade level of question administered by CAL
Grade level of question administered by CAL
4
5
2
0
0
Grade 8 Grade 9 Grade 8 Grade 9
10
8
6
4
5
2
0
0
1 2 3 4 5 6 7 8 1 2 3 4 5 6 7 8 1 2 3 4 5 6 7 8 9 1 2 3 4 5 6 7 8 9
Math level assessed by CAL system at baseline Hindi level assessed by CAL system at baseline
This figure shows, for treatment group, the grade level of questions administered by
the computer adaptive system to students in a single day (3 Nov 2015). The CAL
system (a) allows for precise targeting to individual ability levels; (b) can cope with
wide variation in ability levels within and across grade levels; (c) can adapt quickly to
changes in ability.Results from out-of-school model
Very large impacts in Delhi
.8
Mathematics Hindi
.8
0.70
.6
.6
0.41
.4
.4
Score
Score
0.34
.2
.2
0.10
0.05
0.01
-0.01
0
0
-0.05
-.2
-.2
Baseline Endline Baseline Endline
Control Treatment
Muralidharan, Singh and Ganimian (2016)Results from out-of-school model
Unlike business-as-usual, the intervention taught all students
Mathematics Hindi
2
2
Endline test score (SD)
Endline test score (SD)
1
1
0
0
-1
-1
0 20 40 60 80 100 0 20 40 60 80 100
Percentile on baseline test Percentile on baseline test
Control TreatmentResults from out-of-school model
Unlike business-as-usual, the intervention taught all students
1
Math Hindi
1
Residualized scores
Residualized scores
.5
.5
0
0
-.5
-.5
Bottom Middle Top Bottom Middle Top
Terciles Terciles
Control Treatment
Muralidharan, Singh and Ganimian (2016)Results Speak to Several Policy Debates
I Technology in Education:Results Speak to Several Policy Debates
I Technology in Education:
I Providing hardware alone seems to have very little impact on
learning outcomes (Angrist and Lavy 2004; Malamud and
Pop-Eleches 2011; Cristia et al. 2012; Beuermann et al. 2015)
I Modest positive effects of CAL programs that focus on
grade-appropriate instruction/review (Carillo et al. 2011; Lai et
al. 2012, 2013, 2015; Mo et al. 2014a, b)
I Large returns to customization (Banerjee et al. 2007)Results Speak to Several Policy Debates
I Technology in Education:
I Providing hardware alone seems to have very little impact on
learning outcomes (Angrist and Lavy 2004; Malamud and
Pop-Eleches 2011; Cristia et al. 2012; Beuermann et al. 2015)
I Modest positive effects of CAL programs that focus on
grade-appropriate instruction/review (Carillo et al. 2011; Lai et
al. 2012, 2013, 2015; Mo et al. 2014a, b)
I Large returns to customization (Banerjee et al. 2007)
I Developing country education
I Mismatch between student preparedness and curriculum is a
major concern (Banerjee and Duflo, 2012; Pritchett and
Beatty 2015)
I May explain low productivity of education in these settings
I “Teaching at the right level” effective in raising achievement in
primary schools (Banerjee et al 2007)
I But unclear whether feasible at secondary school levelUnderstanding political demand for computers in education
Understanding political demand for computers in education
CAL at policy relevant scales
Evaluating Mindspark in government schools

       I   Our Delhi study is best regarded as an “efficacy trial”
             I   delivered at small scale, with high fidelity, by motivated staff
       I   The pathway to scale will lie in extending to govt schools
             I   substantial policy demand for tech in education
                   I   typically with little idea of how tech will lead to more learning
                   I   if successful, might be rapidly scaleable
       I   Delivering in govt schools non-trivially different
             I   working with school teachers to deliver intervention
             I   integrating CAL in timetable
                   I   special adaptation due to hardware constraints
       I   We are working with GoR and EI for introduction in the
           coming school year.
             I   ~6000 students in treatment across 40 schools
             I   urban and rural areas
An initial assessment of heterogeneity
Math Scores Hindi Scores
8
8
Assessed level of ability
Assessed level of ability
7
7
6
6
5
5
4
4
3
3
2
2
1
1
0
0 1 2 3 4 5 6 7 8 0 0 1 2 3 4 5 6 7 8
Grade enrolled in Grade enrolled in
Note: Each dot represents 10 students Note: Each dot represents 10 students
Linear fit Line of equality
Muralidharan and Singh (ongoing)Summary
An evidence-based approach to education reform
I Policy efforts at increasing learning in schools have been
much less successful than increasing participation
I Governments are now increasingly aware of this issue and
willing to consider measuresSummary
An evidence-based approach to education reform
I Policy efforts at increasing learning in schools have been
much less successful than increasing participation
I Governments are now increasingly aware of this issue and
willing to consider measures
I We need to know whether these work in terms of outcomes
I just having delivered a program is not enough
I important for understanding which approaches should be
continued, which should be modified, which are best left alone
I too many fads in education, need discipline from evaluations
I often requires flexibility in methods (descriptive, experimental
+ non-experimental)
I there are things to be learned even from null resultsSummary
An evidence-based approach to education reform
I Policy efforts at increasing learning in schools have been
much less successful than increasing participation
I Governments are now increasingly aware of this issue and
willing to consider measures
I We need to know whether these work in terms of outcomes
I just having delivered a program is not enough
I important for understanding which approaches should be
continued, which should be modified, which are best left alone
I too many fads in education, need discipline from evaluations
I often requires flexibility in methods (descriptive, experimental
+ non-experimental)
I there are things to be learned even from null results
I With the right partnerships between policymakers and
academics, this is possible.You can also read