Surface Roughness Tuning at Sub-Nanometer Level by Considering the Normal Stress Field in Magnetorheological Finishing - MDPI
←
→
Page content transcription
If your browser does not render page correctly, please read the page content below
micromachines

Communication
Surface Roughness Tuning at Sub-Nanometer Level by
Considering the Normal Stress Field in
Magnetorheological Finishing
Xiaoyuan Li, Qikai Li                 , Zuoyan Ye, Yunfei Zhang, Minheng Ye * and Chao Wang *

                                           Institute of Machinery Manufacturing Technology, China Academy of Engineering Physics (CAEP),
                                           Mianyang 621900, China; lxy20056482@126.com (X.L.); 13547806909@163.com (Q.L.); yebonpu@126.com (Z.Y.);
                                           zhangyf306@yeah.net (Y.Z.)
                                           * Correspondence: yeminheng@tju.edu.cn (M.Y.); wangchaohit@126.com (C.W.)

                                           Abstract: Although magnetorheological finishing (MRF) is being widely utilized to achieve ultra-
                                           smooth optical surfaces, the mechanisms for obtaining such extremely low roughness after the MRF
                                           process are not fully understood, especially the impact of finishing stresses. Herein we carefully
                                           investigated the relationship between the stresses and surface roughness. Normal stress shows
                                           stronger impacts on the surface roughness of fused silica (FS) when compared with the shear stress.
                                           In addition, normal stress in the polishing zone was found to be sensitive to the immersion depth of
                                           the magnetorheological (MR) fluid. Based on the above, a fine tuning of surface roughness (RMS:
                                           0.22 nm) was obtained. This work fills gaps in understanding about the stresses that influence surface
                                           roughness during MRF.

                                           Keywords: magnetorheological finishing; surface roughness; force field simulation; normal stress


Citation: Li, X.; Li, Q.; Ye, Z.; Zhang,
Y.; Ye, M.; Wang, C. Surface Roughness
                                           1. Introduction
Tuning at Sub-Nanometer Level by                Fused-silica optics are integral to high-energy laser systems such as the wedged-focus
Considering the Normal Stress Field in     and beam-sampling lenses at the National Ignition Facility (NIF) at Lawrence Livermore
Magnetorheological Finishing.              National Laboratory (LLNL) [1]. Producing fused silica optics with high-quality surfaces
Micromachines 2021, 12, 997. https://      can reduce the scattering of laser energy and localize thermal focus, thus greatly enhancing
doi.org/10.3390/mi12080997                 the laser-induced damage threshold (LIDT) of the laser system [2,3]. Today, though the
                                           surface roughness of the fused silica can be improved to the sub-nanometer level via the
Received: 29 June 2021                     chemical-mechanical polishing (CMP) [4,5], the frequent iteration of this method induces a
Accepted: 16 August 2021                   low processing efficiency.
Published: 21 August 2021
                                                Magnetorheological finishing (MRF) is a novel kind of finishing technique that uses
                                           magnetorheological fluid consisting of carbonyl iron powder (CIP) in a basic liquid con-
Publisher’s Note: MDPI stays neutral
                                           taining polishing grains [6,7]. Nowadays, MRF is widely considered to be a deterministic
with regard to jurisdictional claims in
                                           method to finish optics to an extremely high surface quality [8]. During the MRF process, a
published maps and institutional affil-
                                           shear force dominates material removal; therefore, the relationship between the material
iations.
                                           removal rate (MRR) and force fields have been well investigated over the years [9–12].
                                           However, the other important perspective for evaluating MRF, surface roughness, is seldom
                                           related to the force fields owing to the intrinsic complexity of the surface morphology
                                           evolution during MRF finishing. In previous reports, the improvement of FS surface
Copyright: © 2021 by the authors.          roughness after MRF was mainly explained by mechanical and chemical theories from the
Licensee MDPI, Basel, Switzerland.         CMP. Cumbo et.al. reported that smooth silica surfaces can be obtained by using small-
This article is an open access article
                                           sized polishing grains, and they emphasized the importance of the fluid chemistry [13].
distributed under the terms and
                                           Redien et. al. found that surface roughness did not depend on the slurry pH [4]. Generally,
conditions of the Creative Commons
                                           unlike the CMP process, in which a normal load dominated the material removal, in MRF
Attribution (CC BY) license (https://
                                           the normal load was extremely low owing to the flexibility of the MRF fluid. In addition,
creativecommons.org/licenses/by/
                                           the hardness or sizes of the polishing grains in the MRF fluid, the magnetic induction
4.0/).

Micromachines 2021, 12, 997. https://doi.org/10.3390/mi12080997                                     https://www.mdpi.com/journal/micromachines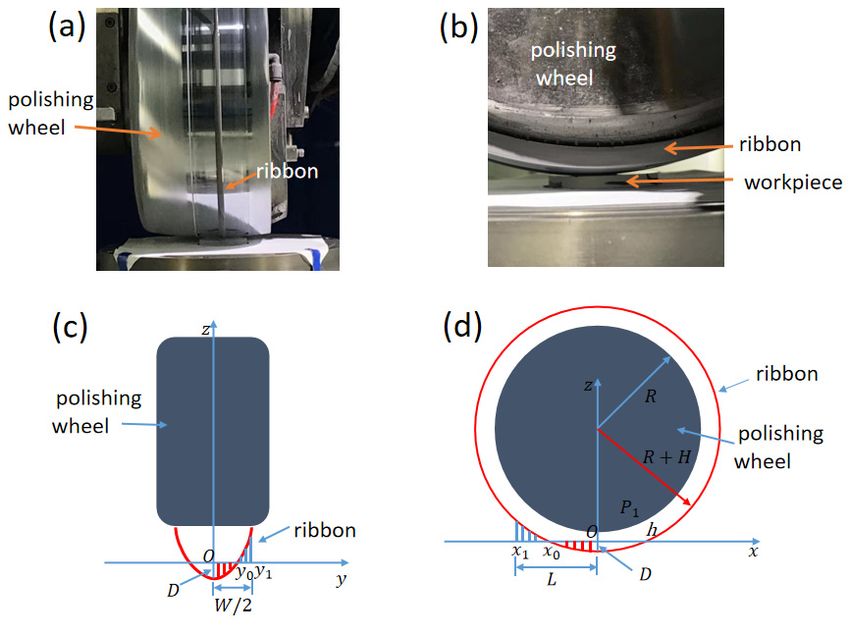
Micromachines 2021, 12, 997                                                                                           2 of 7

                              and size of the magnetic media, and the hydrodynamic behavior of the MRF fluid can
                              be main factors that determine the surface roughness of the optics after finishing [14–16].
                              Ji et. al. found that a polymer-coated iron powder performed better in improving surface
                              roughness of the FS compared with an uncoated powder since the soft polymer reduced the
                              magnitude of the local stress imposed on the fused silica [7]. Li et. al. found a monotonous
                              increasing non-linear correlation between subsurface damage depth and surface roughness
                              because a larger normal load led to an expansion of surface or subsurface defects [17].
                              The abovementioned works indicated that when the composition of the MRF fluid was
                              determined, the force fields in the polishing zone affected the surface roughness of the FS
                              after the MRF process.
                                     In this work, we evaluated the impact of force fields on surface roughness after
                              MRF. A Reynolds equation based on hydrodynamic theory was used to resolve force
                              distribution in MRF. By inputting the process parameters into theoretical calculation for
                              an MRF experiment, the importance of shear and normal stress to the final FS surface
                              roughness were compared. The discussion validated the stronger effect of normal stress on
                              surface roughness compared to shear stress.

                              2. Methodology
                                    Realistic MRF experiments were conducted together with simulation experiments.
                              For each round of single-factor experiments, only one process parameter was changed.
                              These parameters were immersion depth, polishing fluid viscosity and rotational speed.
                              Each round of the polishing experiment was conducted by the same numerical control
                              program of the machine tool. The water-based polishing fluid contained carbonyl iron
                              powder, polishing grains and other stabilizers. The carbonyl iron particles (CIPs), about
                              2 µm, were the HF type purchased from the BASF SE. The other additives were mainly
                              composed of ceria abrasives, de-ionized water, and Methoxypolyethylene glycols (MPEGs).
                              The work being finished was on a piece of fused silica (FS), the initial surface roughness
                              of which was 0.72 nm as measured by the Talysurf CII white light interferometer. For
                              each determined setting of the process parameters, the experiments were repeated two
                              times to reduce accidental errors. In addition, to obtain the MRF removal function, the
                              MR polishing ribbon interacted with the FS workpiece for 6 s. The rotational speed of the
                              polishing wheel were set at 80–110 rpm; the immersion depth of the finishing fluid was set
                              at 0.2–0.5 mm, the viscosities of the MRF fluid were 144, 155, 174, and 190 Pa. s. A straight
                              line removal mode of the removal function was used to obtain a super-smooth FS surface.
                                    Owing to the non-Newtonian characteristic of the MR fluid, the normal and shear
                              stress fields in the polishing zone were obtained by resolving the two-dimensional Reynolds
                              equation based on hydrodynamic theory [18,19]. The coordinate system of the MRF ma-
                              chine is presented in Figure 1c,d. Based on the classic hydrodynamic lubrication derivation
                              process [18], we derived the Reynolds equation of the MRF coordinate system as

                                                                  h3 ∂p                    h3 ∂p

                                                          ∂                        ∂                          ∂h
                                                                              +                        = 6U             (1)
                                                         ∂x       η ∂x            ∂y       η ∂y               ∂x

                                   Speed distribution is expressed by Equation (2), in which U2 represents the velocity
                              of the rotational wheel and U1 is the speed of the MRF fluid. Now, Equation (1) can be
                              resolved through the finite difference method, the boundary conditions for which are set
                              as Equations (3) and (4) where s is the finishing area, n is the vector of the z axis, h is
                              the distance from the workpiece surface to the bottom of the polishing wheel, and H is
                              the thickness of the MRF fluid ribbon. A mid-difference method was used to resolve the
                              pressure stress p (x,y) distribution.

                                                             1 ∂p  2                z
                                                       u=          z − zh + (U2 − U1 ) + U1                             (2)
                                                            2η ∂x                     h

                                                                                  p|s = 0                               (3)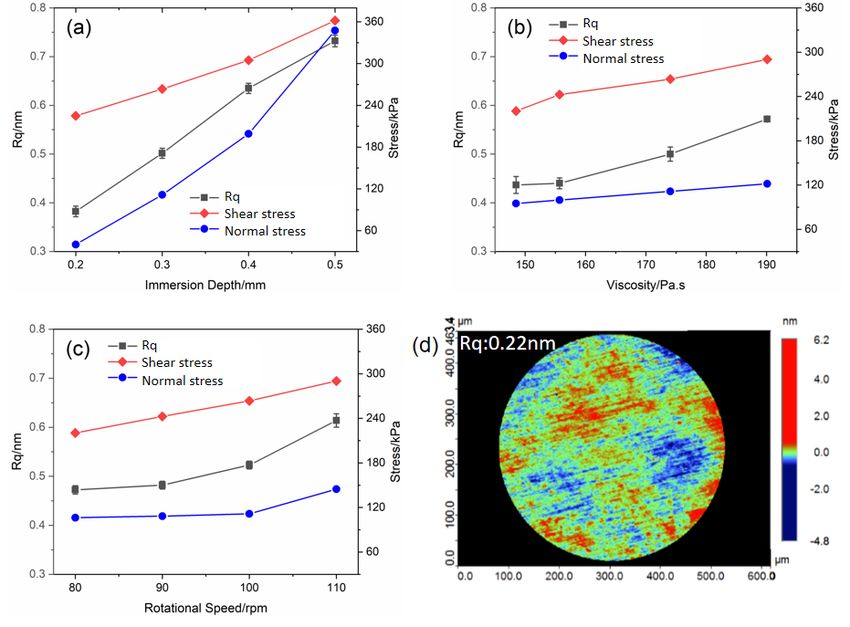
Micromachines 2021, 12, 997                                                                                                      3 of 7

                                                                             ∂p                                                           3 of
                                                                                      =0                                           (4)
                                                                             ∂n   s

      Figure 1. (a) MRF fluid ribbon on the polishing wheel, (b) contact of the fluid ribbon and the workpiece, (c) coordinate
     Figure
     system of 1.
               the(a)  MRFwheel
                   polishing fluid   ribbon
                                   and        onseen
                                       workpiece  thefrom
                                                       polishing      wheel,
                                                          the x-axis and        (b) contact
                                                                         (d) coordinate        ofthe
                                                                                        system of  the  fluidwheel
                                                                                                     polishing ribbon  and the work
                                                                                                                   and the
     piece,  (c) coordinate
     FS work-piece  seen from the system
                                  y-axis.  of the polishing wheel and workpiece seen from the x-axis and (d) co
     ordinate system of the polishing wheel and the FS work-piece seen from the y-axis.
                             After inputting the process parameters (immersion depth, viscosity, and polishing wheel
                        rotational speed) into the Reynolds equation, iterations resolved the normal stress p. Finally,
          Speed distribution    is expressed
                        by calculating               by Equation
                                       the partial differential           (2), stress,
                                                                of the normal  in which        Ustress
                                                                                       the shear  2 represents      the velocit
                                                                                                        was obtained.
                             In general, the supersmooth FS surface was obtained by iteration of the removal
     of the rotational wheel
                        function;and   U1 words,
                                  in other  is theasspeed        of the
                                                       one polishing    spotMRF
                                                                            moving  fluid.
                                                                                       along aNow,       Equation
                                                                                                determined   pathway, (1)
                                                                                                                       the can b
     resolved through the
                        wholefinite
                               surfacedifference
                                        of the FS wasmethod,         the boundary
                                                        finished. Figure                    conditions
                                                                           2a shows six typical              for which are se
                                                                                                    D-like shape-removal
                        functions on an FS workpiece under various parameters after the MRF spot taking tests.
     as Equations (3) and   (4) where s is the finishing area, n is the vector of the z axis, h is th
                        Figure 2b,c shows the simulated normal and shear stress fields calculated by Equation (1).
     distance from the The
                        workpiece        surface
                             “D-like” shape           to the
                                             of the stress       bottom
                                                            fields           of thewith
                                                                   was inconsistent     polishing       wheel,
                                                                                             the real removal     and ofH is th
                                                                                                               function
                        the MRF
     thickness of the MRF    fluidexperiment
                                     ribbon.inAFigure      2a. In addition,method
                                                    mid-difference           the orders wasof the used
                                                                                                  stress magnitude
                                                                                                          to resolve were
                                                                                                                        the pres
                        calculated at a kPa level, which was close to previous measurements [11,20].
     sure stress p (x,y) distribution.

                                                    1 ∂p 2                        z
                                            u=
                                                   2η ∂ x
                                                          ( z − zh ) + (U 2 − U1 ) + U1
                                                                                  h
                                                                                                                                            (2

                                                                       ps =0                                                                (3
Micromachines 2021, 12, 997 4 of 7
Micromachines 2021, 12, x 4 of 7
Figure
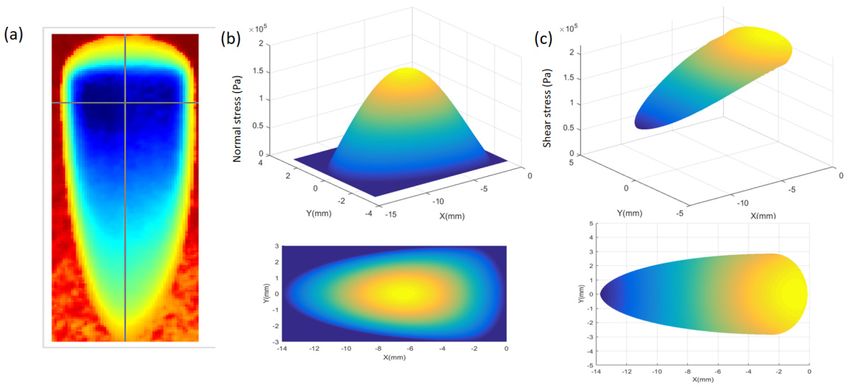
Figure 2. 2.
(a)(a)MRF
MRFpolishing
polishing spot
spot measured
measured bybyaaZYGO
ZYGOlaser interferometer,
laser (b) (b)
interferometer, calculated normal
calculated stressstress
normal distribution, (c)
distribution,
calculated shear stress distribution: (top: three-dimensional view of the polishing spot or stress distribution, bottom: view
(c) calculated shear stress distribution: (top: three-dimensional view of the polishing spot or stress distribution, bottom:
from the
Micromachines z axis
2021, 12, xof the coordinate system of the workpiece). 5 of 7
view from the z axis of the coordinate system of the workpiece).
3.3.Results
Resultsandand Discussion
Discussion
Figure3a
enhancement.
Figure 3aIn shows
shows thatto
contrast
that when the
the immersion
immersion
when depth, the
immersion depth was
was0.2
increase
depth of0.2mm,
themm, thethe
surface
stresses wereroughness
surface not obvi-
roughness
(Rq)
ous asof the
shown FS was
in reduced
Figure 3a. Afrom 0.72
similar to 0.31
tendency nm.
wasIncreasing
also foundthe immersion
for the
(Rq) of the FS was reduced from 0.72 to 0.31 nm. Increasing the immersion depth severely depth
rotational severely
speed. As
deteriorated
the polishing the final
wheel surface
increased quality.
from 80At an
to immersion
110 rpm, thedepth
peak of 0.5
normal mm, the
only
deteriorated the final surface quality. At an immersion depth of 0.5 mm, the surface roughness surface
changed rough-
from
nesstoonly
107 145 improved
kPa from from
(peak0.75
shear 0.75 to 0.72 nm. In an immersion depth3a–c,
range of 0.2–0.5 mm (not
only improved to stress:
0.72 nm.232In toan285 kPa). From
immersion Figure
depth range ofa0.2–0.5
lower immersion
mm (not large
large for
depth, practical
viscosity, andMRF) the final
rotational Rq led
speed sawtoaan dramatic enhancement
ultrasmooth finished from
FS 0.31 toIn0.72
surface. nm,
a mod-
for practical MRF) the final Rq saw a dramatic enhancement from 0.31 to 0.72 nm, which
which
ified indicated
process that surface
parameter roughness
setting, surface after MRFcan
roughness wasbe sensitive
reduced totoimmersion
0.22 nm as depth.
shown in
indicated that surface roughness after MRF was sensitive to immersion depth.
FigureFigure
3d. 3b shows that as the viscosity of the MR fluid increased from 155 to 190 Pa. s,
the final Rq changed slightly from 0.48 to 0.68 nm. Such a phenomenon indicated that
increasing viscosity could lead to the deterioration of surface quality. In addition, further
decreasing the viscosity (148 Pa. s) did not obviously change surface quality (Rq: 0.44 nm).
Regarding rotational speed, as it increased from 90 to 110 rpm as shown in Figure 3c,
the corresponding Rq changed from 0.48 to 0.60 nm. To achieve better surface quality, we
reduced the speed to 80 rpm; however, the Rq was only reduced to 0.47 nm. It is clear that
with the enhanced rotational speed, the shear stress followed a linear trend. In contrast,
normal stress increased exponentially similar to the Rq curve.
The abovementioned phenomena indicated that when the rotational speed or viscos-
ity of the MR fluid fell below a liminal value in the only-one-factor changed MRF experi-
ment, the surface roughness of the FS did not visibly improve, whereas other process pa-
rameters were more dominant.
Li et. al. reported the monotonously increasing non-linear correlation between sur-
face roughness and the density of the subsurface defect, which mainly originated from the
normal load [18]. Then the correlation of stress fields and surface roughness was carefully
considered. Specifically, as the immersion depth increased from 0.2 to 0.5 mm, the peak
normal stress, defined as the largest normal stress in the entire polishing zone, saw a dra-
matic change from 42 to 353 kPa; meanwhile, the peak shear stress rose slightly (238 to
360 kPa). Such results indicated that peak normal stress was more sensitive than peak
shear stress to the immersion depth.
With the enhancement of MR fluid viscosity, the peak normal stress changed from 95
to 123 kPa as shown in Figure 3b; meanwhile, the peak shear stress saw a 230 to 290 kPa
Figure Relationships
Figure 3. Relationships between
between surface
surface roughness/peak
roughness/peak shear stress/peak
shear stress/peak normal
normal stress andstress
pro- and
cess parameters
process including
parameters (a) immersion
including depth,
(a) immersion (b) viscosity
depth, of MR
(b) viscosity offluid and (c)
MR fluid androtational speed.speed.
(c) rotational
(d)Surface
(d) Surface roughness
roughness of
of the
the FS
FSunder
underthe
thedetermined
determinedprocess parameter.
process parameter.
To gain a deeper insight into the relationship between surface quality and the im-
posed stresses on the FS workpiece, we compared the Rq and the peak stresses of each
MRF test. The x coordinate represents the stresses, and the y coordinate represents the Rq.Micromachines 2021, 12, 997 5 of 7
Figure 3b shows that as the viscosity of the MR fluid increased from 155 to 190 Pa. s,
the final Rq changed slightly from 0.48 to 0.68 nm. Such a phenomenon indicated that
increasing viscosity could lead to the deterioration of surface quality. In addition, further
decreasing the viscosity (148 Pa. s) did not obviously change surface quality (Rq: 0.44 nm).
Regarding rotational speed, as it increased from 90 to 110 rpm as shown in Figure 3c,
the corresponding Rq changed from 0.48 to 0.60 nm. To achieve better surface quality, we
reduced the speed to 80 rpm; however, the Rq was only reduced to 0.47 nm. It is clear that
with the enhanced rotational speed, the shear stress followed a linear trend. In contrast,
normal stress increased exponentially similar to the Rq curve.
The abovementioned phenomena indicated that when the rotational speed or viscosity
of the MR fluid fell below a liminal value in the only-one-factor changed MRF experiment,
the surface roughness of the FS did not visibly improve, whereas other process parameters
were more dominant.
Li et. al. reported the monotonously increasing non-linear correlation between surface
roughness and the density of the subsurface defect, which mainly originated from the
normal load [18]. Then the correlation of stress fields and surface roughness was carefully
considered. Specifically, as the immersion depth increased from 0.2 to 0.5 mm, the peak
normal stress, defined as the largest normal stress in the entire polishing zone, saw a
dramatic change from 42 to 353 kPa; meanwhile, the peak shear stress rose slightly (238 to
360 kPa). Such results indicated that peak normal stress was more sensitive than peak
shear stress to the immersion depth.
With the enhancement of MR fluid viscosity, the peak normal stress changed from
95 to 123 kPa as shown in Figure 3b; meanwhile, the peak shear stress saw a 230 to 290 kPa
enhancement. In contrast to immersion depth, the increase of the stresses were not obvious
as shown in Figure 3a. A similar tendency was also found for the rotational speed. As the
polishing wheel increased from 80 to 110 rpm, the peak normal only changed from 107 to
145 kPa (peak shear stress: 232 to 285 kPa). From Figure 3a–c, a lower immersion depth,
viscosity, and rotational speed led to an ultrasmooth finished FS surface. In a modified process
parameter setting, surface roughness can be reduced to 0.22 nm as shown in Figure 3d.
To gain a deeper insight into the relationship between surface quality and the imposed
stresses on the FS workpiece, we compared the Rq and the peak stresses of each MRF test.
The x coordinate represents the stresses, and the y coordinate represents the Rq. In Figure 4,
a parallel-like tendency of the Rq and peak normal stress was detected. In comparison, the
shear stress showed a slight fluctuation, and the correlation between the shear stress and
the Rq was not close.
N ∑ xi yi − ∑ xi ∑ yi
r= q q (5)
2
2
N ∑ xi − ( ∑ xi ) N ∑ y2i − (∑ yi )2
In a quantitative evaluation model, the Pearson correlation coefficients of peak normal
stress and shear stress to surface roughness was calculated to be 0.967 and 0.862, respec-
tively. The Pearson correlation coefficient is depicted in Equation (5). When r is closer to 1,
x and y are more correlated. Obviously, the stronger impact of the normal stress compared
with the shear stress on the final surface roughness after MRF was re-identified.Micromachines 2021, 12, 997 6 of 7
Micromachines 2021, 12, x 6 of 7
Comparisonof
Figure4.4.Comparison
Figure ofthe
the stresses
stresses and
and surface
surfaceroughness
roughness(Rq)
(Rq)inin1010
rounds of of
rounds thethe
MRF experiments.
MRF experiments.
4. Conclusions
4. Conclusions
Overall, the relationship between the stresses in the polishing zone and the surface
Overall,
roughness themagnetorheological
after relationship between the stresses
finishing in theSpecifically,
was studied. polishing zone and the
the surface surface
rough-
roughness after magnetorheological finishing was studied. Specifically,
ness was found to be much more correlated to peak normal stress than with peak shear the surface rough-
ness was
stress. Thefound to be coefficients
correlation much more ofcorrelated
the normal to peak
stress andnormal stresstothan
shear stress with
surface peak shear
roughness
stress. The correlation
were 0.967 coefficients Increasing
and 0.862, respectively. of the normal stress and depth,
the immersion shear stress to surface
viscosity of the MRFrough-
ness were 0.967 and 0.862, respectively. Increasing the immersion depth, viscosity
fluid, and polishing wheel rotational speed contributed to a larger normal stress, which led of the
MRF fluid, andofpolishing
to deterioration wheel
the surface rotational
roughness in the speed contributed
MRF process. to a larger
Such results helpednormal stress,
us predict
the surface
which led toroughness under of
deterioration specific processroughness
the surface parameters,inthereby
the MRF reducing experimental
process. Such results
trials tous
helped obtain a better
predict the surface
surfacequality of fused
roughness silica,
under which leads
specific to time
process saving and
parameters, lower re-
thereby
ducing experimental trials to obtain a better surface quality of fused silica, whichstress
costs. Furthermore, the correlation between the surface roughness and peak normal leads to
maysaving
time provideandinsight
lowerinto the mechanisms
costs. Furthermore, of the
fused silica surface
correlation roughness
between after MRF.
the surface roughness
and peak normal stress may provide insight into the mechanisms of fused silica surface
Author Contributions: Conceptualization: M.Y. and C.W.; Methodology: X.L.; Software: Q.L. and
roughness after MRF.
Z.Y.; Investigation: X.L.; Resources: C.W.; Data curation: X.L.; Writing-review and editing: M.Y.;
Supervision: M.Y. and C.W.; Project administration: Y.Z.; Funding acquisition: C.W. All authors have
Author Contributions:
read and : M.Y. and
agreed to the published C.W.; of
version Methodology: X.L.; Software: Q.L. and Z.Y.; Investigation:
the manuscript.
X.L.; Resources: C.W.; Data curation: X.L.; Writing-review and editing: M.Y.; Supervision: M.Y. and
Funding:
C.W.; Thisadministration:
Project research is funded by the
Y.Z.; Sichuan
Funding Science andC.W.
acquisition: Technology Program,
All authors have2021JDJQ0014; the to
read and agreed
National Natural Science Foundation
the published version of the manuscript.of China, 51905506; the laboratory of Precision Manufacturing
Technology, K1155-1821-TCJ; and the Inovation and Development Foundation of CAEP, CX20210006.
Funding: This research is funded by the Sichuan Science and Technology Program, 2021JDJQ0014;
Institutional Review Board Statement: Not applicable.
the National Natural Science Foundation of China, 51905506; the laboratory of Precision Manufac-
turing Technology,
Informed K1155-1821-TCJ;
Consent Statement: and the Inovation and Development Foundation of CAEP,
Not applicable.
CX20210006.
Institutional Review Board Statement: Not applicable.
Informed Consent Statement: Not applicable.
Acknowledgments: The authors are grateful for the financial support from the Sichuan Science and
Technology Program (2021JDJQ0014), the National Natural Science Foundation of ChinaMicromachines 2021, 12, 997 7 of 7
Acknowledgments: The authors are grateful for the financial support from the Sichuan Science and
Technology Program (2021JDJQ0014), the National Natural Science Foundation of China (No.51905506),
the laboratory of Precision Manufacturing Technology (CAEP. No. K1155-1821-TCJ, ZD17005), and
the Innovation and Development Foundation of CAEP (CX20210006).
Conflicts of Interest: The authors declare no conflict of interest.
References
1. Miller, G.H.; Moses, E.I.; Wuest, C.R. The National Ignition Facility. Opt. Eng. 2004, 43, 2841–2853. [CrossRef]
2. Campbell, J.H.; Hawley-Fedder, R.A.; Stolz, C.J.; Menapace, J.A.; Borden, M.R.; Whitman, P.K.; Yu, J.; Runkel, M.J.; Riley, M.O.;
Feit, M.D.; et al. NIF optical materials and fabrication technologies: an overview. Proc. SPIE 2004, 5341, 84–101. [CrossRef]
3. Jacobs, S.D. Manipulating mechanics and chemistry in precision optics finishing. Sci. Technol. Adv. Mater. 2007, 8, 153–157.
[CrossRef]
4. Redien, M.; Maunier, C.; Remy, B.; Poliakoff-Leriche, K.; Neauport, J. Impact of slurry pH on material removal rate and surface
quality of polished fused silica. Proc. SPIE 2017, 10448, 104480F. [CrossRef]
5. Suratwala, T.; Steele, R.; Miller, P.E.; Wong, L.; Destino, J.F.; Feigenbaum, E.; Shen, N.; Feit, M. Influence of partial charge on the
material removal rate during chemical polishing. J. Am. Ceram. Soc. 2019, 102, 1566–1578. [CrossRef]
6. Catrin, R.; Neauport, J.; Taroux, D.; Cormont, P.; Lambert, C.M.S. Magnetorheological finishing for removing surface and
subsurface defects of fused silica optics. Opt. Eng. 2014, 53, 092010. [CrossRef]
7. Ji, F.; Xu, M.; Wang, B.; Wang, C.; Li, X.; Zhang, Y.; Zhou, M.; Huang, W.; Wei, Q.; Tang, G.; et al. Preparation of methoxyl
poly(ethylene glycol) (MPEG)-coated carbonyl iron particles (CIPs) and their application in potassium dihydrogen phosphate
(KDP) magnetorheological finishing (MRF). Appl. Surf. Sci. 2015, 353, 723–727. [CrossRef]
8. Ghosh, G.; Sidpara, A.; Bandyopadhyay, P.P. Review of several precision finishing processes for optics manufacturing. J. Micromanuf.
2018, 1, 170–188. [CrossRef]
9. DeGroote, J.E.; Marino, A.E.; Wilson, J.P.; Bishop, A.L.; Lambropoulos, J.C.; Jacobs, S.D. Removal rate model for magnetorheologi-
cal finishing of glass. Appl. Opt. 2007, 46, 7927–7941. [CrossRef] [PubMed]
10. Kordonski, W.; Gorodkin, S. Material removal in magnetorheological finishing of optics. Appl. Opt. 2011, 50, 1984–1994. [CrossRef]
[PubMed]
11. Miao, C.L.; Shafrir, S.N.; Lambropoulos, J.C.; Mici, J.; Jacobs, S.D. Shear stress in magnetorheological finishing for glasses. Appl. Opt.
2009, 48, 2585–2594. [CrossRef] [PubMed]
12. Wang, D.; Hu, H.; Li, L.; Bai, Y.; Luo, X.; Xue, D.; Zhang, X. Effects of the gap slope on the distribution of removal rate in Belt-MRF.
Opt. Express 2017, 25, 26600–26614. [CrossRef] [PubMed]
13. Cumbo, M.J.; Fairhurst, D.; Jacobs, S.D.; Puchebner, B.E. Slurry particle size evolution during the polishing of optical glass. Appl. Opt.
1995, 34, 3743–3755. [CrossRef] [PubMed]
14. Sidpara, A.; Das, M.; Jain, V.K. Rheological characterization of magnetorheological finishing fluid. Mater. Manuf. Process. 2009, 24,
1467–1478. [CrossRef]
15. Sidpara, A.; Jain, V.K. Theoretical analysis of forces in magnetorheological fluid based finishing process. Int. J. Mach. Tools Manuf.
2012, 51, 358–362. [CrossRef]
16. Barman, A.; Das, M. Nano-finishing of bio-titanium alloy to generate different surface morphologies by changing magnetorheo-
logical polishing fluid compositions. Prec. Eng. 2018, 51, 145–152. [CrossRef]
17. Li, S.; Wang, Z.; Wu, Y. Relationship between subsurface damage and surface roughness of optical materials in grinding and
lapping processes. J. Mater. Process. Technol. 2008, 205, 34–41. [CrossRef]
18. Peiran, Y.; Shizhu, W. A generalized Reynolds equation for non-Newtonian thermal elastohydrodynamic lubrication. J. Tribol.
1990, 112, 631–636. [CrossRef]
19. Kordonski, W.I.; Jacobs, S.D. Magnetorheological finishing. Int. J. Mod. Phys. B 1996, 10, 2837–2848. [CrossRef]
20. Miao, C.; Shafrir, S.N.; Lambropoulos, J.C.; Jacobs, S.D. Normal force and drag force in magnetorheological finishing. Proc. SPIE
2009, 7426, 74260C. [CrossRef]You can also read