How close should boats come to the fronts of Svalbard's calving glaciers? - Jack Kohler, Norwegian Polar Institute.
←
→
Page content transcription
If your browser does not render page correctly, please read the page content below
Front of Kronebreen, near Ny-Ålesund. Photo: Kim Holmén

How close should boats come to the fronts
of Svalbard’s calving glaciers?
Jack Kohler, Norwegian Polar Institute.
How close should boats come to the fronts of Svalbard’s calving glaciers?
Jack Kohler
Norwegian Polar Institute, Polar Environmental Centre, N-9296 Tromsø.
Summary
In 2007 a tourist ship came too close to an actively calving glacier in the Hornsund area of
Svalbard. Calving ice blocks fell on the boat’s deck, injuring a number of the tourists
onboard. In the aftermath of this incident, the Governor of Svalbard commissioned this report
from the Norwegian Polar Institute. Two basic questions were posed: what should be the
minimum safe distance (MSD) from calving fronts; and 2) is it possible to “read” the calving
glacier front to deduce whether it was safe to approach closer or not.
The two main conclusions are:
• At the level of individual events, calving is a random process. It is impossible to
predict precisely when calving may occur, how large a block will be created, or how
it will enter the water.
• 200 m is a safe minimum distance, with a good margin for safety, for avoiding both
direct hits and the largest waves.
Furthermore:
• Using calving cliff height as an estimator for the MSD is inadequate since the hinge
point can lie beneath the waterline. In addition, submarine calving events can bring
large ice blocks much farther out than the calving cliff height.
• Waves that are created closest to the block, in the so-called splash zone, are very
large, unpredictable, and dangerous, particularly for small boats. The MSD for
avoiding direct hits from ice blocks needs to be larger to ensure that vessels are
outside of the splash zone.
• Outside of the splash zone, waves become coherent, and can be ridden out. However,
as waves become grounded, either in shallow water, or on shore, tsunami waves are
created.
• Small boats should not land on shores near the edge of calving cliff faces.
• The 200 m distance should be increased in narrow fjords, in shallow fjords, or
locations with ice cliffs higher than 40-50 m.
Introduction
Tidewater glaciers are glaciers whose fronts terminate in marine waters, either in fjords
(Figure 1) or directly into the ocean. The most noteworthy aspect of tidewater glaciers is that
they lose ice at their fronts primarily through calving, the direct shearing off of large ice
blocks. Tidewater glaciers comprise over 20% of the coastline of Svalbard, or about 1000 km
(Figure 2).
Tidewater glaciers speed up as they approach their front, stretching the ice to create a
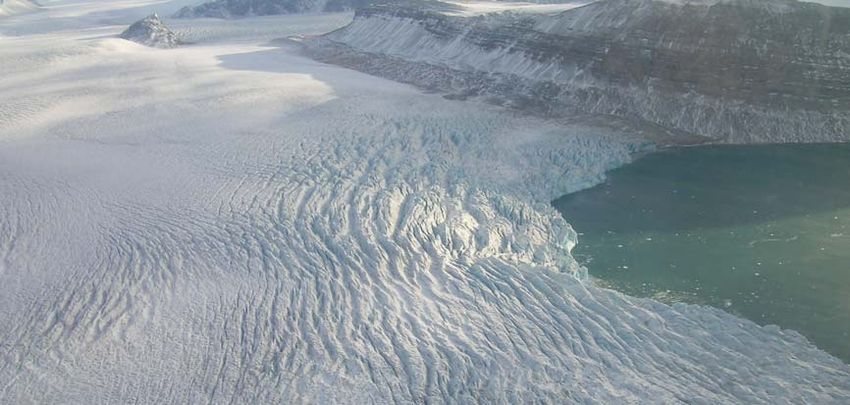
pervasive system of fracture planes along which large crevasses can open (Figure 3). Because
ice is plastic, compressive forces at depth prevent fractures from propagating through the
entire ice thickness, although water in fractures is thought to wedge them open to greater
depths than would be predicted for cold ice. Regardless, ice feeding into a calving front is
laced with sufficient planes of weakness along which ice can readily break off.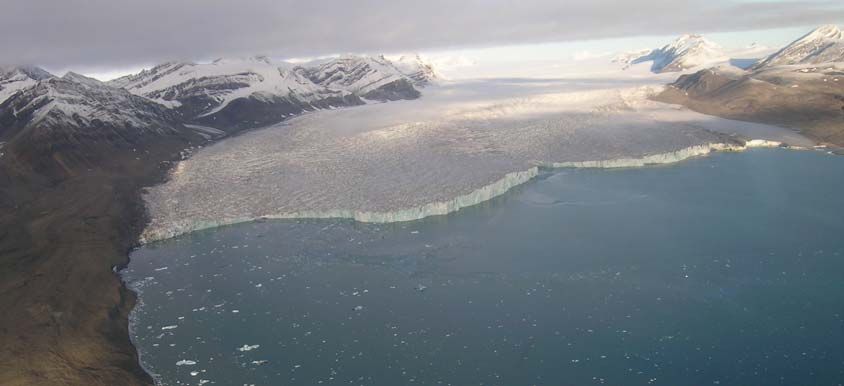
At the level of individual events, calving is a random process, that is, it is essentially
impossible to predict exactly when calving may occur or how large a block will be created.
The best we can say is that the fracture planes define the geometry of calved ice blocks. As a
result calving is strongly influenced by crevasses created upglacier and advected to the front,
and by newer crevasses forming directly in response to local stresses at the calving front
(Benn et al. 2007).
All tidewater glaciers on Svalbard are grounded. There are no floating ice shelves, as there
are in Antarctica for example. This means that ice loss from tidewater glaciers on Svalbard
occurs at or very close to the fronts. On ice shelves, breaks can occur far inland to create
large table-shaped icebergs. In Antarctica, these tabular icebergs are so large that they are
given names and tracked by satellite; B-15 for example was 11,000 km2 when it broke off of
the Ross Ice Shelf in 2000. Tabular icebergs can also break off from grounded glaciers, as
can be seen occasionally in the eastern part of the Svalbard (Dowdeswell, 1989). These are
far smaller than those found in Antarctica, however, measuring only a few 100s of meters at
the most (Dowdeswell, 1989).
The dominant calving mode on Svalbard is for ice to break off no more than a few 10s of
meters from the front. Typical blocks observed in Kongsfjord for example rarely exceeded 20
m in length (Dowdeswell and Forsberg, 1992). Nevertheless, even such “small” ice blocks
represent a real danger to those who venture too close to them, both from direct contact as
well as from the waves that are created as the blocks enter the water.
The calving rate C is defined as the difference between the vertically averaged average
velocity at the front U f and the rate of change in the glacier length L
dL
C =U f − .
dt
Retreating glaciers and fast flowing glaciers both have higher calving rates. In general, the
faster the ice flowing into the calving front, the larger the number of calving events.
However, the size of individual calving events may not be a direct function of ice speed. If
anything, very rapid flow (e.g. from surging glaciers) appears to be associated with a high
degree of fracturing, leading to a greater number of calving events comprising smaller blocks
(Dowdeswell, 1989).
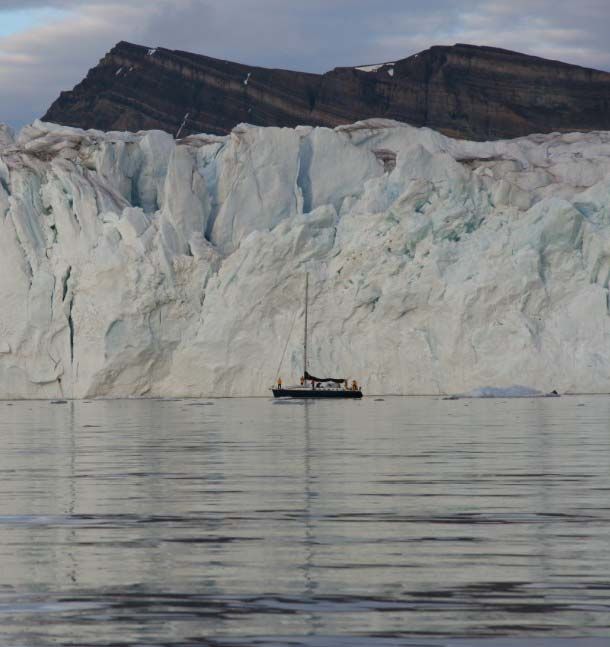
Figure 1 Calving glacier front of Sveabreen, a typical Svalbard tidewater glacier, draining into Isfjord. Ice
cliffs here are a maximum of about 40 m.Figure 2 Distribution of glacier on Svalbard whose fronts lie in marine waters.
Calving processes
There are two basic calving modes: subaerial and submarine. Subaerial calving (Figure 4)
is familiar from television, with the spectacular footage of calving glaciers used in news
stories on retreating glaciers. Calving glaciers are obviously compelling photographic
subjects, hence the interest in getting as close as possible to one. There are by now many
amateur videos available on the web; at this writing nearly 300 clips on YouTube.com show
a variety of styles and scales of subaerial calving, as well as the waves that are generated in
the events (references to a few scenes can be found at the end of this report).
In contrast, submarine calving (Figure 5), in which ice breaks off underneath the water
surface, is not as well documented since it occurs less frequently. Furthermore it is difficult
to detect as it often happens simultaneously with subaerial calving events (Motyka, 1997;
Warren et al, 1995).
In practice it is not possible to predict with any useful accuracy when calving will occur,
how large a block will be broken off, or how it will enter the water. Calving blocks will in
general break along existing fracture lines, shown schematically in Figure 4a as crevasses.
Smaller fractures also exist, but the typical width between crevasses wc is an easily observed
estimator of the largest calving block width expected. Other key parameters are the calving
cliff height Hc and the water depth at the calving front Dwww (Figure 4).
Calved ice blocks often slide nearly directly downward into the water, with a minimum
forward movement that is roughly comparable to the width of the calving block wc (Figure
4b). In the extreme, however, the ice block can fall outward as if hinged on the failure plane
(Figure 4c). Therefore, an absolute minimum safe distance (MSD) would be the exposed ice
cliff height Hc.
The failure point on the calving front may also occasionally lie beneath the water line. In
the extreme, the MSD could be equal to the ice cliff height plus the water depth at the calving
front (Figure 4d), if the block were to rotate outward at the lowermost point. This is a less
likely scenario, as the block would almost certainly break lengthwise as it rotated, but it isclear that simply using the calving cliff height as an estimator for the MSD is insufficient
since the hinge point can lie some depth under the waterline.
Figure 3 Calving glacier front of Kongsbreen, near Ny-Ålesund, showing development and enlargement of
crevasses as ice moves closer to the calving front.
The second calving mode is submarine. As subaerial calving proceeds, the upper ice face
retreats, leaving behind an ice “foot” at depth (Figure 5a). Submarine calving occurs when
the force exerted on the ice foot by flotation exceeds its fracture strength (Figure 5). The ice
mass then pops to the surface (Figure 6). There are practically no in situ measurements of ice
feet, for obvious reasons. The best studied example is by Hunter and Powell (1998), who
used an autonomous submarine to measure an ice foot on Muir Glacier in Alaska, a tidewater
glacier comparable in scale to those found in Svalbard. The ice foot was roughly 20 m thick
and extended some 60 m from the ice face at a depth of 40 m below water line. The exposed
ice cliff was 40 m. Thus if this particular ice foot were to break below the cliff face and
simply thrust upward, it would directly impact anything floating above, over an area about
1.5 times the exposed ice cliff height Hc. Little other data are available, so a MSD in this case
might be a multiple of the cliff height. An alternative would be to use a multiple k of the
crevasse spacing wc, since a limited number of crevasse events can take place before the foot
breaks off. The example from Muir Glacier suggests k = 3-6, assuming a typical crevasse
spacing of 10 - 20 m.
However, submarine calving blocks have been observed to surface much farther from the
cliff face. Table 1 summarizes the few observations in the literature.These so-called
“shooters” have been recorded surfacing at distances as great as 500 m from the ice front
(Motyka, 1997). Furthermore, Motyka (1997) reported that there was no forward motion
when the shooters surfaced, implying that ice feet may extend far out from the calving front.
From the few observations available, the surfacing distance appears to scale with the fjord
depth (Table 1). Therefore, one might allow for twice the fjord depth as a MSD for this most
extreme case of calving.
Waves
Waves are the second most important hazard associated with calving, after direct impact
by ice blocks. Closest to the impact location is the splash zone (Walder et al 2003). Water
motion in the splash zone is highly complex and not amenable to modeling or simplification
in any quantitative way, except to point out the obvious: it is the most hazardous area to besituated in. From observations, typical length scales for the splash zone appear to be about 2-
4 times the characteristic length scale of the ice block.
wc
Hc
MSD = wc
Dw
a) b)
MSD = Hc MSD = Hc+ Dw
c) d)
Figure 4 Calving processes: a) Calving front, with grounded crevassed ice feeding into fjord. Critical
parameters are calving cliff height Hc, fjord depth Dw, and typical distance between crevasses wc.
Waves at the water line can erode and undercut the calving front. b) Calving event with failure at
the water line, showing block gliding downward. Minimum safe distance (MSD) scales with wc. c)
Same as b), but with rotation outward. In this case, MSD scales with Hc. d) Calving event with
failure occurring below the water line. In the extreme, a fracture plane may extend to the fjord
bottom. In this case, MSD scales with Hc + Dw.MSD = k wc
a) b)
Figure 5 a) Ice foot below water line created after repeated calving above the water surface. b) Relatively
short and thick ice foot, which will have a tendency to simply rise upward when it breaks. From
the few observations available, a reasonable estimate of the foot dimension is some multiple of the
crevasse width. However, some submarine blocks have been observed to surface at significantly
greater distances from the ice cliff, so-called “shooters” (Table 1).
a b
c d
Figure 6 Submarine calving event at Columbia Glacier in Alaska. A large underwater ice block pops up and
rotates on its side. To get a sense of the scale of the event, the exposed ice cliff height is about 120
m high (image from http://www.robfatland.net/seamonster/
index.php?title=Columbia_Glacier_submarine_calving).
Table 1 Observations of reported ice foot surfacing distances
Maximum distance
Location from glacier front Fjord depth Reference
Columbia Glacier, Alaska 300 m 300 m Hunter and Powell, 1998
LeConte Glacier, Alaska 500 m 250 m Motyka, 1997
Glaciar San Rafael, Chile 150 m 200 m Warren et al, 1995As waves emerge from the splash zone, they begin to organize into coherent long- amplitude surface waves which are more readily described by classic hydraulic relations. Since calving events in the wide fjords of Svalbard are in general point-like rather than plane like (i.e. the entire calving face does not appear to peel away and enter the water simultaneously, and fjords tend to be fairly wide relative to the lateral dimensions of the calved blocks), waves spread outward from the calving location in a ring-like fashion. The importance of this observation is that geometric spreading reduces wave amplitude approximately as a function of 1/d where d is the distance to the impact. Practically, this means that if a 4 m high wave is seen halfway between an observer and the impact site, it should decay to about 2 m by the time it reaches the observer. This is only true so long as the fjord is sufficiently deep; waves will begin to break as water depths decrease, as is the case with any tsunami, such as the Boxing Day Tsunami of 2004. In particular, beaches close to the calving face can potentially be sites of large waves. The onshore run-up height will depend on many variables, however, and defies a simple analysis. The best rules of thumb for waves might be that 1) the MSD should be multiplied by a factor of at least two to avoid the largest waves in the splash zone, and 2) one should not land small boats on shores near the edge of calving cliff faces. Calving dimensions around Svalbard Calving cliff heights The Norwegian Polar Institute DEM was used to find all ice cliffs in contact with marine water (Figure 7). The vast majority of these cliffs are 60 m or less (Figure 8). Nearly all of the exposed ice cliffs greater than about 60 m are in areas where an older section of the DEM has been updated with a newer front position, without compensating for the concurrent reduction in the ice thickness. In all locations where the DEM and front position data are contemporary, cliff heights are 60 m or less. After trimming these data, the average cliff height for all Svalbard tidewater glaciers is found to be 20 m, with typical values for the largest cliff heights at around 40-50 m. Water depths in front of calving glaciers Fjord depth measurements made by the Norwegian Hydrographic Service are filtered to find all depths recorded 500 m or closer to tidewater glacier edges (Figure 9). The data do not cover all of Svalbard; however, there are sufficient measurements to show that mean fjord depth is 40 m, and most fjords are 50 m deep or less near the front. Recommended safe distance In summary: to avoid direct contact with calving ice pieces, the minimum safe distance MSD from the calving front would be the total ice thickness (Dw +Hc) for subaerial calving, or twice the fjord depth Dw for submarine calving. The average cliff height in Svalbard is 20 m, with maximum cliffs of about 50 m. The average fjord depth is 40 m. The MSD considering direct impact alone is thus somewhere between 60-80 m from the cliff face. This should then be increased by a factor of two to account for the most hazardous waves that are formed in the splash zone around the calved block, to give a MSD of 120-160 m from typical calving glaciers. That is for a minimum safe distance. A reasonable safe distance, with a better margin for safety, would then be 200 m. Furthermore, this distance should be increased in narrow fjords, where wave amplitudes do not diminish radially, in shallow fjords, where waves can increase in amplitude or even break, and in front of glaciers with unusually high ice cliffs.
Figure 7   Location and heights of exposed ice cliffs for tidewater glaciers on Svalbard. Cliff heights are
           taken from the Norwegian Polar Institute digital elevation model (DEM). Some of the DEM
           comprises older elevational data updated with a more modern front position. At such locations
           (e.g. Edgeøya, arrow), the calculated cliff heights are too high since ice has actually also thinned at
           these locations, together with retreat.

Figure 8   Distribution of exposed ice cliff heights shown in Figure 7. Many of the cliff heights over 60 m
           are incorrect, for reasons explained in the text.
Figure 9 Measured fjord depths, where available, located within 500 m of tidewater glaciers. Dataset is
geographically incomplete.
Figure 10 Distribution of measurements of fjord depth that are located within 500 m of tidewater glacier
fronts. Dataset is geographically incomplete, but shows mean fjord depths is 40 m, with most
fjords 50 m deep or less.
References
Benn, D.I., C.R. Warren, & R.H. Mottram. 2007. Calving processes and the dynamics of
calving glaciers. Earth Science Rev. 82, 143-179.
Dowdeswell, J. 1989. On the nature of Svalbard icebergs. J. Glaciol. 35(120), 224-234.Dowdeswell, J. A. & C. F. Forsberg.1992. The size and frequency of icebergs and bergy
bits derived from tidewater glaciers in Kongsfjorden, northwest Spitsbergen. Polar
Res. 11(2), 81-91.
Hunter, L.E.; Powell, R.D. 1998. Ice foot development at temperate tidewater margins
in Alaska. Geophys. Res. Lett., 25(11), 1923-1926
Motyka, R.J., 1997. Deep-water calving at Le Conte Glacier, Southeast Alaska. In: Van
der Veen, C.J. (Ed.), Calving Glaciers: Report of a Workshop, Feb. 28–March 2,
1997. Byrd Polar Research Centre Report No. 15. The Ohio State University,
Columbus, Ohio, 115–118.
Warren, C.R., Glasser, N.F., Harrison, S., Winchester, V., Kerr, A.R., Rivera, A., 1995.
Characteristics of tide-water calving at Glaciar San Rafael, Chile. J. Glaciol. 41, 273–
289.
Walder, J.S., P. Watts, O.E. Sorensen, & K. Janssen. 2003. Tsunamis generated by
subaerial mass flows. J. Geophys. Res., B5, 2236, doi:10:1029/2001JB00707
Interesting videos of calving
Few of these videos have enough information to deduce distances and scales, however
they can be instructive.
1. http://www.youtube.com/watch?v=F7MIc4FKS_4. A small block slides downward from
the front of an unspecified Alaskan glacier, with good shots of the splash zone and the
waves spreading radially outward from the impact site. Video appears to be taken from a
large boat, situated reasonably far from the calving face.
2. http://www.youtube.com/watch?v=JUutanouX0k. Taken from the front of Kronebreen in
2006, the video shows a double calving event. First a block slides directly downward, and
then it is followed by a rotating block whose base at the water line. A small wave is
created.
3. Three more dramatic videos from an unspecified location in the Antarctic peninsula. All
were filmed aboard the research ship Nathaniel B. Palmer April 23 2007, and all show
the same calving event from different perspectives. A picture of the ship gives a sense of
the scale of the event: http://en.wikipedia.org/wiki/Nathaniel_B._Palmer_(icebreaker).
a) http://www.youtube.com/watch?v=kvLVatnYnIo. The ship appears to be far from the
splash zone, but already early on the waves are peaked and on the verge of breaking. A
prolonged series of calving events causes the splash zone to increase in size.
b) http://www.youtube.com/watch?v=tRgTKAWnJ4M. View to the deck, from indoors.
Now the ship is clearly at the edge of the splash zone. Any observers on deck would have
been in great danger.
c) http://www.youtube.com/watch?v=aDJizpbNZvw. The best view of the calving event,
also showing the reemergence of the largest of the calved blocks.
4. http://www.youtube.com/watch?v=HbUIRELqowg. Another video from the Antarctic
Peninsula, taken from what appears to be a reasonable safe distance from the calving
front, about 1 km or so based on the travel time of the waves. A series of good-sized
waves come onshore, showing the importance of properly securing boats. Note that the
penguins seem to be more alert than the humans to what is about to happen.You can also read