Influence of the oleic phase and co-surfactant addition in non-ionic microemulsified systems
←
→
Page content transcription
If your browser does not render page correctly, please read the page content below
Research, Society and Development, v. 10, n. 2, e58410212902, 2021
 (CC BY 4.0) | ISSN 2525-3409 | DOI: http://dx.doi.org/10.33448/rsd-v10i2.12902

Influence of the oleic phase and co-surfactant addition in non-ionic microemulsified
systems
Influência da fase oleosa e da adição de um cotensoativo em microemulsões não iônicas
Influencia de la fase oleosa y adición de un cosurfactante en microemulsiones no iónicas

 Received: 02/12/2021 | Reviewed: 02/18/2021 | Accept: 02/22/2021 | Published: 02/28/2021

 Fabiola Dias da Silva Curbelo
 ORCID: https://orcid.org/0000-0002-1501-5702
 Universidade Federal da Paraíba, Brazil
 E-mail: fabioladias@yahoo.com
 Alfredo Ismael Curbelo Garnica
 ORCID: https://orcid.org/0000-0001-9600-5110
 Universidade Federal da Paraíba, Brazil
 E-mail: alfredocurbelo@yahoo.com
 Beatriz Sales Cavalcanti Nascimento
 ORCID: https://orcid.org/0000-0001-8232-1729
 Universidade Federal da Paraíba, Brazil
 E-mail: beatrizsaleseq@gmail.com
 Giovanna Lais Rodrigues Leal
 ORCID: https://orcid.org/0000-0003-4037-3066
 Universidade Federal da Paraíba, Brazil
 E-mail: giovannalai1998@hotmail.com
 Tarsila Melo Tertuliano
 ORCID: https://orcid.org/0000-0002-0988-803X
 Universidade Federal da Paraíba, Brazil
 E-mail: tarsilatertuliano@gmail.com
 Raphael Ribeiro da Silva
 ORCID: https://orcid.org/0000-0003-4688-9741
 Universidade Federal da Paraíba, Brazil
 E-mail: ribeiro.rse@gmail.com

 Abstract
 Microemulsion is a thermodynamically stable dispersion consisting of an aqueous and an organic phases, both stabilized
 by surfactant molecules and when in need, co-active surfactant. The nature and structure of these components are
 essential in the formulation of microemulsified systems. For this, the construction of phase diagrams can be a
 fundamental tool to characterize the ideal experimental conditions for the existence and operation of microemulsions.
 Thus, the present work had as objective to obtain a comparison between microemulsions with different compositions
 through the construction of ternary diagrams, aiming to achieve the most stable system. To produce microemulsified
 systems, a non-ionic surfactant (Ultranex NP 60), a co-surfactant (Isopropyl Alcohol), two organic phases (pine oil and
 castor oil) and an aqueous phase (glycerin solution) were used. Also complementing the study, rheological tests of the
 oleic phases were accomplished, as well as their thermogravimetric analysis. The focus of the reached ternary diagrams
 was to find the system with the largest Winsor type IV region (microemulsion). It was verified this region had a
 significant increase by the addition of the co-surfactant in the medium and using a vegetable oil, such as pine oil, since
 it promotes strong surfactant-oil interactions on the interface.
 Keywords: Isopropyl alcohol; Oil vegetable; Ternary diagrams; Microemulsified systems.

 Resumo
 Microemulsão é uma dispersão termodinamicamente estável que consiste em uma fase aquosa e uma fase orgânica,
 ambas estabilizadas por moléculas de tensoativo e, quando necessário, um cotensoativo. A natureza e a estrutura desses
 componentes são essenciais na formulação de sistemas microemulsionados. Para isso, a construção de diagramas de
 fases é uma ferramenta fundamental para caracterizar as condições experimentais ideais para a existência e a operação
 de microemulsões. Assim, o presente trabalho teve como objetivo obter uma comparação entre microemulsões com
 diferentes composições através da construção de diagramas ternários, visando atingir o sistema mais estável. Para a
 produção de sistemas microemulsificados foram utilizados um tensoativo não iônico (Ultranex NP 60), um cotensoativo
 (álcool isopropílico), duas fases orgânicas (óleo de pinho e óleo de mamona) e uma fase aquosa (solução aquosa de
 1
Research, Society and Development, v. 10, n. 2, e58410212902, 2021
 (CC BY 4.0) | ISSN 2525-3409 | DOI: http://dx.doi.org/10.33448/rsd-v10i2.12902

 glicerina). Foram realizados, também, testes reológicos das fases oleicas, bem como sua análise termogravimétrica. O
 foco dos diagramas ternários alcançados foi encontrar o sistema com a maior região de Winsor tipo IV (microemulsão).
 Verificou-se que essa região teve um aumento significativo pela adição do cotensoativo no meio e utilização de um óleo
 vegetal, como o óleo de pinho, por promover fortes interações tensoativo-óleo na interface.
 Palavras-chave: Álcool isopropílico; Óleo vegetal; Diagrama de fase ternário; Microemulsão.

 Resumen
 Microemulsión es una dispersión termodinámicamente estable que consta de una fase acuosa y una fase orgánica, ambas
 estabilizadas por moléculas tensioactivas y, cuando es necesario, un agente coactivo. La naturaleza y la estructura de
 estos componentes son esenciales en la formulación de sistemas de microemulsión. Para ello, la construcción de
 diagramas de fase es una herramienta fundamental para caracterizar las condiciones experimentales ideales para la
 existencia y funcionamiento de microemulsiones. Así, el presente trabajo tuvo como objetivo obtener una comparación
 entre microemulsiones con diferentes composiciones mediante la construcción de diagramas ternarios, con la finalidad
 de alcanzar un sistema más estable. Para la producción de sistemas microemulsificados se utilizó un tensioactivo no
 iónico (Ultranex NP 60), un cotensioactivo (alcohol isopropílico), dos fases orgánicas (aceite de pino y aceite de ricino)
 y una fase acuosa (solución acuosa de glicerina). También se realizaron ensayos reológicos de las fases oleicas, así
 como su análisis termogravimétrico. El enfoque de los diagramas ternarios logrados fue encontrar el sistema con la
 región de Winsor tipo IV más grande (microemulsión). Se encontró que esta región tuvo un aumento significativo
 debido a la adición del cotensioactivo en el medio y al uso de un aceite vegetal, como el aceite de pino, para promover
 interacciones fuertes entre el surfactante y el aceite en la interfaz.
 Palabras clave: Alcohol isopropílico; Aceite vegetal; Diagrama de fase ternaria; Microemulsión.

1. Introduction
 Microemulsions (ME) can be defined as fine dispersions, thermodynamically stable, consisting of an aqueous phase
and an organic phase (usually oleic), both stabilized by surfactant molecules and more, when necessary, co-surfactants (Winsor,
1948; Daltin, 2011; Pietrangeli, & Quintero, 2013; Garnica et al., 2020).
 The surfactant is a type of molecule that has a part with an apolar characteristic linked to another part with a polar
character. Thus, this type of molecule is polar and non-polar at the same time (Formariz, 2004). In association, the addition of
co-surfactants, such as short-chain alcohols (eg., methanol, isopropanol, or n-butanol), in an optimal amount, as well as ideal
levels of salinity, together with the effect of the composition of the oleic phase, may lead to a microemulsion system's greater
capacity of solubilization (Pietrangeli, & Quintero, 2013).
 For the spontaneous formation of microemulsified systems, the interfacial tension must be close to zero. This system
has some advantages such as transparency, high stability, easy preparation, and the ability to minimize the interfacial differences
between water and oil (Thomas, 2004).
 A classification system that defines the various equilibriums existing between the microemulsion and the aqueous and
oleic phases was proposed by Winsor, 1948. Four types of systems were established: 1) Winsor I- It is represented by the balance
between the ME phase and the excess oleic phase; 2) Winsor II- Represents the balance between the ME phase and the excess
aqueous phase; 3) Winsor III- It is characterized by a three-phase system, where the microemulsion is in balance at the same
time with an aqueous and an oil phase; 4) Winsor IV- It is a system in which only the microemulsion phase exists, that is, a
macroscopically monophasic system (Winsor, 1948; Daltin, 2011).
 The nature and structure of the surfactant, co-surfactant and oleic phase are paramount in the formulation of
microemulsified systems. The construction of phase diagrams can be a fundamental tool to characterize in which experimental
conditions the ME exist and in what proportions of the components other structures may be present, allowing to select the region
of the phase diagram that represents the most appropriate condition for the objective of your research (Formariz, 2004).

 2
Research, Society and Development, v. 10, n. 2, e58410212902, 2021
 (CC BY 4.0) | ISSN 2525-3409 | DOI: http://dx.doi.org/10.33448/rsd-v10i2.12902

 No further delay, this work consists of a comparative study of the composition of microemulsions, differentiated by the
organic and surfactant components of their structure, with the objective of finding a more suitable microemulsified system
through the incorporation of a co-active agent in the system.

2. Methodology
 For the construction of the ternary diagrams, the following were used: pine oil or castor oil to compose the oleic phase;
as the aqueous phase, a 1:1 glycerin-water mixture; a Ultranex NP 60 surfactant; in addition to the commercial Isopropyl alcohol
P.A. from the producer Neon as co-surfactant.
 Figures 1-3 show the chemical structures of the main components from the oils (organic phases) used in the experiment.
From castor oil, the Ricinoleic Acid and Ricinoleic Acid Triglyceride (Yeboah, 2020) (Figure 1 and 2), and from pine oil the α-
Terpineol structure (Figure 3).

 Figure 1. Chemical Structure of Ricinoleic Acid.

 Source: PubChem (2020).

 Figure 2. Chemical Structure of Ricinoleic Acid Triglyceride.

 Source: PubChem (2020).

 3
Research, Society and Development, v. 10, n. 2, e58410212902, 2021
 (CC BY 4.0) | ISSN 2525-3409 | DOI: http://dx.doi.org/10.33448/rsd-v10i2.12902

 Figure 3. Chemical Structure of α-terpineol.

 Source: PubChem (2020).

2.1. Obtaining Ternary Diagrams
 For the construction of the diagram, 0.5 g of two components - aqueous phase, oleic phase, or surfactant/co-surfactant
- were used with known mass proportions and added in a test tube. Then, the titration with the third component started, with first
manual agitation in a vortex mixer 2800 rpm, ending in an analog centrifuge Centrilab 80-2B-15 mL, until the appearance of a
permanent uniform region, and then the mass of the third component was determined and, subsequently, the mass fraction.
 Mass fraction calculations are made by the ratio between the mass of each substance, surfactant/co-surfactant, oleic
phase, and aqueous phase, by the mass of the entire system, as shown in Equations 1-3.

 %mT = x 100% (1)

 %mFo = x 100% (2)

 %mFa = x 100% (3)

Where, Mtotal is the total mass of the system; mT the mass of the surfactant/co-surfactant; mFo mass of the oleic phase; and mFa
mass of the aqueous phase.

 With the results of mass percentage of each component, these were plotted in Origin to obtain the ternary diagrams.
This procedure was repeated for different mass proportions of both initial components in order to close the diagram curve.

2.2. Rheology
 The pine and castor oils rheological tests were determined using the Brookfield DVIII Ultra rheometer. The samples
were placed in the rheometer container and subjected to sufficient torque to keep the CPE-52 spindle rotation immersed in the
samples. The rotation range was from zero to 90 rpm, at temperatures from 30 to 70 °C, varying every 10 °C.

 4
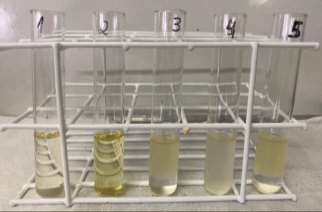
Research, Society and Development, v. 10, n. 2, e58410212902, 2021
 (CC BY 4.0) | ISSN 2525-3409 | DOI: http://dx.doi.org/10.33448/rsd-v10i2.12902

2.3. Thermogravimetric Analysis
 The analyses were performed on a thermogravimetric scale for samples of glycerin, pine and castor oils. The materials
were heated on a TGA Q50 balance initially at 25 ºC (room temperature) to 500 °C with a heating rate of 10 °C/min under an
inert nitrogen atmosphere. Then, the TGA curves of the studied samples were obtained, which relate the loss of continuous mass
with the temperature increase.

3. Results and Discussion
3.1 Ternary Diagrams
 Figure 4 shows the ternary diagrams obtained from the tests using pine oil; the NP 60 surfactant, with (Figure 4.a) and
without (Figure 4.b) isopropyl alcohol (as a co-surfactant), in the C/T = 1.0 mass ratio, in addition to the mixture of water and
glycerin, as an aqueous phase for both cases.
 These diagrams presented two regions according to Winsor's classification: a single-phase microemulsion region (WIV),
and another with two phases (emulsion), microemulsion and excess aqueous phase (WII). It is evident that the addition of the
co-surfactant caused a significant increase in the microemulsion region. This result can be explained since the co-surfactant acts
hydrophilically in the system, together with the surfactant, facilitating the solubilization of the components by reducing the
interfacial tension between the oil and water phases (Daltin, 2011; Ferreira et al., 2020).

 Figure 4. Ternary Diagrams for the Pine Oil System.

 (a) (b)
 Source: Authors.

 Figure 5 shows the 5 points chosen from the phase diagrams with pine oil to show the phases of the region at each
selected point.

 5
Research, Society and Development, v. 10, n. 2, e58410212902, 2021
 (CC BY 4.0) | ISSN 2525-3409 | DOI: http://dx.doi.org/10.33448/rsd-v10i2.12902

 Figure 5. Selected Points of the Ternary Phase Diagrams with Pine Oil.

 Source: Authors.

Table 1 shows the mass fractions of the points shown in Figure 5.

 Table 1. Mass fractions of the points shown in figure 5 of the ternary phase diagram with pine oil.
 Components (G/W, NP60 and isopropyl alcohol,
 Point Aspect Appearance
 pine) (black curve)

 1 85 % T, 8 % FA and 7 % FO limpid

 2 65 % T, 17,5 % FA and 17,5 % FO limpid

 3 20 % T, 40 % FA and 40 % FO turbid

 Point Components (G/W, NP60, pine) (red curve) Aspect Appearance

 4 65 % T, 17,5 % FA and 17,5 % FO turbid

 6
Research, Society and Development, v. 10, n. 2, e58410212902, 2021
 (CC BY 4.0) | ISSN 2525-3409 | DOI: http://dx.doi.org/10.33448/rsd-v10i2.12902

 5 20 % T, 40 % FA and 40 % FO turbid

 Source: Authors.

 The comparative procedure of the co-surfactant influence on the system was repeated using castor oil. However,
initially, for a system with the aqueous phase 1:1 water and glycerin mixture and the use only of the NP 60 surfactant, for the
different components proportions used, the result was mostly emulsion points, disqualifying the identification of a WIV region
for the system.
 The difference between emulsion and microemulsion is not only in thermodynamic stability, but also in the structural
size of the micelle. While the region characterized by microemulsion is microscopically homogeneous composed of a single
phase, the emulsion region has larger size and unstable micelles (Lif, A. & Holmberg, K., 2006).
 Figure 6 shows the ternary diagrams obtained for the tests with castor oil; next to the surfactant NP 60, with (Fig. 6.a)
and without (Fig. 6.b) isopropyl alcohol (as co-surfactant) in the C / T = 1.0 mass ratio; in addition to, for both cases, the same
aqueous phase previously used with pine oil. The WIV microemulsion region is visible in the first case, in contrast to the castor
oil system using only the NP 60 surfactant, but it is much smaller when compared to the system in figure 4 with pine oil.

 Figure 6. Ternary Diagrams for the Castor Oil System.

 (a) (b)
 Source: Authors.

 Figure 7 shows the 5 points chosen from the phase diagrams with castor oil to show the phases of the region at each
selected point.

 7
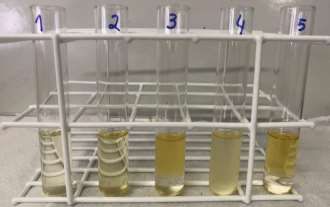
Research, Society and Development, v. 10, n. 2, e58410212902, 2021
 (CC BY 4.0) | ISSN 2525-3409 | DOI: http://dx.doi.org/10.33448/rsd-v10i2.12902

 Figure 7. Selected Points of the Ternary Phase Diagrams with Castor Oil.

 Source: Authors.

Table 2 shows the mass fractions of the points shown in Figure 7.

 Table 2. Mass fractions of the points shown in figure 7 of the ternary phase diagram with castor oil.

 Components (G/W, NP60 and isopropyl
 Point Aspect Appearance
 alcohol, castor) (green curve)

 1 85 % T, 8 % FA and 7 % FO limpid

 2 65 % T, 17,5 % FA and 17,5 % FO limpid

 3 20 % T, 40 % FA and 40 % FO turbid

 Components (G/W, NP60, castor)
 Point Aspect Appearance
 (brown curve)

 8
Research, Society and Development, v. 10, n. 2, e58410212902, 2021
 (CC BY 4.0) | ISSN 2525-3409 | DOI: http://dx.doi.org/10.33448/rsd-v10i2.12902

 4 65 % T, 17,5 % FA and 17,5 % FO turbid

 5 20 % T, 40 % FA and 40 % FO turbid

 Source: Authors.

 Castor oil is obtained from the seed of Ricinus communis plant and has atypical chemical characteristics when compared
to most vegetable oils, because in addition to the presence of the ricinoleic acid triglyceride, which is an unusual hydroxylated
fatty acid in vegetable oils, this acid is present in a range of 84.0% to 91.0% of its composition (Cangemi et al., 2010). The
molecular structures of ricinoleic acid and ricinoleic acid triglyceride are shown in Figures 1 and 2 in Section 2.1.
 Pine oil is the essential oil of pine tree and has in its composition a variety of terpenes, the main component being the
alpha-Terpineol (Cangemi et. al, 2010; Huang et al., 2016), whose structure is shown in Figure 3 in Section 2.1.
 The largest microemulsion WIV region found by the use of pine oil is possibly due to the fact that oil molecules with
small molecular volume (short chain hydrocarbon) or high polarity (increased aromaticity), promote surfactant-oil strong
solvation effects on the interface. In contrast, the increase in the length of the oil chain, as in the case of castor one, leads to a
reduction in the interactions between the microdroplets, decreasing the solubilization of the microemulsion (Leung & Shah,
1987; Garnica et al., 2020).

3.2 Oleic Phase Rheology
 The results of viscosity (cP) as a function of the shear rate (s-1) for both oils are shown in Figures 8 and 9.

 9
Research, Society and Development, v. 10, n. 2, e58410212902, 2021
 (CC BY 4.0) | ISSN 2525-3409 | DOI: http://dx.doi.org/10.33448/rsd-v10i2.12902

 Figure 8. Viscosity curves to Pine Oil.

 12

 10
 30°C
 8
 Viscosity (cP)

 40°C

 50°C
 6
 60°C

 4 70°C

 2

 0
 0 50 100 150 200 250
 Shear Rate (s-1)

 Source: Authors.

 Figure 9. Viscosity curves to Castor Oil.

 350

 300

 250
 Viscosity (cP)

 30°C

 200 40°C

 50°C
 150
 60°C

 100 70°C

 50

 0
 0 20 40 60 80 100 120
 Shear Rate (s-1)

 Source: Authors.

The results of shear stress (D/cm2) as a function of the shear rate (s-1) for both oils are shown in Figures 10 and 11.

 10
Research, Society and Development, v. 10, n. 2, e58410212902, 2021
 (CC BY 4.0) | ISSN 2525-3409 | DOI: http://dx.doi.org/10.33448/rsd-v10i2.12902

 Figure 10. Flow curves to Pine Oil.

 25

 20
 Shear Stress (D/cm²)

 30°C
 15 40°C

 50°C

 10 60°C

 70°C

 5

 0
 0 50 100 150 200

 Shear Rate (s-1)

 Source: Authors.

 Figure 11. Flow curves to Castor Oil.

 200
 180
 160 30°C
 140
Shear Stress (D/cm²)

 40°C
 120
 50°C
 100
 60°C
 80
 70°C
 60
 40
 20
 0
 0 20 40 60 80 100 120

 Shear Rate (s-1)

 Source: Authors.

 11
Research, Society and Development, v. 10, n. 2, e58410212902, 2021
 (CC BY 4.0) | ISSN 2525-3409 | DOI: http://dx.doi.org/10.33448/rsd-v10i2.12902

 According to the data presented in Figures 8 to 11, it was possible to classify pine and castor oils as Newtonian fluids
at all temperatures evaluated (30, 40, 50, 60 and 70 °C).
 Newtonian fluids are characterized by the proportionality between shear stress and shear rate, so their viscosity is unique
and absolute for a given temperature, not depending on the speed gradient (Machado, 2002). In addition, it was possible to
observe that the viscosity is strongly influenced by the temperature, because with the increase of the temperature, the viscosity
decreased, since the molecules agitation in a disordered way increases the distance between the adjacent micelles.

3.3 Thermogravimetric Analysis
 Figure 12 shows the curves obtained by thermogravimetric analyzes of glycerin, pine and castor oils. In the graphs, it
is possible to highlight the phenomenon of mass loss and relate it to their respective temperatures.

 Figure 12. Thermogravimetric Curve for glycerol, pine oil and castor oil.

 120
 Castor Oil
 Pine Oil
 100 Glycerol

 80
 Weight loss (%)

 60

 40

 20

 0
 0 100 200 300 400 500 600
 Temperature (°C )

 Source: Authors.

 The difference in levels that appear between castor oil and the other organic materials for all temperatures is linked to
its large carbon chain, having only a small fraction that decomposes at temperatures below 350 ºC (Howell & Ostrander, 2019).

4. Conclusion
 The test results suggest that the addition of the Isopropyl alcohol co-surfactant to the NP 60 ethoxylated noniphenol
surfactant was positive for obtaining larger microemulsion regions, regardless of the other components. Not less important, pine
oil, in turn, showed better adherence than castor oil as an organic phase due to the large molecular volume of the latter, which
makes it less reactive. In addition, pine oil is a low-cost and easily degradable vegetable oil. Therefore, the 1:1 glycerin and
water mixture, pine oil, NP 60 and Isopropyl alcohol system presented the best classification for the consequent formulation of
oil drilling fluids.
 12
Research, Society and Development, v. 10, n. 2, e58410212902, 2021
 (CC BY 4.0) | ISSN 2525-3409 | DOI: http://dx.doi.org/10.33448/rsd-v10i2.12902

 Still, it is clear the microemulsion region is more dependent on the structure of the surfactant, the co-surfactant and the
C/S ratio than on the structure of the oleic phase. Moreover, according to the diagrams elaborated, future work may be done,
varying the C/S ratio, the co-surfactant and the surfactant, including adsorption extension analyzes for surfactants since a more
adsorbed one allows better oil recovery factor.

Acknowledgments
 This work was performed at Petroleum Laboratory (LaPet), Department of Chemical Engineering, Federal University
of Paraiba (UFPB). The authors thank to PIBIC/CNPq/UFPB and CNPq/DT2 for financial support.

References
Cangemi, J. M., Santos, A. M., & Neto, S. C. (2010). A Revolução Verde da Mamona. Química Nova Na Escola: Química e Sociedade, 32 (1).

Daltin, D. (2011). Tensoativos: Química, Propriedades E Aplicações. Blucher.

Ferreira, G. F. D. (2015). Determinação de sistemas microemulsionados para aplicação na indústria de petróleo. Congresso Nacional de Engenharia de Petróleo,
Gás Natural e Biocombustíveis. Campina Grande (PB), Editora Relize.

Formariz, T. P., Wanczinski, B. J., Júnior-Silva, A. A., Scarpa, M. V., & Oliveira, A. G. (2004). Biotecnologia de sistemas coloidais aplicável na otimização do
efeito terapêutico de fármacos usados no tratamento do câncer. Infarma, Brasília, 16 (1), 44-57.

Garnica, A. I. C., Curbelo, F. D. S., Queiroz, I. X., Araújo. E. A., Sousa, R. P. F., Paiva, E. M., Braga, G. S., & Araújo, E. A. (2020). Desenvolvimento de
microemulsões como aditivo lubrificante em fluido de perfuração, Research, Society and Development, 9(7), e212973703.

Howell, B. A., & Ostrander, E. A. (2019). Thermal degradation of flame-retardant compounds derived from castor oil. Journal of Thermal Analysis and
Calorimetry, 138, 3961–3975. https://doi.org/10.1007/s10973-019-08355-w

Huang, H., Teng, W., Liu, Q., Zhou, C., Wang, Q., & Wang, X. (2016). Combustion performance and emission characteristics of a diesel engine under low-
temperature combustion of pine oil–diesel blends. Energy Conversion and Management, 128, 317-326. http://dx.doi.org/10.1016/j.enconman.2016.09.090

Leung, R., & Shah, D. O. (1987). Solubilization and Phase Equilibria of Water-In-Oil Microemulsion. Journal of colloid and interface science, 12, 321-329.
https://doi.org/10.1016/0021-9797(87)90360-2

Lif, A. & Holmberg, K. (2006). Water-In- Diesel Emulsions and Related Systems. Advances in Colloid and Interface Science, 231–239.
https://doi.org/10.1016/j.cis.2006.05.004

Machado, J. C. V. (2002). Reologia e escoamento de fluidos: ênfase na indústria do petróleo. Interciência.

Pietrangeli, G. & Quintero, L. (2013). Enhanced Oil Solubilization Using Microemulsion With Linkers. SPE International Symposium on Oilfield Chemistry,
SPE 164131, 8-10. https://doi.org/10.2118/164131-MS

Thomas, J. E. (2001). Fundamentos da Engenharia de Petróleo. Interciência: Petrobras.

Winsor, P. A. (1948). Hidrotody, solubilization, and related emulsification processes. Transactions of the Faraday Society, 44(1), 376-398.
https://doi.org/10.1039/TF9484400376

Yeboah, A. et al. (2020). Castor oil (Ricinus communis): a review on the chemical composition and physicochemical properties. Food Science and Technology,
1 – 15. http://dx.doi.org/10.1590/fst.19620

Zeng, W. C., Zhang, Z., Gao, H., Jia, L. R., & He, Q. (2012). Chemical composition, antioxidant, and antimicrobial activities of essential oil from pine needle
(Cedrus Deodara). Journal of food science, 77(7), C824 - C829. https://doi.org/10.1111/j.1750-3841.2012.02767.x

 13
You can also read