(SALUD) MasterMind. cCBT. Aragón Healthcare Service - mafeip
←
→
Page content transcription
If your browser does not render page correctly, please read the page content below
Support Services for the Management and Utilization of
 Monitoring and Assessment of the EIP ‐ MAFEIP Tool

                  MasterMind. cCBT.
        Aragón Healthcare Service
                (SALUD)
                                     Authors:
Modesto Sierra, Rosana Angles, Juan Coll Clavero, Clara Faulí, Ruth Vilar, Strahil Birov,
                  Veli Stroetmann, Francisco Lupiáñez‐Villanueva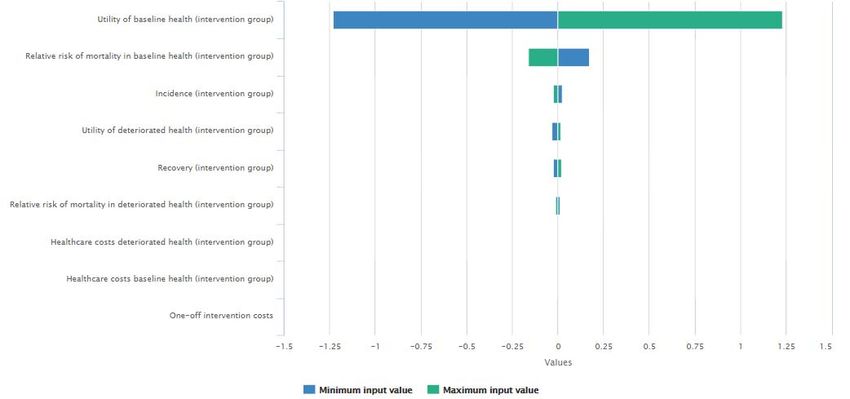
http://mafeip.eu
                                                                                                      info@mafeip.eu

                                           Executive summary
Description of the intervention
The MasterMind1 project aimed at making high quality treatment for depression more widely
available for adults suffering from the illness through the use of ICT. This analysis focuses on the
pilot of one of the services (cCBT) in the site of the Aragón Healthcare Service (SALUD), the public
healthcare provider for the Aragonese region. The age of the participants in the Aragón pilot
ranged from 19 to 74 years old and it included both females (73%) and males (27%). During the
period of the intervention participants had one face‐to‐face training session and several online
sessions (the plan was 8 online sessions, but not all participants completed them). The evaluation
used a one‐group pre‐trial‐post‐trial study design and it followed the dimensions of the Model
for ASessment of Telemedicine (MAST) (Kidholm et al., 2012)2.

Model input
Defining the health states and the transition probabilities
The baseline health state is defined as having no symptoms of depression, and the deteriorate
state as having symptoms of depression (either mild, moderate, or severe). All but one of the
participants that completed at least 50% of the sessions had symptoms before the
implementation of the intervention. Nonetheless, 73% of them had recovered at the end of the
pilot. This percentage is the recovery rate for the intervention group. The recovery rate for the
control group (29%) is obtained from trials that assess the effect of medication in the treatment
of depression during a similar period (Table 1). We use the same incidence rate for the control
and the intervention group because the intervention’s target is to cure those that have
depression, not to prevent new cases. This value (3%) was also obtained from the scientific
literature, as well as the relative risk (RR) of mortality for the deteriorated health states (1.92).
(Table 1).

Computing the costs
Table 1 also displays the costs directly related to the intervention. On the one hand, these refer
to the implementation cost that Aragón incurred at the beginning of the intervention (ICT
infrastructure, subcontracting, development, and training for professionals), which amount to
95,348€. These are divided by the number of patients (133), and the expected years of life of the
infrastructure (5). On the other hand, the costs of the programme per patient are estimated to
be 60€. This comprises 46€ of direct costs, plus 14€ of overheads. Since this cost only affects
patients in the deteriorated state, we add them under healthcare costs, because this section
allows to differentiate between baseline and deteriorated health states.
Healthcare costs refer to resource use within the healthcare system. They are obtained from a
study focusing on the remission of the major depressive disorder in Spain (Sicras‐Mainar et al.,
2012). In this study, healthcare costs for patients in remission (baseline state) were estimated to
be 451€ and for those not in remission (deteriorated state) 826€. A similar project, Caring Me,
provided a CBT therapy through a virtual platform that consisted of 12 sessions, and estimated

1https://mastermind‐project.eu/
2Kidholm, K., Pedersen, C. D., Jensen, L. K., Ekeland, A. G., Bowes, A., Flottorp, S., & Bech, M. (2012). A model for
assessment of telemedicine applications – MAST. International Journal of Technology Assessment in Health Care,
28(1), 44–51.

                                                                                                                        2
http://mafeip.eu
                                                                                     info@mafeip.eu

that the intervention reduced healthcare costs by 51%. From here we obtain the healthcare costs
for the intervention group and deteriorated state (635€), to which we add the costs of the
programme per patient to get the final number of 695€. The societal costs also come from Sicras‐
Mainar et al. (2012) and the project Caring Me (Table 1).

Utility
To calculate utility we used the variable Satisfaction with life3, which was collected during the
MasterMind project using a 7‐point Likert scale. The values were then mapped into the 0‐1 range.
The utility in the baseline health scenario was computed as the average satisfaction with life of
those that had no symptoms after the pilot, for both the control and intervention groups. The
utility for the deteriorated state in the intervention group, is the average utility of those that had
depressive symptoms after the pilot. Finally, the average utility of the whole sample before the
intervention started is the value for the control group’s deteriorated state (Table 1).
                          Table 1. Input data used to populate the MAFEIP model
                                                             Control Group     Intervention Group
    Transition Probabilities
                                                 Incidence       3%                  3%
                                                  Recovery       29 %                73 %
    Relative Risk
                                           Baseline State        1.00                 1.00
                                       Deteriorated State        1.92                 1.92
    Costs
                 One‐off cost per patient (Intervention)           ‐                 143 €
          Recurring cost per patient/year (Intervention)           ‐                   ‐
                             Healthcare cost – Baseline          451 €               451 €
                         Healthcare cost – Deteriorated          826 €               695 €
                                 Societal cost – Baseline       1,442 €              533 €
                            Societal cost – Deteriorated        2,668 €              848 €
    Utility
                                           Baseline State        0.57                 0.57
                                      Deteriorated State         0.39                 0.33

Model output
Figure 1 shows the overall impact of the intervention on the costs and effects of the whole target
population. The incremental cost‐effectiveness ratio (ICER) is placed in the dominant quadrant
(lower‐right), implying that the solution is always cost‐effective (it is both cheaper and more
effective than usual care).

3   How satisfied are you with your life as a whole today?

                                                                                                    3
http://mafeip.eu
                               info@mafeip.eu

Figure 1. Cost‐effectiveness

                                             4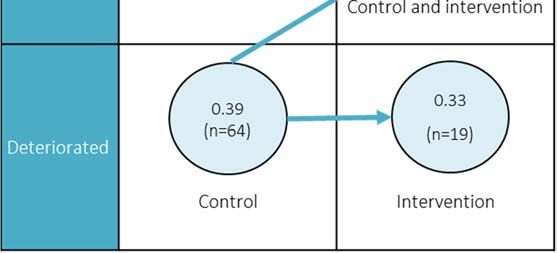
http://mafeip.eu
                                                                                                       info@mafeip.eu

1. Description of the intervention
MasterMind4 was an EU project that aimed at making high quality treatment for depression more
widely available for adults suffering from the illness through the use of ICT. Depression is one of
the most prevalent mental disorders worldwide and it is associated with a high disease burden,
elevated economic and societal costs, and premature death (Ferrari et al., 2013; Kessler, 2007;
Wittchen et al., 2011). Moreover, despite the availability of effective treatments, the number of
people that actually receive treatment for depressive disorders is not optimal. In this context, the
use of ICT could improve feasibility in general practice, where the volume of patients is high, and
it is essential that interventions are brief and practical.
MasterMind tested two services: cCBT (Guided cCBT for treatment of depression) and cCVC
(Video conference for Collaborative Care and treatment of depression), in fifteen pilot sites. This
analysis focuses on the cCBT pilot in the Aragón Healthcare Service (SALUD), the public healthcare
provider for the Aragonese region (47,719 km², 1.3m inhabitants). Specifically, the MasterMind
services were piloted at five out of the 15 healthcare centres, and at the Mental Healthcare Unit
of Barbastro Healthcare Sector5 (8,500 km2, 107,428 inhabitants). The prevalence of depression
in this region was estimated to be 4%, thus the potential target for the services is 4,297 people.
The adapted cCBT programme to the four Spanish organisations participating in Mastermind is
composed by a set of 8 modules formed by multimedia materials and questionnaires and it is
called Supera tu depresión (Overcome your depression). Each region adapted these contents to
its local Information Systems.
The service is targeted at patients aged 18 or older diagnosed with depression. The age of the
participants in the Aragón pilot ranged from 19 to 74 years old and it included both females (73%)
and males (27%). Recruitment was performed by both the GPs at the Primary Care centres and
by the professionals (psychologists and psychiatrists) at the Mental Health Unit. During the period
of the intervention participants had one face‐to‐face training session and several online sessions
(the plan was 8 online sessions, but not all participants completed them). One nurse was in charge
of the training and follow up of patients during the intervention period. The follow up included
the monitoring of the patient activity and also of the alarms and alerts generated by this activity.
During the period of inclusion of patients within the programme, the nurse, taking into account
the inputs she received from the patient through the tool, could decide to phone the patient
and/or to refer him/her to the specialist if further attention was needed. The programme also
included a telephone call at the end and one at session 4 depending on the degree of adherence.
The evaluation used a one‐group pre‐trial‐post‐trial study design and it followed the dimensions
of the Model for ASessment of Telemedicine (MAST) (Kidholm et al., 2012)6. The study period for
intervention started in October 2015 and ended in April 2017.
Regarding the current care situation7, in the Aragón Healthcare Service (SALUD) the primary care
professionals at the Primary Care Centres have the first and closest contact with the patients.
They do the first diagnosis, and normally treat mild to moderate depression. This treatment might
include an anti‐depressants prescription. When there is a patient profile with more complex
needs and/or the symptoms are more severe, the GP might decide to contact the Mental

4 https://mastermind‐project.eu/
5 http://sectorbarbastro.salud.aragon.es/en/
6 Kidholm, K., Pedersen, C. D., Jensen, L. K., Ekeland, A. G., Bowes, A., Flottorp, S., & Bech, M. (2012). A model for

assessment of telemedicine applications – MAST. International Journal of Technology Assessment in Health Care,
28(1), 44–51.
7 This is without the MasterMind intervention.

                                                                                                                         5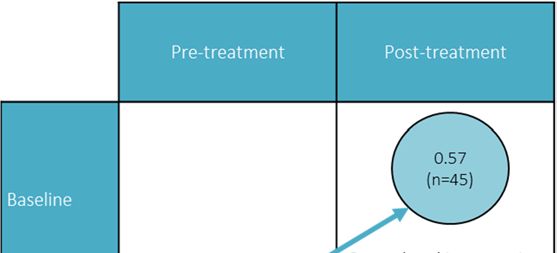
http://mafeip.eu
                                                                               info@mafeip.eu

HealthCare. The frequency and the type of interaction depends very much on the GP's workload
and on his/her training and experience in the treatment of mental health disorders. There was
no previous experience in the area and organisation in the use of cCBT, nor in mental health
technology‐related projects. Therefore, a stepped approach was used, starting within the Mental
Health Care Unit and then spreading to Primary Care Centres.

                                                                                             6
http://mafeip.eu
info@mafeip.eu
2. Model input
2.1. Defining the health states and the transition probabilities
In the MasterMind project, each pilot measured the symptoms of depression using their routine
practice diagnostic procedures (e.g. PHQ‐9, BDI, etc.). According to this, participants were
classified in 5 categories: 1 = No symptoms are experienced, 2 = Symptoms are mild, 3 =
Symptoms are moderate, 4 = Symptoms are severe, 5= Symptoms are very severe. In the context
of MAFEIP, the category of no symptoms represents the baseline health and the rest (i.e. having
symptoms of a Major Depressive Disorder) the deteriorated state.
In Aragón, 133 patients started the intervention. However, only 63 completed at least 50% of the
sessions and are therefore included in this analysis. Among them, only one was in baseline health
before the MasterMind pilots started. Among those that were in the deteriorated state, 45
showed no symptoms of depression after the treatment. Thus, the recovery rate is 73%.
The remaining patients abandoned the programme without completing at least 50% of the
sessions and are not included in the analysis because there is no post‐intervention data available
from them. If we had taken into account the whole set of patients who started the intervention
and we had considered as in baseline state after treatment only those patients from whom we
have registered data, the recovery rate would have been 33.83%. We have chosen this approach
because we do not have evidence for these patients who abandoned the programme, we do not
know their reasons for discontinuation and because the effects of the intervention are not
considered to be relevant in their evolution due to the short percentage of completion (http://mafeip.eu
info@mafeip.eu
The risk for mortality should be a bit higher than for the general population because unipolar
depression is associated with premature death. For instance, people with major depression and
schizophrenia have a 40% to 60% greater chance of dying prematurely than the general
population, due to physical health problems left unattended and suicide (WHO, 2013)12. In fact,
Baxter, Page, & Whiteford (2011)13 conducted a systematic review and meta‐analysis of excess
mortality in population‐based studies of clinically defined depression and concluded that there is
a significantly higher risk of mortality for major depression, with an estimated relative risk (RR) of
1.92. This is the value that we use in the present exercise for the deteriorated health state in both
the intervention and control groups. We use the same value for both groups because reducing
suicides was not the main objective of the intervention, and because it is not possible to
demonstrate whether the MasterMind service reduced this risk. For the baseline we keep the
default value of 1, since people in this state do not have depressive symptoms.
2.2. Computing the costs
The one‐off costs to implement the MasterMind services include ICT infrastructure,
subcontracting, development, and training for professionals. The Spanish cluster in MasterMind
(comprising the Spanish partners of the project) developed (based on previous experiences) the
cCBT intervention content, which was called Supera tu Depresión (Get Over your Depression).
This brought higher implementation costs, but avoided paying a 200€ licence per patient to a
third provider. The one‐off implementation costs amounted to 95,348€, which divided by the
number of patients (133) gives a cost of 717€ per person. Since it is estimated that this investment
would be useable for approximately 5 years, this amount is divided by 5 (143€). On the other
hand, it must be noted that with this investment it could be possible to support a larger number
of patients, thus, these costs may be overestimated.
Table 2. Intervention costs
Intervention costs (per patient)
Implementation costs (ICT infrastructure, subcontracting, development, and training for
143
professionals) (one‐off)
The costs of the programme per patient are estimated to be 60€. This comprises 46€ of direct
costs, which refer to personnel costs (nurses in charge of providing training to patients, patients’
follow up and monitoring alarms; technicians providing technical support; and GP or psychologist
who performs an evaluation), and 14€ of overheads. This cost only affects patients in the
deteriorated state, because the intervention is aimed at those having depressive symptoms.
However, the current version of the MAFEIP tool does not allow to differentiate between states
when inputting the intervention costs. For this reason, we add this value under healthcare costs
(Table 3) because this section allows to differentiate between baseline and deteriorated health
states.
The programme is only applied once per patient. If this person recovers, the treatment is no
longer needed; if the patient does not recover, he/she moves back to usual care (it means that
this kind of treatment is not suitable for this specific individual). However, in the MAFEIP tool
patients cannot move from the intervention to usual care. Thus, patients in intervention that do
not recover remain in the intervention’s deteriorated state, and the costs of the programme and
12 WHO. (2013). Mental Health Action Plan 2013‐2020. Geneva. Retrieved from
http://apps.who.int/iris/bitstream/10665/89966/1/9789241506021_eng.pdf
13 Baxter, A. J., Page, A., & Whiteford, H. A. (2011). Factors influencing risk of premature mortality in community
cases of depression: A meta‐analytic review. Epidemiology Research International, 2011, 1–12.
8http://mafeip.eu
info@mafeip.eu
the intervention’s recovery rate are applied to them (instead, they should have no costs related
to the programme and the control group’s recovery rate, because they are no longer following
the intervention). Nevertheless, since the recovery rate is high (73%), this only affects a reduced
amount of people.
Healthcare costs refer to resource use within the healthcare system in each situation, usual care
and intervention, such as the cost of consultations, hospitalisation costs, cost of medication, etc.
However, MasterMind did not compute healthcare costs. Nonetheless, a study focusing on the
remission of the major depressive disorder in Spain (Sicras‐Mainar et al., 2012) estimated these
costs per person and year. It calculated healthcare costs (e.g. physician visits, hospitalisations,
pharmaceuticals, etc.) and indirect costs associated with patients' production losses due to sick
leave. These costs were calculated for patients that were in remission and for those that were
not. Healthcare costs for patients in remission (baseline state) were estimated to be 451€ and for
those not in remission (deteriorated state) 826€.
A similar project, Caring Me14, provided a CBT therapy through a virtual platform that consisted
of 12 sessions. The project calculated the average healthcare costs during the intervention per
patient. They estimated that the intervention reduced healthcare costs15 by 51%. Mastermind
would probably have a similar impact. We apply this reduction (51%) to the difference between
the healthcare costs for patients in remission and those not in remission (375€). As a result, we
get that the healthcare costs for the intervention are 635€, value that we input to the
deteriorated state. We add to this, the annual intervention costs estimated above (60€). Thus,
the final value is 695€. In the baseline state, we input the same value than for the control group,
because since they have recovered, the intervention no longer applies to them.
Table 3. Healthcare Costs (per patient and year in €)
Control Group baseline health 451
Control Group deteriorated health 826
Intervention Group baseline health 451
Intervention Group deteriorated health 695
The societal costs add the costs outside the healthcare sector (time spent using the new service,
time spent travelling for patients and caregivers, travel costs for patients and caregivers, time
spent by patients in consultation, time spent in caregiving tasks by informal caregiver, etc.). As
mentioned above, Sicras‐Mainar et al. (2012) estimated the costs due to loss of labour
productivity. Their estimates were 991€ for patients in remission and 1,842€ for those not in
remission. On the other hand, Caring Me estimated that the losses due to sick leaves had
diminished by 91.7% after the intervention. Assuming the same impact for MasterMind, gives a
cost for the intervention group of 82€ and 153€ for the baseline and deteriorated states
respectively. These costs are added to the healthcare costs (Table 4).
14http://www.caring‐me.com/
15This was composed of primary care costs (consultations, tests, medication, etc.) and specialised care costs (days in
hospital, consultations, emergency care).
9http://mafeip.eu
info@mafeip.eu
Table 4. Societal Costs (per patient and year in €)
Control Group baseline health
Cost of sick leave 991
Healthcare costs 451
TOTAL 1,442
Control Group deteriorated health
Cost of sick leave 1,842
Healthcare costs 826
TOTAL 2,668
Intervention Group baseline health
Cost of sick leave 82
Healthcare costs 451
TOTAL 533
Intervention Group deteriorated health
Cost of sick leave 153
Healthcare costs 695
TOTAL 848
2.3. Utility
MAFEIP recommends using the EQ‐5D to calculate utility, but MasterMind did not use this
questionnaire. However, it collected the variables Satisfaction with life16 and satisfaction with
mental health17 using a 7‐point Likert scale, before and after treatment. The values in the 7‐point
Likert scale were mapped into a 0‐1 range18. The utility in the baseline health scenario was
computed as the average satisfaction with life of those that had no symptoms after the pilot,
0.57. We input the same value both for the control and intervention19 (Figure 2). On the other
hand, the utility for the deteriorated state in the intervention group, is the average utility of those
that had depressive symptoms after the pilot, 0.33. Finally, the average utility of the whole sample
before the intervention started is the value that we use for the control group’s deteriorated state
(0.39), since all participants had depressive symptoms20 before the implementation of the cCBT
service (Table 5).
16 How satisfied are you with your life as a whole today?
17 How satisfied are you with your mental health?
18 Using the formula: X = (x ‐ 1) / 6
19 This implies assuming that the utility of patients once they have recovered is the same regardless of the treatment
followed (cCBT or usual care)
20 The one that did not have symptoms is not included
10http://mafeip.eu
info@mafeip.eu
Figure 2. Calculation of utility
Table 5. Utility
Control Intervention
Baseline 0.57 0.57
Deteriorated 0.39 0.33
3. Model output
The figure below shows the incremental costs by age. We see that costs are negative (meaning
that the intervention is cheaper than the current option) for all age groups except for the older
population (Figure 3). If we use the societal costs (i.e. including the effects of sick leave), savings
are higher and the intervention is cheaper than usual care for all age groups. The incremental
effects by age are positive, although small (Figure 5). The incremental cost‐effectiveness ratio
(ICER) is placed in the dominant quadrant (lower‐right), implying that the solution is always cost‐
effective (it is both cheaper and more effective than usual care) (Figure 6).
Figure 3. Incremental cost by age
11http://mafeip.eu
info@mafeip.eu
Figure 4. Incremental cost by age (societal costs)
Figure 5. Incremental effects by age
Figure 6. Cost‐effectiveness plane (healthcare costs)
The following figures show the cumulative incremental costs and effects over time. The target
population is 4,297, the inhabitants of the area covered by the healthcare centres of the Aragón
Healthcare Service in the Barbastro Healthcare Area, multiplied by the prevalence of depression
in the region (4%).
12http://mafeip.eu
info@mafeip.eu
Figure 7. Cumulative incremental costs
Figure 8. Cumulative incremental effects
The following figures display the expected transition between states for one specific person (in
this case a 20 year old male). The population has a high probability of staying in the baseline
health state, due to the fact that incidence is low (3%). Moreover, this probability is higher in
intervention, since the recovery rate is larger. The probability of dying remains low until the last
decades, and it is slightly higher for current care.
Figure 9. Patient flow through model states (Alive states)
13http://mafeip.eu
info@mafeip.eu
Figure 10. Patient flow through model states (Dead state)
The sensitivity analysis allows us to assess how the output varies when one parameter changes.
First, we apply the range of recovery rates for the control group found in the literature (23‐42%).
We can see that if the recovery rate for the control group was better, the intervention’s effects
and savings would decline a bit, but the ICER would remain in the dominant quadrant (Figure 11).
Second, we apply a wide range for the recovery rate of the intervention group, from 34% to 73%.
The first value is the minimum recovery rate for the MasterMind intervention, because it assumes
that none of the participants who dropped‐out has recovered. The second is the one used in the
model. The results show that if the recovery rate was much lower, the ICER could move above
the willingness to pay threshold, implying that the solution would not be cost‐effective (Figure
12).
On the other hand, Figure 12. Univariate sensitivity analysis with a change in the recovery rate
for the intervention group
Figure 13 shows what would happen if the MasterMind intervention decreased healthcare costs
by a smaller amount than Caring Me, concretely by 25%, which would increase the costs from
695€ to 792€. In this case, the incremental costs would be only slightly higher, and the ICER
would remain practically at the same point.
14http://mafeip.eu
info@mafeip.eu
Figure 11. Univariate sensitivity analysis with a change in the recovery rate for the control
group
15http://mafeip.eu
info@mafeip.eu
Figure 12. Univariate sensitivity analysis with a change in the recovery rate for the
intervention group
Figure 13. Univariate sensitivity analysis with a change in the healthcare costs in
deteriorated health for the intervention group
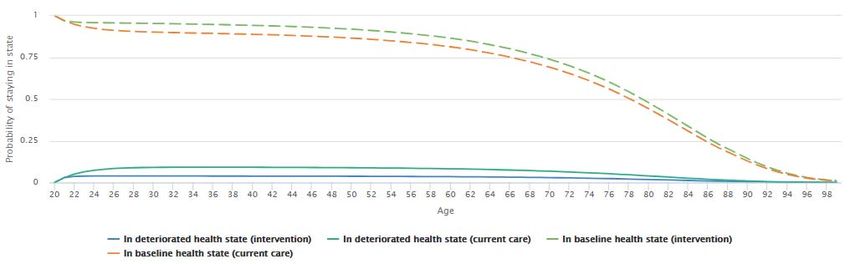
The figures below show how a change in some relevant parameters affect the incremental costs
(Figure 14) and the incremental effects (Figure 15), when applying a ±10% change in each of them.
The baseline healthcare costs in intervention are the ones that have a greater impact on costs.
On the other hand, the utility in baseline is clearly the parameter that has a higher impact on
effects.
16http://mafeip.eu
info@mafeip.eu
Figure 14. Parameter impact on incremental costs
Figure 15. Parameter impact on incremental effects
17http://mafeip.eu
info@mafeip.eu
4. Lessons learned
This section summarises the main difficulties we have encountered in adapting the intervention
performed in MasterMind to the Markov model used in MAFEIP. These difficulties are detailed
below:
The fact that the project did not include a control group posed some difficulties, since
MAFEIP is based on the comparison between a control group and an intervention group.
This was addressed by exploring the scientific literature and extracting from there
parameters that could be applied to MAFEIP.
The section on the periodic costs of the intervention does not differentiate between
baseline and deteriorated health state. In MasterMind this difference is important, since
those that do not have symptoms (baseline state) do not follow the treatment. This was
addressed by including these costs under the healthcare costs of the deteriorated state.
However, it would be better if they could be entered separately, since they refer to
different concepts.
In the MAFEIP simulation all participants start in the baseline state. However, in the
MasterMind pilot, patients started in the deteriorated state (because they were all
suffering from depression). Also, this does not adjust to reality, because when the
intervention started there were people already having depressive symptoms in the
region.
It could be useful to apply a temporal limit to the simulation, because the intervention
might have a specific duration (e.g. 10 or 20 years).
The intervention did not last one year but 3‐4 months. In the simulation, it is assumed
that the programme is applied once per year, in order to adjust this to the transition
probabilities.
The intervention is only applied once per patient (if they do not recover, they go back to
usual care). It is not possible to include this option in the MAFEIP tool. However, it would
be possible to model if the tool included four states. These states would be baseline,
deteriorated, not recovered, and death. Patients who do not recover after the
intervention would move from deteriorated to not recovered. In this state, healthcare
costs would be the ones associated with depression, intervention costs would not be
applicable, and the recovery rate would be the one for people with depression following
treatment as usual. In fact, the parameters of the not recovered in intervention would be
the same than for those in the control group that are in the deteriorated state.
The clinical evolution of the patients in the MasterMind final assessment was evaluated
through the analysis of the level of severity of symptoms obtained from questionnaires
performed at the beginning and at the end of the intervention. The scale used was:
having no symptoms, having mild, moderate, severe and very severe symptoms. 56% of
Patients included reduced their symptoms in one category and 31.3% reduced their
symptoms in two categories (e.g. from moderate to no symptoms). The reduction of
symptoms does not imply a change of state in the MAFEIP model, but it is relevant for
the analysis of results.
The cost analysis should differentiate between the pilot phase and the deployment
phase. The one‐off costs invested in MasterMind could be enough to support a higher
number of patients than those recruited during the pilot phase.
18http://mafeip.eu
info@mafeip.eu
The MAFEIP tool does not allow to include new patients that start the intervention in
future cycles.
The analysis corresponds to a pilot oriented to evaluate the service with a small number
of patients. Deployment into routine care might arise different results, especially because
the one‐off costs could involve a larger number of patients.
These lessons learned can be applied for the further development of the MAFEIP tool.
19You can also read