Process Analysis of Reimbursement Process through Process Mining techniques.
←
→
Page content transcription
If your browser does not render page correctly, please read the page content below
Process Analysis of Reimbursement Process
       through Process Mining techniques.

                             Ciappina Antonio Davide

                     Politecnico di Milano, Milan, 22699, Italy
                       antoniodavide.ciappina@polimi.it

      Abstract. This year Business Process Intelligence (BPI) challenge gives
      the opportunity to analyse the event log of data collected from the reim-
      bursement process at TU/e. In particular, Technische Universiteit Eind-
      hoven is interested in gaining information on their Reimbursement pro-
      cess answering particular process analysis and compliance research ques-
      tions from performance and control flow perspectives. This paper tries
      to answer these questions through process mining techniques, in order to
      detect interesting insights that traditional techniques would have rarely
      discovered. The starting point of the question driven project described
      in this paper, is the discovery of the processes recorded in the event log
      and then attention is focused on the travel declarations reimbursement
      process, where as a function of several variables different performance in-
      dicators and process maps have been measured and discovered through
      a Process Variant analysis. Finally a critical analysis is performed and
      enhancement ideas are suggested.

      Keywords: Process Mining · Reimbursement · BPI challenge · Question-
      driven Project · Process Variant analysis.

1   Introduction

The 10th International Business Process Intelligence (BPI) Challenge, takes place
for the second time in a row in correspondence with the International Conference
on Process Mining (ICPM) [2] and, challenges participants on the analysis of a
real-life event log in order to answer process owner’s questions and to provide
interesting and useful insights about the process recorded by the event log. The
main aim of this challenge is to provide and to show to both academia and indus-
try the real value and the scalability of process mining discipline and to put in
practice its latest developments. For this year challenge, data were collected from
the reimbursement process at TU/e. Starting from the different questions pro-
vided by the challenge description, this work tries to extract hidden knowledge
from the collected data and to provide interesting results about the reimburse-
ment process at TU/e that probably traditional process intelligence approaches
would have never been able to discover. The questions and the solutions that
this paper tries to solve and to suggest fall all under the three main process
mining categories: discovery, conformance checking and process enhancement.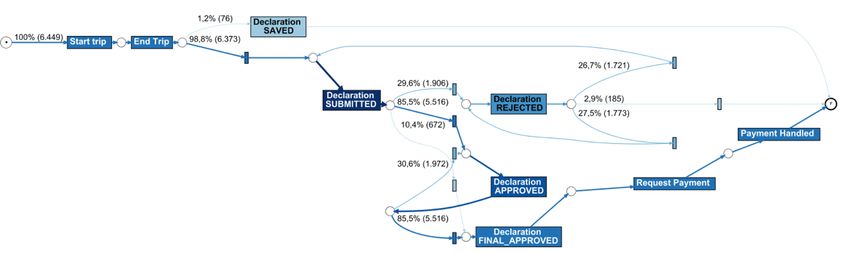
2               Ciappina Antonio Davide.

Different works from literature have been taken into account in order to follow a
consolidated methodology that guided the following analysis [1, 6, 3] . This work
can be divided into different sections, it starts with a description of the Data
and of the process that should be analysed, after that, the work goes on with the
description of the mining and analysis stage where process mining techniques are
put in practice and finally this paper concludes with presentation of the results
obtained and which are the possible improvement ideas that can be adopted to
improve the process.

2         Data and Process Understanding

In this part, the main results of exploration and inspection of the data and the
underlying process are briefly described.

2.1          The Data

The data are recorded for the reimbursement process at TU/e. They are spread
over different files that contain data about reimbursement requests submitted
from 01/01/2017 to 31/12/2018 and refer to travel permits and several request
types, namely domestic declarations, international declarations, prepaid travel
costs and requests for payment, where the latter refers to expenses which should
not be related to trips. From the following files, it was possible to extract in-
formation about three different process typologies: declarations process, travel
permit process and request for payment process all of them sub-processes of the
reimbursement process.
    Since there are different process typologies, the case notion is not unique
and depends on the analysed sub-process. For the declaration process, the case
notion is the declaration ID, while for the travel permit and request for payment
processes, the case notions are respectively the travel permit ID and the Request
for Payment ID.
       The data sets downloaded for the challenge are briefly described by the Table
1:

                                           Table 1: Eventlog of the example in Figure .
        Data Set             cases    events                                                     Description                                                          Case notion
  Requests for Payment       6,886    36,796                         Events referring to reimbursement of expenses not related to Trips                           Request for Payment ID
   Prepaid Travel Cost       2,099    18,246 Events referring to reimbursement of (pre-paid travel costs) expenses that should be afforded before the trip starts Request for Payment ID
      Travel Permits         7,065    86,581                        Events referring to the travel permits process, no payment is involved                          Travel Permits ID
International Declarations   6,449    72,151                         Events referring to the reimbursement process of International trips                             Declaration ID
  Domestic Declarations      10,500   56,437                          Events referring to the reimbursement process of Domestic trips                                 Declaration ID

   It was important to notice that a single travel permit can refers to multiple
declarations and/or request for payments, so same of the events recorded in In-
ternational Declarations, Requests for Payment and Prepaid Travel Cost Data
BPI Challenge 2020        3

Sets are also presents in the Travel Permits log.

    From the Data it was possible to have record of 57 different Event classes
that for the sake of simplicity, at first instance, in order to have a macroscopic
view of the process, were aggregated under 23 event classes.The aggregation cri-
teria can be understood referring to Table 2.

   The data contains several attributes, which most of them are on trace level
rather then event level. The main attributes on trace level are:

 – Organizational Entity: The Organization Entity in charge of the reim-
   bursement process.
 – Amount: The amount of the reimbursement request.
 – Permit Project Number: The number of the project associated with the
   reimbursement request.

2.2   The Process
From the process execution log, as mentioned previously, it is possible to extract
knowledge about 3 different processes. From the description of the challenge, it
was possible to understand briefly the reimbursement process flow. The Request
for payment and Declaration sub-processes follow a similar process flow. The
employee firs submit a request for reimbursement and then the request is sent
for approval to the travel administration. It can be subjected to two different
outcomes, the request can be approved first by the administrations and than if
necessary by other process stakeholders or it can be rejected so the employee
can resubmit or reject the request. If the approval flow has a positive result, the
payment is requested and made.
    On the other hand the travel permit process follow a slightly different flow,
from the fact that no payment is involved. In this case if the travel permit ap-
proval flow has a positive result a trip can take place, indicated with an estimated
start and end date. These dates are not exact travel dates, but rather estimated
by the employee when the permit request is submitted. The actual travel dates
are close to the given dates in most cases. When the trip is ended the travel
permit process can be considered ended and the employee can submit a travel
declaration to request the reimbursement.

3     Mining & Analysis
In this section Process mining techniques are applied to the event logs down-
loaded for the challenge and the main goal is to answer research questions defined
by the process owner and to extract hidden knowledge recorded by the process
execution event data. This work can be considered as a ”Question-driven”
[6] project since the research questions that process mining techniques try to
solve are specific questions and are defined a priori. Before applying discovery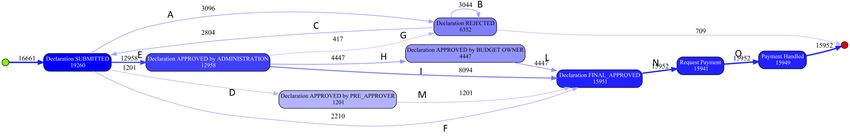
4      Ciappina Antonio Davide.

                  Table 2: Eventlog of the example in Figure .
                         Activity                             Aggregated Activity
Declaration APPROVED by ADMINISTRATION
Declaration APPROVED by BUDGET OWNER
                                                           Declaration APPROVED
Declaration APPROVED by PRE APPROVER
Declaration APPROVED by SUPERVISOR
Declaration FINAL APPROVED by DIRECTOR
                                                       Declaration FINAL APPROVED
Declaration FINAL APPROVED by SUPERVISOR
Declaration FOR APPROVAL by ADMINISTRATION
Declaration FOR APPROVAL by PRE APPROVER                Declaration FOR APPROVAL
Declaration FOR APPROVAL by SUPERVISOR
Declaration REJECTED by ADMINISTRATION
Declaration REJECTED by BUDGET OWNER
Declaration REJECTED by DIRECTOR
Declaration REJECTED by EMPLOYEE                           Declaration REJECTED
Declaration REJECTED by MISSING
Declaration REJECTED by PRE APPROVER
Declaration REJECTED by SUPERVISOR
Declaration SAVED by EMPLOYEE                                 Declaration SAVED
Declaration SUBMITTED by EMPLOYEE                          Declaration SUBMITTED
End trip                                                            End trip
Payment Handled                                                Payment Handled
Permit APPROVED by ADMINISTRATION
Permit APPROVED by BUDGET OWNER
                                                             Permit APPROVED
Permit APPROVED by PRE APPROVER
Permit APPROVED by SUPERVISOR
Permit FINAL APPROVED by DIRECTOR
Permit FINAL APPROVED by SUPERVISOR
                                                         Permit FINAL APPROVED
Permit FOR APPROVAL by ADMINISTRATION
Permit FOR APPROVAL by SUPERVISOR
Permit REJECTED by ADMINISTRATION
Permit REJECTED by BUDGET OWNER
Permit REJECTED by DIRECTOR
Permit REJECTED by EMPLOYEE                                   Permit REJECTED
Permit REJECTED by MISSING
Permit REJECTED by PRE APPROVER
Permit REJECTED by SUPERVISOR
Permit SAVED by EMPLOYEE                                        Permit SAVED
Permit SUBMITTED by EMPLOYEE                                 Permit SUBMITTED
Request For Payment APPROVED by ADMINISTRATION
Request For Payment APPROVED by BUDGET OWNER
                                                      Request For Payment APPROVED
Request For Payment APPROVED by PRE APPROVER
Request For Payment APPROVED by SUPERVISOR
Request For Payment FINAL APPROVED by BUDGET OWNER
Request For Payment FINAL APPROVED by DIRECTOR
Request For Payment FINAL APPROVED by SUPERVISOR   Request For Payment FINAL APPROVED
Request For Payment FOR APPROVAL by ADMINISTRATION
Request For Payment FOR APPROVAL by SUPERVISOR
Request For Payment REJECTED by ADMINISTRATION
Request For Payment REJECTED by BUDGET OWNER
Request For Payment REJECTED by EMPLOYEE
                                                      Request For Payment REJECTED
Request For Payment REJECTED by MISSING
Request For Payment REJECTED by PRE APPROVER
Request For Payment REJECTED by SUPERVISOR
Request For Payment SAVED by EMPLOYEE                    Request For Payment SAVED
Request For Payment SUBMITTED by EMPLOYEE             Request For Payment SUBMITTED
Request Payment                                                Request Payment
Send Reminder                                                   Send Reminder
Start trip                                                         Start trip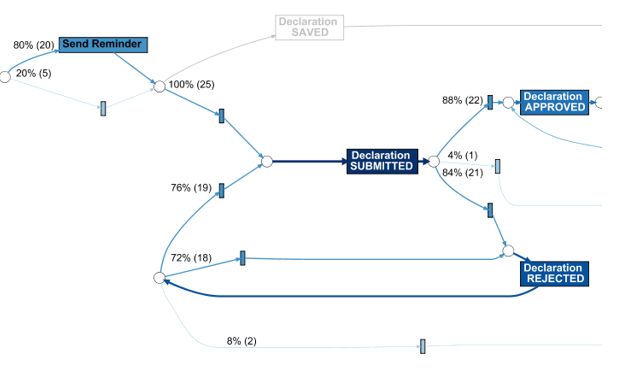
BPI Challenge 2020       5

algorithms to the event logs, an exploratory visual analysis on the event log was
conducted. For most of the activity performed in this stage, it was used the most
popular open source software on process mining: ProM [7].

3.1   Visual Analysis
In Figure 1 and 2, it is possible to see the dotted chart respectively of the
domestic and international travel declarations. Each event is depicted as a dot
in a two dimensional plane. The vertical axis represents the case of the event,
while the horizontal axis represents the timestamp of the event [4].

              Fig. 1: Dotted chart of domestic travel declarations

    As it is clear looking both the two Figures, the trend of the charts seems to
be different between the 2017 and 2018 travel declarations, this is due to two
main reasons. The first one is due to the availability of data: in 2017 data were
collected about only two departments while in 2018 event data were recorded
for the entire organizations. The second reason is due to a process drift between
2017 and 2018 cases: the process changed slightly on several occasions in 2017,
since it was a pilot year respect to the process observed in 2018. This concept
will be understood and explained later in the following paragraphs. Both the
two reasons lead the chart to have the right side with an highest dot density
respect to the upper-left side, that means more events per day were recorded in
2018 respect to 2017. From both the two charts, dividing the cases between 2017
and 2018 reimbursement requests, it is possible to notice that the frequency
of travel declarations submitted per day resulted almost constant over time,
since the slope of the two graph seems to be constant. There are some area in
white that correspond to holidays or weekends periods where no operations were
executed. However, some periods where the frequency has changed over time
have been noticed. In particular looking at Figures 1 and 2, it is possible to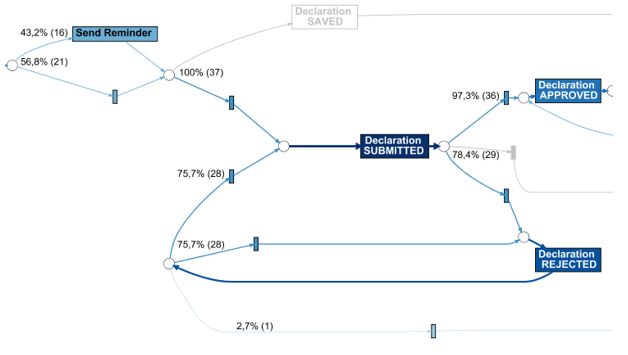
6         Ciappina Antonio Davide.

              Fig. 2: Dotted chart of International travel declarations

notice a deceleration of the number of travel declaration submitted per day in
correspondence with the summer months.

      (a) Domestic Travel declarations        (b) International Travel declarations

    Fig. 3: Dotted Charts of Travel declarations from a case duration perspective

   Looking at Figure 3, from a case duration perspective, it is possible to notice
that, for most of the domestic travel declarations, the throughput time seems to
remain in a certain range for all the analysed period, while for the international
BPI Challenge 2020 7
travel declarations the average throughput time of 2018 cases seems to be slightly
longer than the 2017 ones. Nevertheless, some outlier cases, from a duration
perspective, seems to be present as can be seen from the dots that are far away
from the zone with highest dot density.
3.2 Process Discovery
After a brief event log visual analysis, it was possible to start the process dis-
covery phase, where the main output was to discover the as-is Reimbursement
Process Model. As already said in the previous lines, the reimbursement process
can be viewed as made by three different sub-processes, so in this paragraph
three different process models have been discovered. For this phase, the models
have been discovered using the aggregated events as explained in Table 2. At
first instance the inductive miner (IMf) [5] has been applied to the different
event logs to give a first shape of the different as-is processes and then Heuristic
and Fuzzy miner [8] have been executed in order to improve the performance
quality of the discovered process models in terms of fitness and precision. This
last step was useful to detect some process patterns that were not discovered by
the inductive miner.
Travel Declaration Process
This section describes the models which depict the process of reimbursement
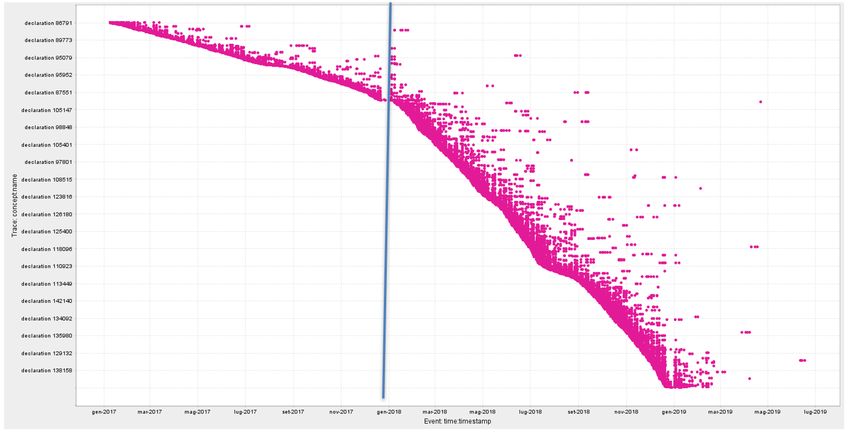
request related to travel declarations. In Figure 4 and 5, it is possible to see
respectively the Petri net and direct follow graph of the travel declaration process
discovered using process mining algorithms.
Fig. 4: Petri net of Travel declaration process
The most common flow is depicted in both the two figures by paths labeled in
dark blue and starts when the declaration is submitted by an employee. Then the
declaration is approved multiple times and if the approval outcome is positive the
payment is first requested and then handled by the system. During the process,
however, the declaration can be rejected in many instance. Usually, the event
declaration rejected, when recorded, occurs after the declaration submission,8 Ciappina Antonio Davide.
Fig. 5: Direct follow graph of travel declaration process
however, as can be seen in Figure 5 some rejections after one or more approval
declarations have been recorded. After the declaration rejection, the process can
be considered complete or the declaration can be resubmitted after some changes
made by the employee. Looking the two graphs, it was possible to notice in
addition, that there are some cases made by one activity: declaration saved in
which the system recorded that a new travel declaration had been created into
the system by the employee but no activities have been performed to it.
Travel permit Process
This section describes the models which depict the process flow of a travel
permit request.The flow, as already said, is slightly different from the travel
declaration process described in the previous lines since no payment is involved.
The employee, before starting an international travel, should submit a travel
permit that must be approved before the trip start. As can be seen from Figure
6 and 7, the most frequent path starts with the permit submission, than several
permit approval are performed and if the outcome is positive the trip can take
place. However it can occur that the permit is rejected so the travel permit
should be resubmitted. It is interesting to notice that, in some cases the travel
permit have been approved or even submitted after the end of the trip, and they
can be considered as something anomalous from a normative perspective.
Request for Payment Process
This section describes the models which depict the process flow of a Request
for Payment. It is a reimbursement request similar to a travel declaration, so the
process flow of the two processes can be considered comparable. This concept
can be clear looking at the two discovered process maps depicted in Figure 8 and
9 that are similar to the two graphs in Figure 4 and 5, the only difference is that
in this case the case ID is a request for payment that stands for reimbursement
requests submitted for expenses undertaken before the travel start or to expenses
not travel related.BPI Challenge 2020 9
Fig. 6: Petri net of Travel permit process
Fig. 7: Direct follow graph of Travel permit process
Fig. 8: Petri net of Request for Payment process.
3.3 Question Driven Analysis
As already introduced in the previous sections, the analysis stage of this work fol-
lows predefined questions that are of interest to the process owner. The starting
point of the analysis are research questions presented in the challenge descrip-
tion and the discovered process models described in the previous lines. Attention10 Ciappina Antonio Davide.
Fig. 9: Direct follow graph of Request for Payment process
in this stage, is focused especially on the analysis of the travel declaration pro-
cess flow and performance, since most of the questions refer to this particular
reimbursement request sub-process.
What is the throughput of a travel declaration from submission (or
closing) to paying?
To answer to this question it was important to perform an alignment between
the event log and the discovered process maps and then, it was possible to
extract the cases where the event ”payment handled” occurred. For this cases,
the elapsed time between event ”Declaration submitted” and ”Payment handled”
was computed and the results are summarized in Table 3.
Table 3: Descriptive statistics: Throughput time
Statistics Throughput time
Variable N N* Mean SE Mean StDev Minimum Q1 Median Q3 Maximum
throughputtime 16231 0 12,759 0,129 16,449 1,065 6,144 8,405 14,070 429,072
For 16231 travel declarations where a payment was performed, the average
throughput time is 12.759 days while the Median is about 8.4 days. As can be
seen from the boxplot in Figure 10, some outlier cases were presents.
Is there are difference in throughput between national and inter-
national trips?
Starting from the extracted cases of the previous question it was possible to
perform a statistical test to determine whether the mean and the variance of
the national and international throughput Time differ significantly. The results
of the T-test are summarized in Figure 11a while the variance test results are
summarized in Figure 11b
As can be notice, from the Figure 11 it is possible to affirm that the average
throughput time can be considered different between domestic and internationalBPI Challenge 2020 11
Fig. 10: Direct follow graph of Request for Payment process
(a) Two-Sample T-Test and CI: through- (b) Test and CI for Two Variances:
putTime; declarationType throughputTime vs declarationType
Fig. 11: Statistical test results for mean and variance
declarations since the p value is 0.00 and the null hypothesis can be rejected. The
throughput time for national trip is about 11.5 days while for the international
ones is about 14.5 days. On the other hand, the null hypothesis for the variance
test can not be rejected considering the Bonnet test result.12 Ciappina Antonio Davide.
Are there differences between clusters of declarations, for example
between cost centers/departments/projects etc.?
Before answering to this question, it was important to understand which
are the relevant clusters that can be found in the travel declarations data. As
mentioned before, travel declarations can be grouped between international and
domestic and by year 2017 and 2018, in addition several attribute can be con-
sidered as cluster criteria, however not all of them are relevant for this analysis.
At first instance, it was possible to divide the international declarations by the
department unit in charge of handling such reimbursement requests: through a
Pareto analysis, it was possible to understand which were the main ones. As can
be notice by looking at Figure 12, most of the international travel declaration
can be grouped by 9 different departments.
Fig. 12: Pareto chart of organizational entity
Following the same criteria, it was not possible to find other relevant variables
that could have been used to cluster the declarations, it was only possible to
group the declaration between the ones linked to projects and the ones not.
It was possible to detect some relevant differences for the throughput time
for declarations handled by the different organizational units, this can be notice
looking at the interval plot in Figure 13. The throughput time of international
declarations change considerably as a function of the different organizational
units in particular for Units 65457 and 65466 the mean time is more than 19 days
and this suggests that something is not going as planned for such Organizational
Entities. Referring, on the other hand, to travel declarations submitted in 2017
and 2018 it was possible to notice an increase of the throughput time for theBPI Challenge 2020 13
Fig. 13: Interval plot and descriptive statistics for international declarations
grouped by organizational unit.
international ones, while it was not possible to found a significant difference
between international travel declarations linked to project and the one not. This
concept is clear looking at the descriptive statistics for the different clusters
summarized in Figure 14.
Fig. 14: Descriptive statistics of clusters of declarations
What is the throughput in each of the process steps, i.e. the sub-
mission, judgement by various responsible roles and payment?
To answer to this question, the graph presented in Figure 5 was extended with
additional information. The event ”Declaration APPROVED” was divided in14 Ciappina Antonio Davide.
Fig. 15: Direct follow graph of travel declaration process with Approval activities
labelled by role.
Table 4: Descriptive statistics: Throughput time
Path A B C D E F G H I L M N O
MEAN 3.52 2.97 3.33 1.43 1.40 1.08 2.51 2.35 2.25 1.94 1.90 3.19 3.53
ST.DEV 19.92 4.68 12.74 8.17 9.89 7.22 3.33 4.00 3.47 3.86 2.22 6.87 2.26
multiple tasks by various responsible roles, and the resulting Direct Follow graph
can be seen in Figure 15. Each path of the graph is labeled with a letter, and the
mean and standard deviation flow time between each activities are summarized
in Table 4.
Where are the bottlenecks in the process of a travel declaration?
From the Table 4, it is possible to detect the main bottlenecks of the travel
declaration process, long sojourn times are present between the submission of a
declaration and when it is rejected, and when is rejected by the employee and
then resubmitted, more than 3 days pass between these activities. In addition,
long sojourn times are present also in the final part of the analysed process, when
the declaration is final approved more than 6 days pass before the payment
is handled, in particular path N and O takes respectively 3.19 days and 3.53
days, and it is something anomalous since ”Request Payment” and ”Payment
Handled” are activities performed by the system and margins of improvements
are present.
How many travel declarations get rejected in the various processing
steps and how many are never approved?
Looking at the process model in Figure 4 it is possible to notice that after
the submission of a travel declaration 17% of them are rejected while 3% of the
total analysed travel declarations are rejected before they are final approved.
As already described in the previous lines, when a travel declaration flow has
a negative outcome the employee can resubmit or not the declaration, and at
about 3% of the total declarations are not resubmitted by the employee, so in
this case, the process ends when the travel administration rejects the declaration.
How many travel declarations are booked on projects?BPI Challenge 2020 15
From the downloaded event logs, it was possible to have some additional
information for some cases by the attributes present in the data-sets, in par-
ticular for international travel declarations it was possible to understand if the
submitted declaration was linked to some project. For all the 6450 analysed in-
ternational reimbursement requests, 60% of them, 4116 declarations, are booked
on projects.
How many corrections have been made for declarations?
Referring to the previous Question, the declaration that were submitted more
than one time per case, can be considered as the ones that were subject to some
corrections. Looking at the graph in Figure 4, of the aligned cases at about 17%
of the total declarations were resubmitted after they were rejected by the travel
administration.
Are there any double payments?
To answer to this question, it was possible to refer to the Direct follow graph
depicted in Figure 5, and in particular the zoomed view in Figure 16. After the
occurrence of the event payment handled, the process instance can be considered
completed, however it was possible to detect that for 3 cases the last event of
these traces was not Payment Handled, that means something occurred after
the system reimbursed the employee. However, looking in detail Figure 16 it is
possible to notice that the last event for these anomalous traces was Request
Payment, so no double payments were recorded by the analysed event log, since
the event Payment Handled was not recorded twice in any trace.
Fig. 16: Zoom on anomalous traces to check double payments
Are there declarations that were not preceded properly by an ap-
proved travel permit? Or are there even declarations for which no
permit exists?
From a normative perspective, for international declarations before submit-
ting a reimbursement request, it should be mandatory that a travel permit is16 Ciappina Antonio Davide.
Fig. 17: Direct follow graph of travel permit process with declaration submitted.
first submitted and then approved. However, analysing the process informa-
tion recorded in the travel permit event log some declaration were not preceded
properly by an approval travel permit. This concept is clear looking at Figure
17, event ”Declaration Submitted” in some traces occurred not after the travel
permit is final approved. In the graph there are some income arcs that link tran-
sition ”Declaration Submitted” with activities different than ”Permit FINAL
APPROVED”. In addition, there are even 438 declarations that were submitted
without the submission of any travel permit.
How many travel declarations are first rejected because they are
submitted more than 2 months after the end of a trip and are then
re-submitted?
Fig. 18: Petri-net of travel declarations submitted more than 2 months after the
end of a trip.
To answer to this question, it was import to extract the cases where the
declarations submission occurred 2 month later than the end of the trip. From
the extracted cases, it was possible first to discover the Petri-net and then to
align the events with the graph. The results are shown in Figure 18 where it is
possible to detect that 29,6% of the aligned cases were rejected, of which more
than 26% of the total cases were then resubmitted by the employee.BPI Challenge 2020 17
Is this different between departments?
From the extracted cases used in the previous question, it was possible to
group them by the different organizational units and then to perform an align-
ment to answer the following question. It was discovered that the percentage of
cases submitted more than 2 months after the end of a trip and then resubmitted
varies significantly between the different department. In Figure 19, it is shown a
zoom on the alignment results for organizational units 65459, 65458 and 65456
where, as can be notice from the picture below, the considered percentage is
respectively more than 80%, about 35% and more then 78%.
(a) Alignments of Organizational Unit (b) Alignments of Organizational Unit
65459 cases. 65458 cases.
(c) Alignments of Organizational Unit 65456
cases.
Fig. 19: Alignments of travel declarations submitted more than 2 months after
the end of a trip between departments.
How many travel declarations are not approved by budget holders
in time (7 days) and are then automatically rerouted to supervisors?
To answer to this question, at first instance it was performed an extraction
of the cases where activity ”Declaration APPROVED by SUPERVISOR” was
recorded and then the direct follow graphs of the following cases, that it is shown
in Figure 20, was discovered. As can be notice by the graph, 104 declarations18 Ciappina Antonio Davide.
Fig. 20: Direct Follow graph of declaration approved by Supervisor.
where subjected by an approval by a supervisor and for this traces it was possible
to analyse the flow time between the activities ”Declaration APPROVED by
ADMINISTRATION” and ”Declaration APPROVED by SUPERVISOR”. In
conclusion, it was discovered that for this traces only 18 cases were not approved
by budget holders in time and were then automatically rerouted to supervisors.
References
1. van der Aalst, W., Adriansyah, A., de Medeiros, A.K.A., Arcieri, F., Baier, T.,
Blickle, T., Bose, J.C., van den Brand, P., Brandtjen, R., Buijs, J., Burattin, A.,
Carmona, J., Castellanos, M., Claes, J., Cook, J., Costantini, N., Curbera, F.,
Damiani, E., de Leoni, M., Delias, P., van Dongen, B.F., Dumas, M., Dustdar,
S., Fahland, D., Ferreira, D.R., Gaaloul, W., van Geffen, F., Goel, S., Günther, C.,
Guzzo, A., Harmon, P., ter Hofstede, A., Hoogland, J., Ingvaldsen, J.E., Kato, K.,
Kuhn, R., Kumar, A., La Rosa, M., Maggi, F., Malerba, D., Mans, R.S., Manuel,
A., McCreesh, M., Mello, P., Mendling, J., Montali, M., Motahari-Nezhad, H.R., zur
Muehlen, M., Munoz-Gama, J., Pontieri, L., Ribeiro, J., Rozinat, A., Seguel Pérez,
H., Seguel Pérez, R., Sepúlveda, M., Sinur, J., Soffer, P., Song, M., Sperduti, A.,
Stilo, G., Stoel, C., Swenson, K., Talamo, M., Tan, W., Turner, C., Vanthienen, J.,
Varvaressos, G., Verbeek, E., Verdonk, M., Vigo, R., Wang, J., Weber, B., Weidlich,
M., Weijters, T., Wen, L., Westergaard, M., Wynn, M.: Process mining manifesto.
In: Daniel, F., Barkaoui, K., Dustdar, S. (eds.) Business Process Management Work-
shops. pp. 169–194. Springer Berlin Heidelberg, Berlin, Heidelberg (2012)
2. van Dongen, B.: Bpi challenge 2020 (Mar 2020).
https://doi.org/10.4121/uuid:52fb97d4-4588-43c9-9d04-3604d4613b51
3. van Eck, M.L., Lu, X., Leemans, S.J.J., van der Aalst, W.M.P.: pm2 : A process
mining project methodology. In: Zdravkovic, J., Kirikova, M., Johannesson, P. (eds.)
Advanced Information Systems Engineering. pp. 297–313. Springer International
Publishing, Cham (2015)
4. Kriglstein, S., Pohl, M., Rinderle-Ma, S., Stallinger, M.: Visual analytics in process
mining: Classification of process mining techniques (06 2016)
5. Leemans, S.J., Fahland, D., van der Aalst, W.M.: Discovering block-structured pro-
cess models from event logs containing infrequent behaviour. In: International con-
ference on business process management. pp. 66–78. Springer (2013)
6. Van Der Aalst, W.: Data science in action. In: Process Mining. Springer (2016)BPI Challenge 2020 19 7. Van Der Aalst, W., Dongen, B., Günther, C., Rozinat, A., Verbeek, E., Weijters, A.: Prom: The process mining toolkit. (01 2009) 8. Weijters, A., Ribeiro, J.: Flexible heuristics miner (fhm). In: 2011 IEEE symposium on computational intelligence and data mining (CIDM). pp. 310–317. IEEE (2011)
You can also read