Flooding in the south; drought in the north - NIWA
←
→
Page content transcription
If your browser does not render page correctly, please read the page content below
New Zealand Climate Summary: Summer 2019-20 Issued: 4 March 2020
Flooding in the south; drought in the north
Temperature Summer temperatures were near average (-0.50°C to +0.50°C of the summer average)
for much of the South Island with a large portion of Canterbury and parts of Otago
and Tasman experiencing above average temperatures (+0.51°C to +1.20°C of the
summer average). Above average temperatures also occurred for most of the North
Island although near average temperatures were experienced along most of the west
coast and in parts of Gisborne and Waikato.
Rainfall Prolonged dry conditions in the North Island resulted in rainfall totals that were
mostly below normal (50-79% of the summer normal) or well below normal (149% of the summer normal) summer rainfall totals
across much of Southland, Otago and southern West Coast. The northern portion of
the South Island mostly received near normal (80-119% of the summer normal)
rainfall except for coastal Canterbury between Christchurch and Kaikoura where
rainfall was below normal.
Soil moisture At the end of summer, soil moisture levels were below or well below normal across
most of the North Island, the upper South Island, and much of Canterbury. Soil
moisture levels were wetter than normal for parts of the West Coast, Otago, and
Southland but otherwise near normal for the lower South Island.
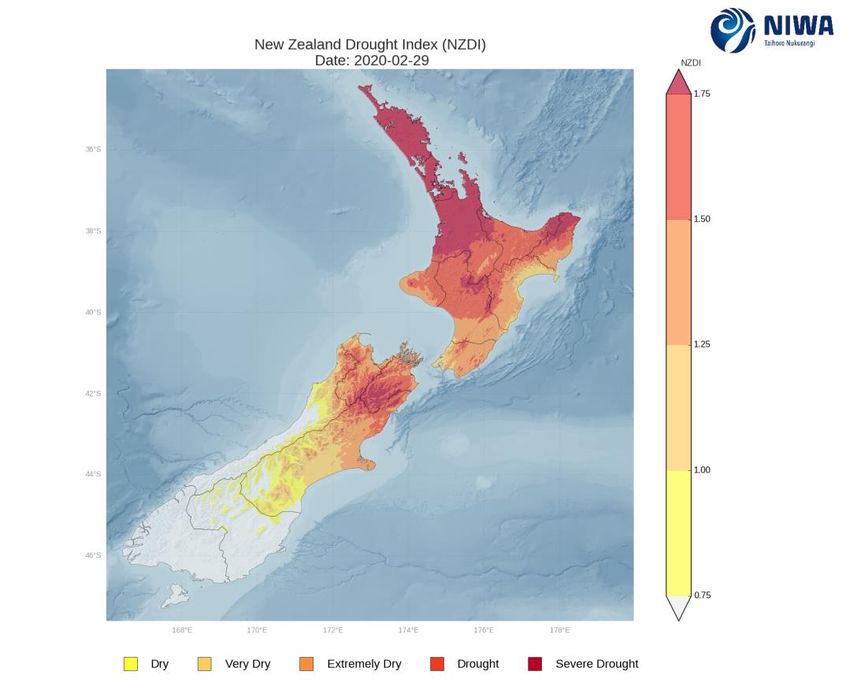
Meteorological drought developed for parts of the country during January and
became more extensive during February. According to NIWA’s New Zealand Drought
Index, by the end of summer, meteorological drought was present across much of the
North Island (excluding southeast North Island and coastal Taranaki) with severe
drought widespread across Northland, Auckland, Great Barrier Island, and Waikato.
Drought conditions were also present in several northern South Island locations,
including parts of Tasman, northern Canterbury, and much of Marlborough.
Click on the link to jump to the information you require:
Overview
Temperature
Rainfall
Summer climate in the six main centres
Highlights and extreme events
Overview
Summer 2019-20 was characterised by lower than normal mean sea level pressure over the South
Island and much lower than normal pressure to the south and east of New Zealand with higher than
normal pressure to the northwest of the country. This pressure set up was associated with more
westerly-quarter winds than normal and a persistently negative Southern Annular Mode during the
first half of the season.

The persistent area of high pressure near the North Island was influenced by a strongly positive
Indian Ocean Dipole pattern early in summer and by a warm pool of water in the tropical western
Pacific Ocean later on. Climate change is expected to bring more frequent high pressure systems
near and north of the North Island, similar to what occurred during summer 2019-20.

Nationwide temperatures during December and January were near average (-0.50°C to +0.50°C of
the summer average) although some locations experienced above or well above normal
temperatures during these months. February concluded summer on a warm note with a nationwide
temperature that was above average (+0.51°C to +1.20°C of the summer average). For the summer
season as a whole, temperatures were near average for much of the South Island with a large
portion of Canterbury and parts of Otago and Tasman observing above average temperatures. Most
of the North Island had above average temperatures although near average temperatures were
experienced along much of the west coast and in parts of Gisborne and Waikato.

The nationwide average temperature for summer 2019-20 was near average at 17.1˚C (0.4°C
warmer than the 1981-2010 summer average, using NIWA’s seven-station temperature series which
begins in 1909).

December was very wet for many western and inland parts of the South Island, and this contributed
to high lake levels and flooding events during the month. Conversely, January was very dry and most
of the country received below normal (50-79% of the summer normal) or well below normal (149% of the summer
normal) rainfall was observed in much of Southland, Otago and southern West Coast, owing to the
periods of heavy rain occurring in December and February. The northern portion of the South Island
mostly received near normal rainfall except coastal Canterbury between Christchurch and Kaikoura
where rainfall was below normal.

Further Highlights:

    •   The highest temperature was 38.2˚C, observed at Gisborne on 31 January. This was New
        Zealand’s 5th-hottest January temperature on record.
    •   The lowest temperature of the month was -0.7˚C, observed at Hanmer Forest on 15, 16, and
        17 January.
    •   The highest 1-day rainfall was 509 mm, recorded at Milford Sound on 3 February.
    •   The highest wind gust was 196 km/h, observed at Cape Turnagain on 5 January.
    •   Of the six main centres, Tauranga was the warmest, Dunedin was the coldest and wettest,
        Christchurch was the driest, Tauranga was the sunniest and Dunedin was the least sunny
    •   Of the available, regularly reporting sunshine observation sites, the sunniest four locations in
        2020 so far are Bay of Plenty (618 hours), Taranaki (592 hours), Waikato (584 hours) and
        Auckland (564 hours).

For further information, please contact:
Chris Brandolino
Principal Scientist - Forecasting and Media, NIWA Auckland
Tel. 09 375 6337
Temperature: Near or above average summer temperatures across the country
Summer temperatures were near average for much of the South Island although a large portion of
Canterbury and parts of Otago and Tasman received above average temperatures. Above average
temperatures were also received for most of the North Island with near average temperatures
experienced along most of the west coast and in parts of Gisborne and Waikato.
Many locations experienced record or near-record high mean maximum temperatures. The most
anomalous of these was Hanmer Forest where mean maximum summer temperatures were 3.5°C
warmer than average, with records going all the way back to 1906.
Record1 or near-record mean air temperatures for summer were recorded at:
Location Mean Departure Year Comments
air temp. from records
(oC) normal (oC) began
High records or near-records
Waipawa 18.7 1.1 1945 2nd-highest
Wairoa 20.8 2.1 1964 2nd-highest
Farewell Spit 19.2 1.8 1971 2nd-highest
Motu 16.7 1.5 1990 3rd-highest
Gisborne 20.3 1.6 1905 3rd-highest
Hastings 19.8 2.4 1965 3rd-highest
Stratford 17.0 1.5 1960 3rd-highest
Cheviot 17.4 1.3 1982 3rd-highest
Whangarei 20.7 1.1 1967 4th-highest
Tauranga 20.4 1.3 1913 4th-highest
Te Puke 19.5 1.5 1973 4th-highest
Rotorua 18.6 1.4 1964 4th-highest
Hicks Bay 19.5 1.3 1969 4th-highest
Mahia 18.8 0.9 1990 4th-highest
Upper Hutt (Trentham) 17.7 1.1 1939 4th-highest
Kaikoura 17.3 1.1 1963 4th-highest
Low records or near-records
None observed
1
The rankings (1st, 2nd, 3rd etc.) in all Tables in this summary are relative to climate data from a group of nearby stations,
some of which may no longer be operating. The current climate value is compared against all values from any member of
the group, without any regard for homogeneity between one station’s record, and another. This approach is used due to
the practical limitations of performing homogeneity checks in real-time.Record or near-record mean maximum air temperatures for summer were recorded at:
Location Mean Departure Year Comments
maximum from records
air temp. normal (oC) began
(oC)
High records or near-records
Kerikeri 25.8 1.9 1945 Highest
Kaikohe 24.6 2.2 1973 Highest
Whangarei 26.6 2.6 1967 Highest
Whangaparaoa 24.7 1.8 1982 Highest
Whitianga 26.4 3.0 1962 Highest
Matamata 26.1 2.5 1999 Highest
Whakatane 25.3 1.8 1974 Highest
Taupo 25.3 3.3 1949 Highest
Te Kuiti 26.2 2.6 1959 Highest
Hicks Bay 23.2 1.8 1969 Highest
Waipawa 25.9 2.3 1945 Highest
Ohakune 23.2 2.7 1962 Highest
Farewell Spit 24.1 2.9 1971 Highest
Hanmer Forest 26.0 3.5 1906 Highest
Paeroa 25.9 1.5 1947 2nd-highest
Tauranga 25.3 2.0 1913 2nd-highest
Te Puke 24.9 1.8 1973 2nd-highest
Rotorua 24.4 2.7 1964 2nd-highest
Hamilton 25.8 2.0 1946 2nd-highest
Hastings 25.7 3.0 1965 2nd-highest
Wairoa 26.9 3.0 1964 2nd-highest
Takaka 24.4 1.9 1978 2nd-highest
Kaikoura 21.7 1.8 1963 2nd-highest
Auckland (Whenuapai) 24.7 1.5 1945 3rd-highest
Motu 22.4 2.4 1990 3rd-highest
Gisborne 25.9 1.9 1905 3rd-highest
Upper Hutt (Trentham) 23.0 1.6 1939 3rd-highest
Medbury 24.7 1.6 1927 3rd-highest
Cheviot 24.3 2.2 1982 3rd-highest
Turangi 23.7 1.3 1968 4th-highest
Low records or near-records
None observedRecord or near-record mean minimum air temperatures for summer were recorded at:
Location Mean Departure Year Comments
minimum from records
air temp. normal (oC) began
(oC)
High records or near-records
Mahia 15.4 0.9 1990 3rd-highest
Wairoa 14.7 1.2 1964 4th-highest
Low records or near-records
Turangi 9.4 -1.6 1968 2nd-lowest
Te Kuiti 10.7 -1.6 1959 4th-lowestRainfall: Dry in the north, wet in the south
When looking at the rainfall pattern for summer as a whole, rainfall in the North Island was below
normal (50-79% of the summer normal), with well below normal (149%
of the summer normal) rainfall was received across much of Southland, Otago and southern West
Coast. The northern portion of the South Island mostly recorded near normal rainfall except coastal
Canterbury between Christchurch and Kaikoura where rainfall was below normal for the time of
year.
Record or near-record summer rainfall totals were recorded at:
Location Rainfall Percentage Year records Comments
total (mm) of normal began
High records or near-records
Balclutha 308 150 1964 2nd-highest
Milford Sound 2852 152 1929 4th-highest
Low records or near-records
Dargaville 63 25 1943 Lowest
Leigh 59 27 1966 Lowest
Whangaparaoa 60 30 1946 Lowest
Auckland (North Shore) 53 23 1966 Lowest
Auckland (Western Springs) 62 26 1948 Lowest
Auckland (Airport) 73 33 1959 Lowest
Whatawhata 124 41 1952 Lowest
Dannevirke 95 40 1951 Lowest
Kaitaia 77 27 1948 2nd-lowest
Kaikohe 94 29 1956 2nd-lowest
Whangarei 59 20 1937 2nd-lowest
Hamilton (Ruakura) 91 37 1905 2nd-lowest
Hamilton 87 33 1935 2nd-lowest
Te Kuiti 120 36 1950 2nd-lowest
Masterton 57 31 1926 2nd-lowest
Takapau Plains 90 39 1962 2nd-lowest
Matamata 119 51 1951 3rd-lowest
Pukekohe 100 43 1944 3rd-lowest
Kerikeri 91 27 1935 4th-lowest
Auckland (Whenuapai) 110 47 1943 4th-lowest
Arapito 381 69 1978 4th-lowestSummer climate in the six main centres
Summer temperatures were near average for Wellington and Dunedin, above average for Auckland,
Hamilton and Christchurch, and well above average for Tauranga which experienced its 4th-warmest
summer on record. Wellington and Dunedin observed near normal rainfall amounts while the
remaining main centres received well below normal rainfall. Of the six main centres, Tauranga was
the warmest, Dunedin was the coldest and wettest, Christchurch was the driest, Tauranga was the
sunniest and Dunedin was the least sunny with 631 hours, followed closely by Wellington with 632
sunshine hours.
Summer 2019-20 main centre climate statistics:
Temperature
Location Mean temp. (oC) Departure from Comments
normal (oC)
Aucklanda 20.0 +0.8 Above average
Taurangab 20.4 +1.3 Well above average (4th-highest)
Hamiltonc 18.7 +0.7 Above average
d
Wellington 16.7 +0.2 Near average
Christchurche 17.2 +0.6 Above average
Dunedinf 15.0 +0.3 Near average
Rainfall
Location Rainfall (mm) % of normal Comments
Aucklanda 76 35% Well below normal
Taurangab 88 34% Well below normal
Hamiltonc 87 33% Well below normal
Wellingtond, 2 197 86% Near normal
Christchurche 61 49 % Well below normal
Dunedinf 259 117 % Near normal
Sunshine
Location Sunshine (hours)
Aucklanda 805
Taurangab 813
Hamiltong, 3 766
Wellingtond 632
Christchurche 661
Dunedinf 631
a b c d e f
Mangere Tauranga Airport Hamilton Airport Kelburn Christchurch Airport Musselburgh g Ruakura
2
Missing 4 days of data
3
Missing 1 day of dataHighlights and extreme events
This section contains information pertaining to some of the more significant highlights and extreme
events that occurred during summer 2019-20. Note that a more detailed list of significant weather
events for summer 2019-20 can be found in the Highlights and extreme events section of NIWA’s
monthly Climate Summaries. These monthly summaries are available online, and may be viewed at
the following website: https://www.niwa.co.nz/climate/monthly
Rain and slips
During the first eight days of December, a stationary high to the northeast of New Zealand and low
pressure to the southwest brought a prolonged period of north-westerly airflows over the country.
These delivered persistent rainfall to the headwaters of the South Island lakes and rivers. Lake
Wanaka and Lake Wakatipu rose considerably, inundating lakeside roads, tracks and reserves. Many
Wanaka businesses sand-bagged their properties as floodwaters threatened buildings in the central
business district. The Central Otago District Council placed Alexandra, Roxburgh and Lake Roxburgh
Village on boil water notice, due to elevated turbidity in the Clutha River affecting the water
treatment plant.
On 7-8 December, heavy rain caused significant issues for many parts of the South Island and lower
North Island:
• Numerous landslides forced the closure of a 280 km stretch of SH6 between Hokitika and
Haast. The worst-affected area was about Mt Hercules, with an estimated 20-30 slips
forcing the prolonged closure of SH6 between Harihari and Haast. Approximately 970
tourists were stuck in Franz Josef township due to the road closures.
• The Rangitata River rose rapidly due to heavy rain in the headwaters, causing extensive
flooding in areas along the lower reaches of the river. A local state of emergency was
declared in the Timaru District due to flooding, and residents were evacuated from several
areas including Rangitata Island and Rangitata Huts. The Rangitata Bridge at SH1 and the
bridge at Arundel on Route 72 were closed for several days. Nine Transpower pylons
crossing the Rangitata River were damaged, with one of these towers swept away by the
floodwaters.
• Heavy rain caused flooding and road closures in and around Wellington. The worst-affected
areas were Porirua, Pāuatahanui and Hutt Valley suburbs including Manor Park, Silverstream
and Stokes Valley, with reports of vehicles written off due to water damage. A slip near
Silverstream blocked northbound lanes on SH2, SH58 was closed due to a slip and SH1
through Mana and Plimmerton Roundabout was closed due to flooding.
The Karangahake Gorge (SH2) was closed for several hours overnight from 8-9 December due to
flooding.
On 17 December, heavy rain caused flooding which closed SH63 between the Branch River and
Wairau River bridges (Wairau Valley in Marlborough).On 3-4 February, torrential rain and flooding impacted Fiordland, cutting off SH94 between Te Anau and Milford Sound and leaving more than 380 people stranded. Those stranded were directed to an assembly point at Mitre Peak Lodge. SH94 was badly damaged and remained closed to private vehicles for the entire month, with a partial reopening for bus convoys occurring towards the end of the month. A State of Emergency was declared in Milford Sound, and the Department of Conservation said that damage to the Routeburn Track was so severe that it would remain closed for the rest of the season, while the Milford Track would be closed for at least three weeks. A State of Emergency was declared in Southland and residents in parts of Gore, Mataura, and Wyndham were told to evacuate due to flooding on the Mataura River, which peaked at 2500 cumecs at Gore on 5 February, and nearly 2700 cumecs at Mataura. This State of Emergency was originally put in place until 11 February, but was then extended until at least 18 February. A boil water notice was also issued for residents in Mataura, the Otama Water Supply scheme, and all flood-affected Southland residents who use groundwater. More than 2400 people were evacuated from their homes in Gore along with more than 1500 people in Mataura. Dairy NZ stated that more than 100 dairy farms were severely impacted by the flooding. Dozens of roads were closed due to the flooding in Southland and Otago, including SH1 between Dunedin and Invercargill, SH94, SH97, SH6 between Queenstown and Kingston, and portions of SH90. Between 7-8 February, three bodies were found in the Makarora River, believed to be a group that had been tramping in Mount Aspiring National Park and were caught in floodwaters. Drought, water restrictions, and fire bans On 14 January, Fire and Emergency New Zealand issued a total fire band across Northland and a warning for homeowners to protect their homes against wildfire. On 16 January a total fire ban was issued for Wanaka, Lake Hawea, Omarama, Otematata, Kurow, Naseby, Ranfurly, Alexandra, Clyde, and Cromwell. As of 17 January, a total watering ban was in place for parts of the Coromandel Peninsula due to extremely dry conditions. As of 20 January, parts of central and northern Canterbury were on Level 1 and Level 2 water restrictions as a precautionary measure. As of 23 January, water restrictions were in force across the Far North District and several other towns across Northland due to extremely dry conditions. On 23 January, the Queenstown Lakes District Council issued a water restriction notice to the residents of Luggate, Otago. On 23 January, Central Taranaki’s continuous dry weather resulted in water restrictions being imposed in the Stratford District. On 23 January, a sprinkler and irrigation system ban was issued in Tauranga by the Tauranga City Council.
On 27 January, water restrictions and a total fire ban went into place for several communities across
the Tasman District due to dry conditions.

On 29 January, a water restriction notice was issued by the Timaru District Council.

On 30 January, a sprinkler restriction was introduced by the Gisborne District Council.

During the final week of January, a total ban on outside watering was put into place across the
Wairarapa for the first time in the last decade. The Waingawa River, which feeds Masterton’s water
supply, dipped below 1100 litres per second, a significant reduction from normal flow. Masterton
District Council begins looking at water conservation measures when the river drops below 1,900
litres per second.

Several record or near-record dry spells (defined as consecutive days with less than 1 mm of rain)
across New Zealand, including:

    Auckland area – 47 days (6 Jan-21 Feb), longest on record

    Whangarei – 38 days (15 Jan-21 Feb), second-longest on record

    Whitianga – 34 days (15 Jan-17 Feb), longest on record

    Takaka – 46 days (20 Dec-3 Feb), longest on record

    Blenheim – 64 days (20 Dec-21 Feb), longest on record

    Cheviot – 49 days (21 Dec-7 Feb), longest on record

    Culverden – 45 days (21 Dec-3 Feb), 2nd longest on record

    Rangiora – 45 days (21 Dec-3 Feb), 2nd longest on record

    Hanmer Forest – 40 days (26 Dec-3 Feb), longest on record

As of late February, the New Zealand Drought Index showed that severe meteorological drought was
widespread across Northland, Auckland, northern Waikato, and East Cape, along with parts of
western Bay of Plenty, Manawatu-Whanganui, northern Canterbury and southern Marlborough.
Meteorological drought also emerged from central Waikato to Manawatu-Whanganui, Taranaki, Bay
of Plenty, coastal Wairarapa, and Tasman. Much of the rest of the country was unusually dry, except
for the western and lower South Island.
By mid-February, total fire bans were in place across all of the North Island, Tasman, Nelson, Marlborough, northern Canterbury, and Central Otago. On 3 February a total watering ban was declared in Coromandel Town, Whitianga, and Hahei. On 11 February, MPI classified the meteorological drought conditions in Northland and northern Auckland as an adverse event, unlocking $80,000 in government support. On 18 February, the Far North District Council placed Level 4 water restrictions on the Paihia and Kawakawa catchments due to the long-term dry spell. By late February, water restrictions were increased to Level 3 in Kerikeri and Waipapa, and Level 2 in Whangarei. As of 26 February, Auckland Watercare believed that the Hoteo River in Wellsford was running at its lowest level since 1983, when the area experienced its worst drought on record. On 28 February, MPI classified the meteorological drought conditions in Waikato and South Auckland as an adverse event, unlocking $80,000 in government support.
Record or near record summer extreme 1-day rainfall totals were recorded at:

 Location                    Extreme 1-      Date of           Year       Comments
                             day rainfall    extreme         records
                               (mm)           rainfall        began
 Murchison                       77          Dec-2nd          1997        Highest
 Lauder                          84          Feb-4th          1924        Highest
 Judgeford                       102         Dec-7th          1978        2nd-highest
 Kaka                            88          Dec-2nd          1997        2nd-highest
 Queenstown                      81          Feb-3rd          1890        2nd-highest
 Lower Retaruke                  83          Dec-17th         1974        3rd-highest
 Pirinoa                         69          Dec-17th         1967        3rd-highest
 Waipounamu                      81          Feb-3rd          1917        3rd-highest
 Clyde                           54          Feb-4th          1978        3rd-highest
 Balclutha (Telford)             76          Feb-3rd          1964        3rd-highest
 Nugget Point                    60          Feb-2nd          1930        3rd-highest
 Mangakowhai                     74          Dec-17th         1995        4th-highest
 Milford Sound                   509         Feb-3rd          1929        4th-highest
 Glenthorne                      44          Dec-8th          1985        4th-highest
 Middlemarch                     55          Feb-4th          1896        4th-highest

Temperatures
Several locations across Southland and Otago observed one of their warmest December days on
record on 31 December. In Ranfurly, the temperature reached 32.3°C, making it Ranfurly’s highest
December temperature since records began in 1897.

An unusually warm air mass over the North Island in early February resulted in several locations
setting all-time maximum temperature records, including:

On 1 February, Whitianga reached 33.1°C, the hottest temperature recorded there since records
began in 1962. (The previous record was 33.0°C in February 2017). Meanwhile, Te Puke reached at
least 33.0°C, beating the old record of 32.5°C set in January 1979.

On 3 February, Whangarei set a new all-time record as the temperature reached 32.8°C, but this
record was beaten the very next day as the maximum temperature on 4 February reached 34.1°C.

High temperatures in Auckland resulted in peak water demand records being broken three times
during the week of 17 February as Aucklanders used colossal amounts of water. The highest volume
was 568 million litres on Wednesday 19 February.

The highest temperature during summer was 38.2˚C, observed at Gisborne on 31 January.

The lowest temperature during summer was -0.7˚C, observed at Hanmer Forest on 15, 16, and 17
January.
Record or near-record daily maximum air temperatures for summer were recorded at:
Location Extreme Date of Year records Comments
maximum extreme began
(°C) temperature
High records or near-records
Whangarei 34.1 Feb-4th 1967 Highest
Whitianga 33.1 Feb-1st 1962 Highest
Matamata (Hinuera) 32.8 Jan-26th 1999 Highest
Te Puke 33.0 Feb-3rd 1973 Highest
Whakatane (Airport) 36.4 Feb-3rd 1975 Highest
Taupo 33.2 Jan-26th 1949 Highest
Motu 32.5 Feb-3rd 1990 Highest
Takapau Plains 33.8 Feb-4th 1962 Highest
Hicks Bay 31.8 Feb-2nd 1969 Highest
Gisborne 38.2 Jan-31st 1905 Highest
Waipawa 36.9 Feb-4th 1945 Highest
Takaka 34.6 Jan-28th 1978 Highest
Akaroa 35.5 Feb-2nd 1978 Highest
Le Bons Bay 32.2 Feb-2nd 1984 Highest
Kaitaia (Airport) 30.7 Feb-2nd 1948 2nd-highest
Kerikeri (Aerodrome) 33.2 Feb-1st 1945 2nd-highest
Mokohinau 27.6 Feb-3rd 1994 2nd-highest
Whangaparaoa 30.1 Feb-20th 1982 2nd-highest
Tauranga (Airport) 33.6 Feb-1st 1913 2nd-highest
Rotorua 32.0 Feb-3rd 1964 2nd-highest
Te Kuiti 32.0 Jan-26th 1959 2nd-highest
Mahia 33.5 Feb-4th 1990 2nd-highest
Palmerston North 32.9 Feb-4th 1918 2nd-highest
Wanganui (Spriggens Park) 31.6 Feb-4th 1937 2nd-highest
Pelorus Sd (Crail Bay) 30.4 Jan-28th 1982 2nd-highest
Kaikohe 31.6 Feb-3rd 1973 Equal 2nd-highest
Wairoa (North Clyde) 37.3 Feb-2nd 1964 Equal 2nd-highest
Napier (Airport) 37.4 Feb-2nd 1868 3rd-highest
Auckland (Airport) 29.8 Feb-4th 1959 3rd-highest
Dannevirke 32.6 Feb-4th 1951 3rd-highest
Hastings 35.5 Feb-4th 1965 3rd-highest
Ohakune 30.1 Jan-26th 1962 3rd-highest
Motueka (Riwaka) 33.1 Jan-23rd 1956 3rd-highest
Kaikoura 34.1 Feb-4th 1963 3rd-highest
Five Rivers 30.8 Jan-24th 1982 3rd-highest
South West Cape 26.8 Jan-24th 1991 3rd-highest
Paeroa 32.2 Jan-26th 1947 Equal 3rd-highest
Appleby 31.3 Feb-2nd 1932 4th-highest
Lumsden 30.6 Jan-24th 1982 Equal 4th-highest
Low records or near-records
Clyde 10.3 Dec-17th 1978 2nd-lowestAlexandra 10.0 Dec-17th 1930 3rd-lowest
Roxburgh 10.5 Dec-17th 1950 Equal 4th-lowest
Balclutha (Finegand) 12.1 Dec-17th 1972 Equal 4th-lowest
Record or near-record daily minimum air temperatures for summer were recorded at:
Location Extreme Date of Year records Comments
minimum extreme began
(°C) temperature
Low records or near-records
Turangi -0.3 Dec-11th 1968 3rd-lowest
Boyle River -0.9 Dec-14th 1983 Equal 3rd-lowest
High records or near-records
Akaroa 23.8 Feb-3rd 1978 Highest
Blenheim 22.0 Feb-4th 1947 Highest
Cheviot 24.5 Feb-3rd 1982 Highest
Lake Tekapo 21.5 Feb-3rd 1928 Highest
Le Bons Bay 21.5 Feb-3rd 1984 Highest
Masterton (Airport) 22.2 Feb-4th 1943 Highest
Rangiora 22.1 Feb-3rd 1972 Highest
Upper Hutt (Trentham) 21.4 Feb-4th 1972 Highest
Waiau School 24.4 Feb-3rd 1974 Highest
Waipara West 24.1 Feb-3rd 1973 Highest
Appleby 20.5 Feb-2nd 1941 Equal highest
Arthurs Pass 16.3 Jan-27th 1978 2nd-highest
Martinborough 21.7 Feb-4th 1986 2nd-highest
Medbury 23.2 Feb-3rd 1927 2nd-highest
Milford Sound 18.2 Feb-3rd 1935 2nd-highest
Wanaka 20.3 Feb-3rd 1972 Equal 2nd-highest
Alexandra 18.7 Jan-25th 1992 3rd-highest
Five Rivers 19.5 Feb-2nd 1982 3rd-highest
Mahia 20.4 Jan-29th 1990 3rd-highest
Greymouth (Airport) 18.5 Feb-4th 1972 Equal 3rd-highest
Arapito 19.0 Feb-4th 1978 4th-highest
Ashburton (Airport) 21.5 Feb-17th 1928 4th-highest
Culverden 22.3 Feb-3rd 1930 4th-highest
Hanmer Forest 21.5 Feb-17th 1972 4th-highest
Kaikoura 20.3 Feb-3rd 1972 4th-highest
Takapau Plains 19.6 Feb-3rd 1972 4th-highest
Hastings 21.5 Jan-30th 1972 Equal 4th-highest
Ngawi 22.7 Feb-3rd 1972 Equal 4th-highestWind
On 3 December, strong winds forced the cancellation of approximately 40 flights to and from
Wellington Airport.
On 17 December, severe thunderstorms produced two tornadoes in Waikato. The first struck near
Waihou shortly after midday, damaging a farm shed and snapping trees. The second occurred south
of Te Awamutu around 6 p.m., with one local reporting roofs off buildings, windows and wall
cladding damage to two sheds, approximately 40 large trees downed and damage to neighbouring
properties.
On 6 January, strong winds hit many parts of the country. In Dunedin, a woman was taken to
hospital with serious injuries after a tree fell on her at Albany Street. Firefighters attended 45
weather-related incidents in the Dunedin area, with lifting roofs, downed trees and downed
powerlines reported. More than 2500 homes had lost power.
On 6 January, powerlines were toppled by winds in Manawatu-Whanganui, with more than 7,100
homes suffering power outages particularly in the areas of Taihape, Rongotea, Kairanga, Marton,
southern Fielding, Āpiti, Aokautere and Bunnythorpe.
The highest wind gust was 196 km/h, observed at Cape Turnagain on 5 January.
Record or near record summer extreme wind gusts were recorded at:
Location Extreme Date of Year Comments
wind gust extreme records
(km/hr) gust began
Secretary Island 165 Feb-16th 1994 Highest
Oamaru 106 Jan-30th 1984 Highest
Gore 130 Jan-30th 1987 Highest
South West Cape 178 Jan-30th 1991 2nd-highest
Levin 93 Dec-8th 1971 Equal 2nd-highest
Invercargill Aero 120 Jan-30th 1972 Equal 2nd-highest
Dannevirke 93 Dec-20th 1961 3rd-highest
Napier Aero 104 Dec-3rd 1973 3rd-highest
Brothers Island 133 Dec-20th 1997 3rd-highest
Manapouri Aero 85 Jan-31st 1991 3rd-highest
Upper Hutt (Trentham) 95 Dec-3rd 1999 Equal 3rd-highest
Blenheim (Airport) 100 Jan-6th 1972 4th-highest
Hamilton 83 Dec-3rd 1978 Equal 4th-highest
Palmerston North 95 Jan-6th 1991 Equal 4th-highest
Winchmore 100 Dec-4th 1970 Equal 4th-highest
Lightning and hail
On 8 December, over 300,000 lightning strikes occurred around New Zealand and offshore waters
associated with the passage of an active front. Lightning set trees on fire in Akatarawa (near Upper
Hutt) and Martinborough. Farther south, lightning and hail struck Dunedin during the afternoon.
Fire crews were called to fires in Green Island and Outram, which were believed to have beencaused by lightning strikes. Lightning struck the Dunedin Airport power centre, knocking out the airfield lighting system temporarily. On 23 February, thunderstorms brought small hail to the Tauranga area, including Whakamarama and Mt Maunganui. Cloud and fog Significant smoke and haze from Australian bushfires affected New Zealand for several days starting 1 January. This peaked in the North Island on 5 January before a southerly change pushed the particulates northward on 6 January On 19-20 January, low cloud and fog disrupted flights at Wellington Airport. More than 30 flights were cancelled out of the capital on 19 January with several more cancellations reported on 20 January. The fog, which settled as low as 200 feet, was associated with a humid air mass and light winds. On 18 February, fog at Nelson Airport caused several cancellations and diversions. One inbound flight from Auckland was cancelled, along with several departing flights to Wellington and Auckland. In addition, some other Nelson-bound flight were instead diverted to Blenheim Airport. Snow and Ice On the morning of 6 January, Southlanders woke to snow on the hilltops (to 1500m) as a January cold snap continued. For further information, please contact: Chris Brandolino Principal Scientist – Forecasting, NIWA Auckland Tel. 09 375 6335 For climate data enquiries, please contact: John-Mark Woolley Climate Research Scientist, NIWA Auckland Tel. 09 375 4502
Summer 2019-20 rainfall, expressed as
                                   percentage of the 1981-2010 normal.

                                   Summer rainfall was below to well below
                                   normal for most of the North Island and
                                   drought conditions became widespread.
                                   Conversely, periods of heavy rain in parts
                                   of the lower South Island resulted in
                                   summer rainfall totals that were above to
                                   well above normal and flooding occurred
                                   in several locations.

        https://www.niwa.co.nz/our-science/climate

                  © Copyright NIWA 2020.

All rights reserved. Information presented in this summary is
based on data available at the time of publication, which is
subject to ongoing quality assurance procedures.
You can also read