IMPROVING BROWN STOCK WASHING BY ON-LINE MEASUREMENT - MILL INVESTIGATIONS
←
→
Page content transcription
If your browser does not render page correctly, please read the page content below
Technical Article / Peer-reviewed Article
                                                                                                 O PAPEL vol. 73, num. 1, pp. xx - xx JAN 2012

Improving brown stock washing by on-line
measurement – Mill investigations
Authors*:      Riku Kopra1
               Erkki Kari2
               Marko Harinen3
               Tapio Tirri4
               Olli Dahl5

Keywords: Hi-Heat washing, pulp washing, refractometer, washing            It also has a positive effect on pulp quality and prevents deposition
loss, washing optimisation                                                 problems /3/.
                                                                              The brown stock washing system is always mill dependent. It
ABSTRACT                                                                   starts with cooking (Hi-Heat) and is followed, mainly in series,
   The aim of the study was to examine and improve the brown               by various equipments such as a Drum Displacer (DD), a vacuum
stock washing result and efficiency. It was done by utilizing real-        filter, a diffuser, a press filter, which use either dilution/thickening
time measurement devices and a monitoring system created                   or displacement washing principles or their combination. The
for the purpose. Research work was carried out by installing 12            target is to connect these different washing equipments in a series
refractometers in the brown stock washing line at a Finnish kraft          and attain as good a washing result as possible with a minimum
pulp mill. Refractometers continuously measure the dissolved               amount of used wash water /1/.
solid contents of filtrate fractions. The refractometers and created          Brown stock washing also plays a key role in oxygen delignification
monitoring system enabled the continuous evaluation of a washing           performance. Washing before oxygen delignification is important,
result. The results indicated that the amount of washing loss had a        because a high incoming wash loss into the oxygen delignification
clear influence on the performance of oxygen delignification, which        reduces pulp strength and consumes oxygen and alkali. Washing
was observed from the oxygen delignification’s kappa reduction,            after oxygen delignification is also very important, as it minimizes
chemical consumption and reactor’s temperature. The results also           the amount of detrimental organic wash loss and cooking chemicals
indicated that by utilizing measurements it could be possible to           entering bleaching. When the amount of washing loss is high
control washers operation and then reduce washing losses from              in the bleaching feed, more bleaching chemicals are consumed.
brown stock washing substantially. Results show that it is possible        With washing after oxygen delignification the economy and the
to evaluate the efficiency and the result of brown stock washing           environmental friendliness of the whole fibre line is improved /4/.
by utilizing continuous refractometer measurements and advanced               The parameters used to describe the performance of washing
data-analyzing tools. However, it is not simple and many variables         or its effectiveness can be divided into two categories: wash loss
should be noted if the aim is to develop and utilize a continuous          and dilution factor. Wash loss is defined as the amount of washable
monitoring system more efficiently.                                        compounds in the pulp suspension that could have been removed
                                                                           in washing /5/. The dilution factor represents the net amount of
INTRODUCTION                                                               water that is added during washing. The latter has been primarily
   In chemical pulping, the primary reason for brown stock washing         used for running brown stock washing in the mills, since the water
is to remove soluble impurities using a minimal amount of water            balance control should be kept in good condition to avoid unwanted
(as this water must be evaporated later on). Pulp is also washed to        spills from the liquor tanks. Nowadays the water balance controlling
recover valuable cooking chemicals and organic chemicals, which are        systems are more advanced in this respect, and more attention is
recovered for their heating value /1/. Efficient washing improves the      paid to measuring wash loss.
recovery of spent chemicals, reduces the consumption of reagents in           Traditionally wash losses are evaluated by measuring individual
the subsequent bleaching and limits effluent load from the plant /2/.      parameters such as COD, TOC, sodium content, conductivity, etc.,

*Authors’ references:
1. Mikkeli University of Applied Sciences, Savonlinna, Finland
2. Aalto University, School of Science and Technology, Helsinki, Finland
3. Stora Enso Pulp Supply, Pulp Competence Centre, Imatra, Finland
4. Mikkeli University of Applied Sciences, Savonlinna, Finland
5. Aalto University, School of Chemical Technology, Espoo, Finland
Corresponding author: Riku Kopra. E-mail: riku.kopra@mamk.fi

                                                                                                 janeiro/January 2012- Revista O Papel           79
Technical Article / Peer-reviewed Article
O PAPEL vol. 73, num. 1, pp. xx - xx JAN 2012
and connecting them to mathematical calculations to measure The refractive index depends on the concentration of dissolved
mainly displacement ratio values (DR) or Norden efficiency factor, solids. In general, the bigger the molecular size of the dissolved
(E-values). However, the traditional parameters are not adequate solids the bigger the refractive index per concentration unit is.
enough to evaluate the real washing loss in real time /5,6,7/. The The measurement accuracy is not influenced by particles, bubbles,
latest results /8,9,10/ have shown that refractometer measurements fibres, color or temperature changes in the process medium.The
can be used to solve this dilemma. The refractometer measures the laboratory reference temperature is usually 20°C or 25°C. Due
concentration of washable liquid substances in real-time. It detects to the wavelength dependency, the refractive index is measured
very well dissolved organic and inorganic materials, which have high with monochromatic light. The measurement principle behind the
refractive index (for example lignin, sodium, chloride and sulfate) measurement of dissolved dry solids content through refraction
which are also mainly responsible of wash loss in chemical pulping. has been presented in detail in our earlier studies /8,10/.
The experimental part studies the possibilities to improve and
monitor the performance of a brown stock washing line by utilizing Software tool used for process analysis
continuous refractometer measurements and advanced process data Wedge is a software commercial tool (developed by Savcor Forest
analyzing tools. One of the aims was to build a monitoring system, Ltd.) designed for the management of process data and the analysis
which can be utilized to analyze the result and efficiency of the of process fluctuations. It consists of mathematical tools /11/ which
washing line. The benefits of the monitoring system were studied by makes it possible to monitor and analyze process fluctuations
carrying out trial runs in different washers. systematically. One of the Wedge’s advantages is that it consists of
tools to overcome lag times. By utilizing Wedge it is possible to collect
and analyze a mill’s process data continuously and historically. If
Materials and methods necessary, it is possible to remove faulty measurement periods from
the process data /11/.
Refractive index measurement principle
The refractometer measures analyze concentrations in Installation of the Refractometers
solutions based on a measurement of the refractive index. The research was carried out by installing 12 continuous refrac-
Refractive index measurement is actually a measurement of tometers, which measured concentration levels, i.e. total dissolved
the speed of light in a medium. The speed of light in a medium solids of filtrates, in the brown stock washing line at a Finnish kraft
depends on the medium itself, temperature and wavelength. pulp mill, Figure 1. Measurement devices were installed to allow the
Figure 1. Installation sites of the refractometers at the pulp mill’s brown stock washing line
80 Revista O Papel - janeiro/January 2012Technical Article / Peer-reviewed Article
O PAPEL vol. 73, num. 1, pp. xx - xx JAN 2012
Table 1. Installation sites and the signs of the refractometers
Wash liquor and wash filtrate measurements
Installation site Model Sign
Pressure diffuser 1, wash filtrate PR-23 K1
Pressure diffuser 2, wash filtrate PR-23 K2
Pressure diffusers 1 & 2, wash liquor PR-23 K3
Double filter, wash filtrate PR-23 O1
Double filter, wash liquor PR-23 O2
Digester, wash liquor PR-01 R4
Digester, extraction liquor PR-01 R5
Liquor in pulp measurements (in-line refractometers)
Installation site Model Sign
Wash press, pulp in PR-01 R1
Double filter, pulp out PR-01 R2
Screening, pulp in PR-01 R3
Pressure diffuser 1, pulp out PR-23 R6
Pressure diffuser 2, pulp out PR-23 R7
Wash press, pulp out PR-23 R8
evaluation of the efficiency and performance of the washing line. In
addition, Table 1 defines more precisely the installation sites.
Before trial runs, the refractometers were calibrated in coop-
eration with the refractometer supplier. Calibration was made by
taking liquor samples from all the installation points. The samples
were taken from both hardwood and softwood campaigns. From
the pulp samples the liquor was squeezed out before analyzing,
which was done about half an hour after sampling. The amounts
of dissolved solids were analyzed by using SCAN-N 22:77. All the
calibration analyses were made in the pulp mill’s laboratory.
After the analyses the refractometers were calibrated to match
the laboratory analysis results. Different wood species have di-
fferent refractive index calibration curves. Despite that, different
calibration curves between wood species were not used in this
work. This is due to the fact that sufficiently accurate calibration
was achieved without that procedure. Furthermore, campaigns
between hardwood and softwood species are short at the experi- Figure 2. A screenshot from the flow sheet created in Wedge
mental pulp mill, e.g. softwood campaigns often last less than a
day. As a result, equilibrium in the filtrate tanks between different
wood species is not clear. and dilution factors in the washing line. Process data were collected
The washing result analyses and calculation of different factors in Wedge from the mill’s data acquisition system. Two different time
defining the performance of the washing line were carried out by domains in the data acquisition were used, i.e. a minute average
utilizing Wedge. For instance, E-value calculations were created in and an hour average. In Figure 2 a screenshot from the flow sheet
Wedge. In addition, Wedge was utilized to calculate liquor balances created in Wedge is represented.
janeiro/January 2012- Revista O Papel 81Technical Article / Peer-reviewed Article
O PAPEL vol. 73, num. 1, pp. xx - xx JAN 2012
Calculations amount of extracted filtrate from the wash circulation was about
The actual process E-value (APE-value) /12/ with fixed consistency, 0,7 t/BDt of pulp during the trial. Furthermore, the dilution factor
i.e. 10% consistency, is defined in equation 1 of the digester washing was increased with the same amount.
The digester’s dilution factor before the trial run was around 0,2
t/BDt. There were neither big changes nor complications in the
, where (1) digester’s runnability during the trial period or after the trial
period. For instance, the blow consistency and the chip level
were quite constant.
L1 = washed pulp stream, tons of liquor/o.d. ton of washed pulp The effect of the downward velocity of the screen on the
x1 = concentration of dissolved solids in washed pulp stream, kg pressure diffusers’ washing efficiency was studied by changing
dissolved solids/ton of liquor the set point of the screen velocity. The effect of the screen
y1 = concentration of dissolved solids in wash liquor stream, kg velocity was studied by slowing down the velocity stepwise.
dissolved solids/ton of liquor The experiments were carried out both with hardwood and
y2 = concentration of dissolved solids in outlet liquor stream, kg softwood.
dissolved solids/ton of liquor Furthermore, the effect of the dilution ratio on the pressure
diffusers’ washing efficiency was studied. This was done by
The dilution factor (DF) can be calculated from equation 2 increasing the set point of the dilution ratio.
, where (2)
RESULTs AND DISCUSSION
L0 = unwashed pulp stream, tons of liquor/o.d. ton of washed pulp
V2 = wash liquor stream, tons of liquor/o.d. ton of washed pulp Washing in the digester
V1 = filtrate stream, tons of liquor/o.d. ton of washed pulp Figure 3 shows the washing loss from the digester and the
amount of extraction from wash circulation. The field between the
The washing loss can be calculated from equation 3 black lines indicates the period when liquor from wash circulation
was extracted, i.e. the trial period.
(3) As can be seen from Figure 3, the amount of washing loss
decreased during the trial. However, more noticeable is that after
The pressure diffuser’s dilution ratio can be calculated from the trial period the washing loss started to increase notably. As
equation 4 a result, it can be said that the digester’s washing efficiency can
be increased by enhanced radial displacement washing, which
(4) occurs in the wash circulation screen.
Performance of the experiments
During the experimental part, the main raw materials used at
the pulp mill were birch and pine. A minor part of the softwood
raw material comprised spruce, i.e. around 15%. Below are repre-
sented the trial runs carried out around the digester washing and
the pressure diffusers.
The main idea in the digester washing trials was to improve the
utilization of wash water circulation in the digester. The purpose
was to improve radial displacement washing which occurs on the
wash circulation screen. This is done by increasing the amount
of wash liquor fed into the digester and by extracting the same
amount of filtrate from the wash circulation. The excess amount
of wash liquor was introduced into the central distribution
chamber. In addition, the amount of digester washing bypass was
decreased simultaneously, (see Figure 1). Figure 3. Washing loss from the digester and the amount of extraction
from wash circulation. The field between the black lines indicates the trial
In this trial the wash water circulation was utilized for period when the digester’s dilution factor was increased and extraction
approximately 10 hours within one hardwood campaign. The from the wash circulation was utilized. Hardwood, 1035 BDt/d
82 Revista O Papel - janeiro/January 2012Technical Article / Peer-reviewed Article
O PAPEL vol. 73, num. 1, pp. xx - xx JAN 2012
11,50
10,50
DS-content, (%)
9,50
8,50
7,50
6,50
24.7.2009 11:31 24.7.2009 19:46 25.7.2009 4:01
Liquor in blow Wash liquor to digester Wash liquor to PDs
Figure 4. Dissolved solid contents of blow pulp suspension, wash liquor Figure 6. The effect of the downward velocity of the screen on the pres-
to the digester and the pressure diffusers. The field between the black sure diffuser’s washing efficiency. Hardwood, the production rate to pres-
lines indicates the trial period when the digester’s dilution factor was in- sure diffuser 1 was 520 BDt/d
creased and the extraction from wash circulation was utilized. Production
rate was 1035 BDt/d, hardwood
Figure 4 represents the dissolved solid contents of liquor with to the fact that other variables affecting the washing performance
blow pulp, wash liquor to the digester and wash liquor to the were not correctly adjusted.
pressure diffusers from the same trial run. Figure 6 represents the effect of the downward velocity of the
As can be seen from Figure 4, the concentrations of different pressure diffuser screen on the washing efficiency. Furthermore,
liquor fractions decreased during the trial. On the contrary, the Figure 7 demonstrates the effect of the downward velocity of the
concentrations started to increase after the end of the trial. This pressure diffuser screen on the washing loss from the same trial run.
supports that the trial run had a favorable effect on the digester’s From Figures 6 and 7 one can notice that the downward velocity
washing result. of the screen notably affects the pressure diffusers washing result. In
this trial run the E10-value increased linearly from around 1 to 5 when
the downward velocity of the screen was slowed down. At the same
Washing before oxygen delignification time, the washing loss from the pressure diffuser decreased notably.
Figure 5 represents the effect of the pressure diffusers feed From the results reached, it can be stated that when the downward
consistency on the washing efficiency. velocity of the screen is adjusted to too high a level the washing
As can be observed from Figure 5, with a higher feed consistency efficiency of the pressure diffuser deteriorates.
the washing efficiency increased. The results attained were similar to The optimum downward velocity of the screen always depends
what we /10/ obtained in our mill investigations with a pressure filter. on the velocity of the pulp. The velocity ratio between the screen
However, in this example the pressure diffuser’s washing efficiency and the pulp should be close to 1. If the velocity of the screen is too
was unsatisfactory even if the feed consistency was high. This is due fast compared to that of the pulp flow, it leads to the formation of a
1,8
1,6
1,4
1,2
E10
1,0
0,8
0,6
0,4
9,0 9,5 10,0 10,5 11,0 11,5 12,0
Feed consistency, (%)
Figure 5. The effect of the feed consistency on the pressure diffuser’s Figure 7. The effect of the downward velocity of the screen on the pres-
washing efficiency. Hardwood, 1080 BDt/d sure diffuser’s washing loss
janeiro/January 2012- Revista O Papel 83Technical Article / Peer-reviewed Article
O PAPEL vol. 73, num. 1, pp. xx - xx JAN 2012
1,8
1,6
1,4
1,2
E10
1,0
0,8
0,6
0,4
9,0 9,5 10,0 10,5 11,0 11,5 12,0
Feed consistency, (%)
Figure 8. The effect of the dilution ratio on the pressure diffuser’s Figure 10. The effect of the washing loss on the oxygen reactor temperature
washing efficiency. Softwood, the production rate to pressure with softwood. An hour average from June 2009 to August 2009
diffuser 1 was 450 BDt/d
thinner pulp web. By increasing the velocity difference, the risk of a with hardwood. When the amount of washing loss in the oxygen
web breakage also increases. However, it is also possible to adjust the delignification feed increases the kappa reduction decreases. This is
downward velocity of the screen too slow, which can cause plugging due to the fact that oxygen is consumed in the oxidation reactions of
of the screen. The pressure in the web increases resulting in local the washing loss. In other words, the selectivity and performance of
dewatering when the velocity of the screens downward movement is the oxygen delignification decrease as the amount of washing loss
lower than that of the inlet pulp /13/. The results attained are similar increases. The biggest deterioration of the oxygen delignification’s
to those obtained by Lysen /13/ in his calculation from mill data with kappa reduction was when wash loss increased from a value of 250 to
pressure diffuser. Lysen has demonstrated that the optimum velocity 300 kgDS/BDt. The wash loss should therefore be less than 250 kgDS/
ratio is slightly higher than one being from 1.1 to 1.3. BDt to guarantee unimpeded oxygen delignification performance in
Figure 8 demonstrates the effect of the pressure diffuser’s dilution this experimental mill.
ratio on the washing efficiency. Miller et al., /14/ obtained quite similar results to us. They have
From Figure 8 it can be seen that by increasing the dilution ratio shown that the retardation of delignification is approximately one
the washing efficiency can be increased. The reason for this is that kappa unit when the total solids carry-over to the oxygen stage is
the dilution ratio set point affects the dilution factor value. Even if increased by 50 kgDS/BDt.
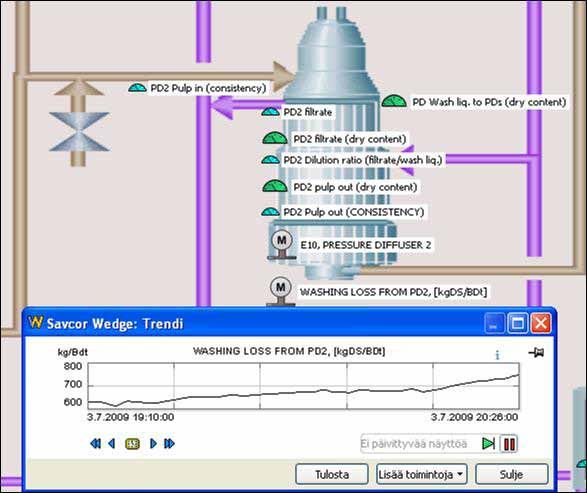
the amount of wash liquor, i.e. V2, is kept the same, the dilution factor Figure 10 represents the effect of the washing loss on the oxygen
increases when the dilution ratio set point is increased. This is due to reactor’s temperature with softwood.
the fact that discharge consistency and the amount of wash filtrate From Figure 10 it can be noticed that the temperature in the oxygen
increase since the dilution ratio is increased. reactor correlated clearly with the amount of washing loss. As the
Figure 9 represents the effect of the washing loss on the oxygen washing loss to oxygen delignification increased, the temperature
delignifications response. in the oxygen reactor increased. The temperature in the oxygen
As can be observed from Figure 9, the oxygen delignification delignification tower can increase and thus accelerate unselective
response was highly affected by the amount of washing loss reactions in the fibre because of the residual alkali present in the
black liquor and the exothermal oxidation reactions /15/. In addition,
the high washing loss level may increase the amount of hydroxyl
radicals, which has a negative effect on the cellulose degradation
and viscosity loss /5/.
CONCLUSIONS
It is possible to evaluate the efficiency and the result of brown
stock washing by utilizing continuous refractometer measurements
and advanced data-analyzing tools. However, it is not simple and
many variables (production rate, flow rate and consistency measu-
rements, time-delays, etc.) should be noted if the aim is to develop
and utilize a continuous monitoring system more efficiently. The re-
Figure 9. The effect of the washing loss on the oxygen delignification’s
kappa reduction. Hardwood, production rate from 1035 to 1125 BDt/d sults indicated that the efficiency of the digester washing can be
84 Revista O Papel - janeiro/January 2012Technical Article / Peer-reviewed Article
O PAPEL vol. 73, num. 1, pp. xx - xx JAN 2012
increased by utilizing a wash circulation and the extraction from the lignification and to bleaching. In the future it is recommendable to
wash circulation more efficiently. The results also indicated that the utilize refractometers in the washing line and bring higher level pro-
washing efficiency of the pressure diffusers depends outstandingly cess optimization, e.g. at the whole washing department. Good posi-
on the downward velocity of the screen. By controlling the screen ve- tions to measure the washing loss are at least at the blow pulp, pulp
locity correctly the washing efficiency can be increased considerably. after a pre-oxygen washing and pulp after a post-oxygen washing.
In addition, the set point of the dilution ratio has a great influence on
the pressure diffusers’ washing performance. Also, the oxygen delig- Acknowledgments
nification response is highly affected by the amount of the washing This study was initiated under a contract between Mikkeli Uni-
loss, which was observed from the oxygen delignification’s kappa re- versity of Applied Sciences, Aalto University, Department of For-
duction, chemical consumption and reactor’s temperature. However, est Products Technology, K-patents OY and Stora Enso OYj. This
by utilizing refractometers and data-analyzing tools it is possible to work was financed partially by the Finnish Cultural Foundation’s
discover the black spots in the washing line and evaluate a washing South Savo Regional Fund. Thanks also to Mr John Christison and
result continuously. In other words, it enables the improvement of Seppo Tammiruusu for revising the English of the manuscript.
the washer’s efficiency and reduce the wash loss level to oxygen de- The authors are grateful to all participants.
References
1. Crotogino R.H., Poirier N.A., Trinh D.T. (1987), The principles of pulp washing, Tappi Journal, 70(6):95-103.
2. Tervola P., Gullichsen J. (2007), Confidence limits in mass balances with application to calculation of pulp washing efficiency, Appita
Journal, 60(6):474-481.
3. Wilson J. (1993), Results from improved brown stock washing, TAPPI Pulping Conference, Proceedings, pp155-157.
4. Andbacka, S., (1998), The importance of washing in oxygen delignification and TCF bleaching, Pulp & Paper Canada, 99(3):57-60.
5. Sankari, M. (2004), Real wash loss compounds in Kraft pulp delignification and bleaching, Doctoral thesis, University of Oulu,
Department of Chemistry, Oulu, Finland, p.53.
6. Sillanpää, M. (2005), Studies on washing in Kraft pulp bleaching, Doctoral thesis, University of Oulu, Department of Process and
Environmental Engineering, Oulu, Finland, p.41.
7. Bottan, G. (1993), Is COD test a wash-out on washing? Pulp Pap. Intl.35(3):.51
8. Kopra R., Tirri, T., Dahl, O. (2008), Refractive index measurements for brown stock washing loss – laboratory investigations, Appita
Journal, 61(5): 408-412.
9. Kopra R., Helttunen J., Tervola P., Tirri T. and Dahl O. (2010), Refractive index measurements for brown stock washing loss - mill
investigations, Appita Journal 62(2):131136.
10. Kopra R., Karjalainen S., Tirri T. and Dahl O. (2010), Optimization of pressure filter performance by refractometer - Mill investigations,
64th Appita Annual Conference Proceeding pp 207-214, Melbourne, Victoria, Australia, 19.-22.4.2010.
11. Anon. (2007), Savcor Wedge V.6.1 User’s Manual. Savcor Forest Oy, p 273.
12. Haapamäki, P.O. (1979), Modified Norden’s method for pulp washing calculations, Chemical Workshop, Montreal, p.26.
13. Lysen C. (1987), Control of screen velocity – The key to pressure diffuser washing efficiency, Pulp washing symposium 1987, Proceedings
pp 321-333 Maarianhamina, Finland, May 18-21, 1987, The Finnish Pulp and Paper Research Institute, The Finnish Paper
Engineers’ Association.
14. Miller W. J., Shackford L. D., Jiang H. & Genco J. (1991), Effect of entrained black liquor carry-over on medium-consistency oxygen
delignification, Tappi Journal, 74(2):117-122.
15. Vuorenvirta K., Fuhrmann A., Gullichsen J. (2000), Effect of black liquor carry-over on selectivity of oxygen delignification, International
Pulp Bleaching Conference, Proceedings pp.65-70, Halifax, Canada.
janeiro/January 2012- Revista O Papel 85You can also read