Utility of the simplified measurements of muscle mass in patients with gastrointestinal and chronic liver diseases - Nature
←
→
Page content transcription
If your browser does not render page correctly, please read the page content below
www.nature.com/scientificreports
OPEN Utility of the simplified
measurements of muscle mass
in patients with gastrointestinal
and chronic liver diseases
Hitomi Takada1,2,3*, Fumitake Amemiya1,2,3, Tomoki Yasumura1,2, Hiroki Yoda1,2,
Tetsuya Okuwaki1,2, Keisuke Tanaka1,2, Makoto Kadokura1,2 & Nobuyuki Enomoto2
Sarcopenia is an important prognostic factor in patients with gastrointestinal and chronic liver
diseases. Computed tomography and bioelectrical impedance analysis are the gold standards
for measuring skeletal muscle mass for the diagnosis of decreased muscle mass, but there are
some institutions where BIA and CT cannot be carried out. We evaluated the utility of simplified
methods for measuring muscle mass; the psoas muscle mass index (PMI) method, simple PMI
method, and arm muscle area (AMA) method. This retrospective study included 331 patients with
gastrointestinal diseases and 81 patients with chronic liver diseases who were admitted from June
2018 to December 2019 at Municipal Hospital of Kofu. The skeletal muscle mass was measured using
the PMI via the volume analyzer SYNAPSE VINCENT ver3.0, simple PMI based on CT imaging, and
AMA method. Positive correlations were found between muscle mass measured by PMI and simple
PMI, PMI and AMA, and simple PMI and AMA in patients with gastrointestinal diseases (correlation
coefficients = 0.76, 0.57, 0.47, respectively, p < 0.001). Positive correlations were observed between
muscle mass measured by PMI and simple PMI, PMI and AMA, and simple PMI and AMA in chronic liver
diseases (correlation coefficients = 0.77, 0.53, 0.45, respectively, p < 0.001). Measurement of muscle
mass by the AMA method showed some correlation with the PMI method. Measurement of muscle
mass by the simple PMI method showed correlation with the PMI method. These simplified methods
can be alternative methods of evaluating muscle mass in patients with gastrointestinal and chronic
liver disease.
Sarcopenia is a syndrome characterized by a decrease in skeletal muscle mass, skeletal muscle strength, and
physical function1. There are several diagnostic criteria for sarcopenia, including the European Working Group
on Sarcopenia in Older People (EWGSOP), the International Working Group on Sarcopenia (IWGS), the Asian
Working Group for Sarcopenia (AWGS) criteria, and the Japanese Society of Hepatology (JSH)2–7. All defini-
tions are based on decreased skeletal muscle mass and decreased function, and decreased skeletal muscle mass
is defined as myopenia. In the JSH criteria, patients with chronic liver disease are diagnosed with sarcopenia
if they have “decreased grip strength” and “decreased muscle mass” (as determined by computed tomography
(CT) or bioelectrical impedance analysis (BIA)-guided skeletal muscle mass index). CT and BIA are the gold
standards for measuring skeletal muscle mass available at present. Performing these examinations is difficult in
some institutions with no special software or equipment. Simplified methods for measuring muscle mass have
attracted attention in such clinical settings.
One of the simplified methods is the psoas muscle mass index (PMI) using CT images. This method is men-
tioned as an alternative method in the criteria from the J SH7. In particular, simple PMI can be obtained from CT
images immediately and easily. The second method uses anthropometric measurements to estimate the area of
the brachial muscle. Arm circumference (AC) and triceps skinfold thickness (TSF) are used to estimate muscle
1
Department of Gastroenterology and Hepatology, Municipal Hospital of Kofu, 366 Masutsubo‑cho, Kofu‑city,
Yamanashi 400‑0832, Japan. 2First Department of Internal Medicine, Faculty of Medicine, University of Yamanashi,
Yamanashi, Japan. 3These authors contributed equally: Hitomi Takada and Fumitake Amemiya. *email:
takadahi0107@gmail.com
Scientific Reports | (2020) 10:10795 | https://doi.org/10.1038/s41598-020-67847-0 1
Vol.:(0123456789)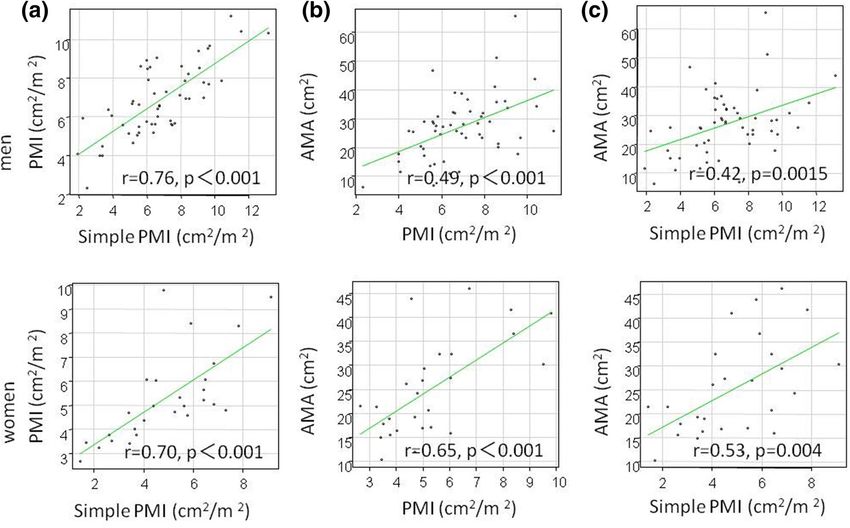
www.nature.com/scientificreports/
uscle8,9. In this study, the utility of the AMA
mass by calculating the arm muscle area (AMA) of the brachial m
method and the simple PMI method as simplified methods was verified.
Methods
Patients. This study targets 331 patients with gastrointestinal diseases who were admitted to our depart-
ment between June 2018 and December 2019 and whose muscle mass was measured using three methods: the
psoas muscle mass index (PMI) method, the simple PMI method, and the arm muscle area (AMA) method. The
patients with comorbidity malignancies other than gastrointestinal cancers were excluded. All patients provided
informed consent for this study, which was in compliance with the Declaration of Helsinki and was approved by
the ethics committee for clinical studies of Municipal Hospital of Kofu: Rinshoukenkyu-Rinrishinsa-Iinkai (in
Japanese), approval number 31–2).
Measurement of muscle mass and diagnosis using the PMI method and simple PMI
method. CT images taken during hospitalization or within one month before admission were used. SYN-
APSE Vincent volume analyzer version 3.0 was used in the PMI method as the sum of the areas of the iliopsoas
muscles on both sides at the level of the L3 vertebral body divided by the square of the height. The simple PMI
was obtained as the sum of the product of the long axis and the short axis of the iliopsoas muscles on both sides
at the level of the L3 vertebral body on CT divided by the square of the height. According to the diagnostic
criteria for sarcopenia in patients with liver disease from the JSH, the cut-off value for myopenia was a PMI of
6.36 cm2/m2 in males and 3.92 cm2/m2 in females, and a simple PMI of 6.0 cm2/m2 in males and 3.4 cm2/m2 in
females7.
Measurement of muscle mass and diagnosis using the AMA method. Measurements were per-
formed on the non-paralytic or non-dominant upper arm using an insert tape and an adipometer (ABBOTT
JAPAN). Arm circumference (AC) and triceps skinfold thickness (TSF) were measured at the level of the mid-
point between the acromial process of the scapula and the olecranon process of the ulna. All measurements
were performed three times, and mean values were used. Arm muscle circumference (AMC) and AMA were
calculated using the following equations. There are no standard values recommended as cut-offs for myopenia,
and 21.4 cm2 was used for males and 21.6 cm2 for females in this study as these are the cut-offs for undernutri-
tion in the general elderly population8,9. The percentage notation was calculated with reference to the Japanese
Anthropometric Reference Data (JARD2001).
AMC = AC − π × TSF.
AMA = AMC (cm) /4π – bone area (males 10 cm2, females 6.5 cm2).
2
Statistical analyses. Values were shown as means ± standard deviation (SD). Categorical variables were
subjected to Fisher’s test. Continuous variables were using unpaired Student’s t-tests. Pearson’s product rate cor-
relation was used to assess the correlation of continuous variables. The best cut-off values in receiver operating
characteristic (ROC) analyses were determined by the Youden index. P value < 0.05 was considered statistically
significant. All statistical analyses were performed using EZR (Saitama Medical Center, Jichi Medical University,
Saitama, Japan), a graphical user interface for R (The R Foundation for Statistical Computing, Vienna, Austria).
More precisely, it is a modified version of the R commander designed to include statistical functions frequently
used in biostatistics.
Results
Background characteristics of gastrointestinal disease patients. The background characteris-
tics of the 331 patients with gastrointestinal diseases who underwent muscle mass measurements are shown in
Table 1. The primary diseases included liver cirrhosis in 81 patients [including 54 patients with hepatocellular
carcinoma (HCC)], gastric or esophageal cancer in 34 patients, biliary or pancreatic cancer in 47 patients, colo-
rectal cancer in 29 patients, and benign disease in 140 patients. Benign diseases included colorectal adenomas
in 15 patients, gastrointestinal bleeding in 17 patients, enteritis and intestinal obstruction in 28 patients, chole-
docholithiasis in 38 patients, acute pancreatitis in 14 patients, and other benign diseases in 28 patients. The
median age was 74 ± 13 years old, with 206 (62%) males. Myopenia in patients with gastrointestinal diseases was
observed in 115 (35%) patients by PMI, 102 (31%) by simple PMI, and 123 (37%) by AMA. The frequency of
myopenia was significantly higher in patients with malignant tumors than in those without (24 vs. 5.7% by PMI,
p < 0.001, 37 vs. 25% by simple PMI, p = 0.017, 49 vs. 26% by AMA, p < 0.001). The frequency of myopenia did
not differ by BMI, blood test findings, or presence of comobidities in this study.
Comparisons between muscle mass measurement methods in patients with gastrointestinal
diseases. Positive correlations were found between muscle mass measured by PMI and simple PMI, PMI and
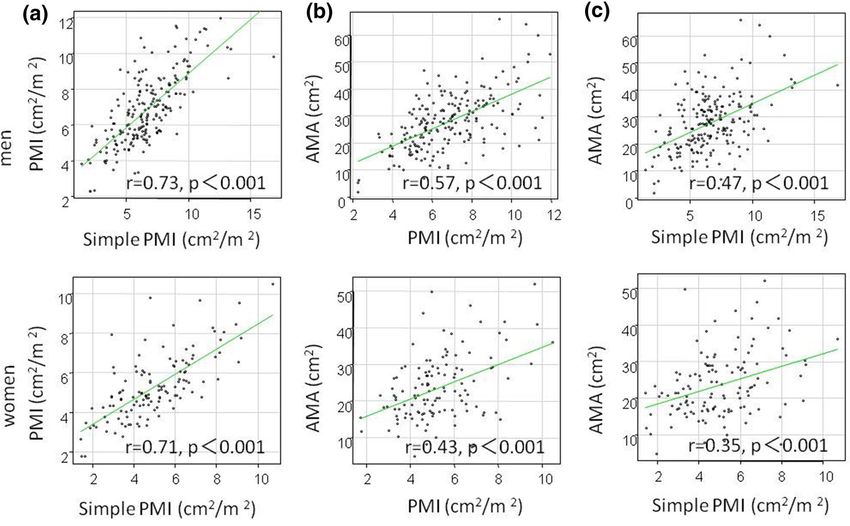
AMA, and simple PMI and AMA (correlation coefficients = 0.76, 0.57, 0.47, respectively, p < 0.001) (Fig. 1). Simi-
larly, in males (correlation coefficients = 0.73, 0.59, 0.48, p < 0.001) and females (correlation coefficients = 0.71,
0.43, 0.35, p < 0.001), a positive correlation between the three methods was observed (Fig. 2).
Background characteristics of chronic liver disease patients. The characteristics of chronic liver
disease patients are shown in Table 2. All patients had liver cirrhosis, and 54 patients also had HCC. The median
age was 75 ± 11 years old, with 54 (67%) males. Etiology of chronic liver disease was hepatitis B, hepatitis C, alco-
Scientific Reports | (2020) 10:10795 | https://doi.org/10.1038/s41598-020-67847-0 2
Vol:.(1234567890)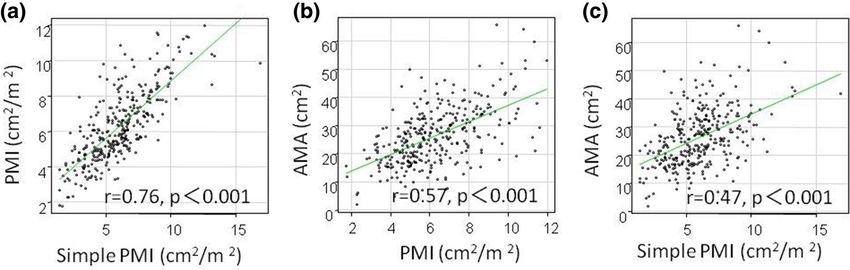
www.nature.com/scientificreports/

                                                                                     N = 331
                             Age: years, mean ± SD                                   74 ± 13
                             Men: n (%)                                              206 (62%)
                             BMI, mean ± SD                                          22 ± 4.2
                             Performance status: n (%)   0/1/2/3/4                   105/110/74/35/7 (32/33/22/11/3%)
                             %AC: %, mean ± SD                                       89 ± 13
                             %AMC: %, mean ± SD                                      95 ± 13
                             %AMA: %, mean ± SD                                      69 ± 26
                             Primary disease: n (%)      Chronic liver disease       81 (24%)
                                                         Gastroesophageal cancer     34 (10%)
                                                         Biliary pancreatic cancer   47 (14%)
                                                         Colorectal cancer           29 (9%)
                                                         Benign disease              140 (43%)
                             Comorbidities: n (%)        Heart disease               54 (17%)
                                                         Chronic lung disease        24 (7.3%)
                                                         Cerebrovascular disease     44 (13%)
                                                         Chronic renal disease       17 (5.2%)
                                                         Diabetes                    68 (21%)
                             Myopenia: n (%)             By PMI method               115 (35%)
                                                         By simple PMI method        102 (31%)
                                                         By AMA method               123 (37%)

                            Table 1.  Backgrounds of patients with gastrointestinal diseases. Continuous values are expressed as
                            mean ± standard deviation. BMI body mass index, AC Arm circumference, AMC Arm muscle circumference,
                            AMA Arm muscle area, PMI Psoas muscle mass index.

                            Figure 1.  Comparison between muscle mass measurement methods in 331 patients with gastrointestinal
                            diseases. (a) PMI and simple PMI, (b) PMI and AMA, (c) simple PMI and AMA.

                            hol, non-alcoholic steatohepatitis, and others in 5, 39, 16, 19, and 2 patients. Hepatic function was Child–Pugh
                            A, B, and C in 39, 32, and 10 patients. Myopenia was observed in patients with chronic liver disease in 29 (36%)
                            patients by PMI, 23 (28%) by simple PMI, and 29 (36%) by AMA.

                            Comparisons between muscle mass measurement methods in patients with chronic liver dis-
                            ease. Patients diagnosed with myopenia by the AMA method had significantly lower muscle mass by the
                            PMI method compared to patients without myopenia (males 5.6 ± 1.8 vs. 7.3 ± 1 0.6 cm2/m2, p = 0.001, females
                            4.2 ± 0.97 vs. 6.5 ± 1.9 cm2/m2, p < 0.001) and the simple PMI method (males 5.1 ± 2.1 vs. 7.4 ± 2.2 cm2/m2,
                            p = 0.001, females 3.8 ± 1.6 vs. 6.1 ± 1.5 cm2/m2, p < 0.001) (Fig. 3). Positive correlations were observed between
                            muscle mass measured by PMI and simple PMI, PMI and AMA, and simple PMI and AMA (correlation coef-
                            ficients = 0.77, 0.53, 0.45, respectively, p < 0.001) (Fig. 4). A positive correlation was also found among the three
                            methods, in males (correlation coefficient = 0.76 p < 0.001, 0.49 p < 0.001, 0.42, p = 0.0015) and females (correla-
                            tion coefficient = 0.70 p < 0.001, 0.65 p < 0.001, 0.53, p = 0.004), (Fig. 5).

                            Accuracy in identifying myopenia using simple PMI and AMA in chronic liver disease
                            patients. The reliability of simplified methods was as follows when the PMI method was assumed as the

Scientific Reports |   (2020) 10:10795 |                   https://doi.org/10.1038/s41598-020-67847-0                                          3

                                                                                                                                          Vol.:(0123456789)
www.nature.com/scientificreports/
Figure 2. Comparison between muscle mass measurement methods by sex in patients with gastrointestinal
diseases. (a) PMI and simple PMI, (b) PMI and AMA, (c) simple PMI and AMA.
gold standard method: the sensitivity of the simple PMI method was 62% (95% CI 42–79%), specificity was 90%
(95% CI 79–97%), the positive predictive value was 78% (95% CI 56–93%), and negative predictive value was
81% (95% CI 69–90%), while the sensitivity of the AMA method was 62% (95% CI 42–79%), specificity was 79%
(95% CI 65–89%), the positive predictive value was 62% (95% CI 42–79%), and negative predictive value was
79% (95% CI 65–89%). The cut-off values for predicting PMI-induced myopenia were 21.4 cm2 (AUROC 0.74,
95% CI 0.61–0.88) in males and 21.4 cm2 (AUROC 0.81, 95% CI 0.65–0.98) in females, respectively.
Discussion
Sarcopenia was proposed in 1989 by R osenberg1 and, to date, there have been several diagnostic c riteria2–6,10.
Skeletal muscle mass index (SMI) measured by BIA and CT is the current standard for skeletal muscle mass, and
sarcopenia is diagnosed in patients with chronic liver disease who have decreased grip strength (26 kg for males
and 18 kg for females) and myopenia with SMI measured by CT (42 cm2/m2 in males and 38 cm2/m2 in females)
or BIA (7.0 kg/m2 in males and 5.7 kg/m2 in females) in the JSH criteria7. In this study, we investigated the util-
ity of simplified methods that did not require special equipment or software for measuring muscle mass. There
was a positive correlation between muscle mass measured by the PMI method, simple PMI, and AMA method
in patients with gastrointestinal diseases and chronic liver disease. In particular, the reliability of AMA method
in diagnosing myopenia is not equal to PMI, but in institutions where CT cannot be done, we have thought that
the AMA method was alternative method for evaluating muscle mass.
The PMI method is an evaluation method using CT imaging, and is easy to use in patients with HCC in whom
CT scans are frequently performed in the follow-up. In the present study, PMI was calculated using the manual
trace method proposed by Vincent ver3.0. PMI has been reported to correlate with SMI using muscle mass
measuring software (r = 0.57, P < 0.01) and SMI measured by BIA (r = 0.74, P < 0.01)11–13. Additionally, simple
PMI is one of the simplified methods referred to in the JSH criteria. A positive correlation between simple PMI
and SMI has been reported (r = 0.57, p < 0.01)7.
The second simplified method of evaluating muscle mass is the AMA method; the method for estimating
the cross-sectional area of the brachial muscle using anthropometric measurements. It has been reported to be
strongly correlated with whole body skeletal muscle mass measured by dual energy X-ray absorptiometry and
AMA in the e lderly8. Moreover, there is reportedly a good correlation between AMA and grip strength in patients
waiting for liver transplantation (Spearman correlation 0.49, p < 0.01)14. Among elderly individuals over 70 years
and older, the mortality rate was reported to be higher in males with AMA ≤ 21.4 cm2 and ≤ 21.6 cm2 in f emales9.
However, overestimation of the AMA method has been reported as 15–25% over actual muscle mass, and a large
difference particularly in patients with thick subcutaneous fats was reported in the 1980–1990s8. A subsequent
2010 research reported that anthropometric AMA correlated well with CT-based AMA (r = 0.85, p < 0.001 in
Scientific Reports | (2020) 10:10795 | https://doi.org/10.1038/s41598-020-67847-0 4
Vol:.(1234567890)www.nature.com/scientificreports/
N = 81
Age: years, mean ± SD 75 ± 11
Men: n (%) 54 (67%)
BMI, mean ± SD 22 ± 3.7
Performance status: n (%) 0/1/2/3/4 19/31/21/8/2 (23/38/26/10/3%)
%AC: %, mean ± SD 90 ± 13
%AMC: %, mean ± SD 95 ± 14
%AMA: %, mean ± SD 70 ± 28
HCC: n (%) 54 (67%)
Etiology: n (%) HBV 5 (6.6%)
HCV 39 (48%)
Alcohol 16 (20%)
NASH 19 (23%)
AIH 1 (1.2%)
PBC 1 (1.2%)
Child–Pugh grade: n (%) A/B/C 39/32/10 (48/40/2%)
Ascites: n (%) 18 (22%)
Comorbidities: n (%) Heart disease 13 (16%)
Chronic lung disease 8 (9.9%)
Cerebrovascular disease 4 (4.9%)
Chronic renal disease 6 (7.4%)
Diabetes 23 (28%)
Oral medication: n (%) BCAA 24 (30%)
Diuretics 31 (38%)
Carnitine 6 (7.4%)
Myopenia: n (%) By PMI 29 (36%)
By simple PMI 23 (28%)
By AMA 29 (36%)
Albumin: g/dl, mean ± SD 3.4 ± 0.75
Total cholesterol: mg/dl, mean ± SD 179 ± 59
Total bilirubin: g/dl, mean ± SD 1.5 ± 1.5
γ-GTP: U/l, mean ± SD 140 ± 231
White blood cell: × 103/μl, mean ± SD 5.9 ± 2.8
Hemoglobin: g/dl, mean ± SD 12 ± 2.2
Platelet: × 103/μl, mean ± SD 157 ± 103
Neutrophil: %, mean ± SD 67 ± 13
Lymphophil: %, mean ± SD 23 ± 11
Prothrombin time: %, mean ± SD 80 ± 16
Table 2. Backgrounds of patients with chronic liver diseases. Continuous values are expressed as
mean ± standard deviation. BMI body mass index, AC Arm circumference, AMC Arm muscle circumference,
AMA Arm muscle area, HCC hepatocellular carcinoma, NASH nonalcoholic steatohepatitis, AIH autoimmune
hepatitis, PBC Primary biliary cholangitis, BCAAbranched-chain amino acid, PMI Psoas muscle mass index,
γ-GTP gamma- glutamyltransferase.
males and r = 0.90, p < 0.001 in females). Reproducibility and difficulty in establishing uniform cut-off values
across races have been r eported15. As a simplified anthropometric method other than the AMA method, a yubi-
wakka test in Japanese patients has been reported; however, it is largely affected by leg edema and o besity16–19.
In patients with chronic liver disease in whom edema of the lower legs is common, a determination based on
measurements of the lower legs would likely be difficult. Thus, anthropometric AMA measurements that can be
performed as a primary screening at any time and any place are helpful.
In this study, myopenia in patients with gastrointestinal diseases was found in 35% of patients with PMI,
31% with simple PMI, and 37% with AMA. Myopenia in patients with chronic liver disease was found in 36%
of patients with PMI, 28% with simple PMI, and 36% with AMA. In a large survey of the general Japanese
population, the incidence of sarcopenia was approximately 8% compared to 20% in individuals aged 65 years
and older20,21. The prevalence of myopenia in the field of gastrointestinal cancers has been reported to be high
at 26–65% for gastric and esophageal cancer22–26, 19–39% for colorectal cancer27,28, 21–63% for biliary and
pancreatic cancer29,30, 11–65% for H CC31–34. In esophagectomy cases, postoperative cardiovascular-related com-
plications, pulmonary complications, and mortality were significantly higher in patients with m yopenia22,23.
Sarcopenia in gastric cancer patients was associated with infection after surgery (odds ratio 9.0), independent
Scientific Reports | (2020) 10:10795 | https://doi.org/10.1038/s41598-020-67847-0 5
Vol.:(0123456789)www.nature.com/scientificreports/
Figure 3. Muscle mass by the PMI/simple PMI method depending on the presence or absence of myopenia
diagnosed by the AMA method in 81 patients with chronic liver diseases. (a) men and PMI, (b) men and simple
PMI, (c) women and PMI, (d) women and simple PMI.
Figure 4. Comparison between muscle mass measurement methods in 81 patients with chronic liver diseases.
(a) PMI and simple PMI, (b) PMI and AMA, (c) simple PMI and AMA.
ospitalization24,26.
factors for death within 1 year after surgery (hazard ratio 3.6), and factors related to long-term h
In colorectal cancer patients treated with chemotherapy, the frequency of grade 3–4 toxicity was high in patients
with sarcopenia, and the survival rate was significantly worse27,28. Myopenia in biliary and pancreatic cancer was
an independent risk factor for survival and recurrence, independent of cancer progression29,30. Myopenia has
been reported to be a prognostic factor independent of liver function in patients with compensated and early
decompensated cirrhosis31,35,36. In patients with HCC, myopenia has been reported to correlate with prognoses in
patients undergoing hepatectomy, liver transplantation, percutaneous radiofrequency ablation, or hepatic artery
embolization. In particular, the association between myopenia and dose intensity in patients taking molecular-
targeted drugs is of interest32,37. Screening myopenia is important for predicting prognoses and selecting treat-
ments for patients with gastrointestinal diseases and chronic liver disease. The number of patients with chronic
liver disease was small in our hospital, and sufficient statistical power was not obtained in this study. Assessment
in more patients and detailed evaluations are necessary in the future.
Scientific Reports | (2020) 10:10795 | https://doi.org/10.1038/s41598-020-67847-0 6
Vol:.(1234567890)www.nature.com/scientificreports/
Figure 5. Comparison between muscle mass measurement methods by sex in patients with chronic liver
diseases. (a) PMI and simple PMI, (b) PMI and AMA, (c) simple PMI and AMA.
Limitations of this study include its retrospective nature, the small sample size, and the lack of grip strength
measurements. The significance of myopenia has also been reported to vary by s ex38–43, but there were few
female patients and sufficient evaluation by sex could not be carried out in this study. The relationship between
myopenia and presence of comobidities and malignant tumors has not been adequately studied, and additional
searching is needed.
Muscle mass measured by the AMA method and simple PMI method showed some correlation with muscle
mass measured using the PMI method. In particular, the AMA method is a non-invasive muscle mass measure-
ment method that can be performed without radiation exposure, and can be performed conveniently at any
institution.
Conclusion
Measurements of muscle mass by the AMA method and simple PMI method are correlated with measurement by
the PMI method, and these methods can be simplified alternative methods of evaluating muscle mass in patients
with gastrointestinal diseases and chronic liver disease.
Received: 22 January 2020; Accepted: 16 June 2020
References
1. Rosenberg, I. H. Sarcopenia: Origins and clinical relevance. J. Nutr. 127(5 Suppl), 990S-S991 (1997).
2. Chen, L. K. et al. Sarcopenia in Asia: Consensus report of the Asian Working Group for Sarcopenia. J. Am. Med. Dir. Assoc. 15(2),
95–101 (2014).
3. Fielding, R. A. et al. Sarcopenia: an undiagnosed condition in older adults. Current consensus definition: prevalence, etiology, and
consequences. International working group on sarcopenia. J. Am. Med. Dir. Assoc. 12(4), 249–56 (2011).
4. McLean, R. R. et al. Criteria for clinically relevant weakness and low lean mass and their longitudinal association with incident
mobility impairment and mortality: the foundation for the National Institutes of Health (FNIH) sarcopenia project. J. Gerontol.
A Biol. Sci. Med. Sci. 69(5), 576–583 (2014).
5. Morley, J. E. et al. Sarcopenia with limited mobility: An international consensus. J. Am. Med. Dir. Assoc. 12(6), 403–409 (2011).
6. Muscaritoli, M. et al. Consensus definition of sarcopenia, cachexia and pre-cachexia: Joint document elaborated by Special Interest
Groups (SIG) “cachexia-anorexia in chronic wasting diseases” and “nutrition in geriatrics”. Clin. Nutr. 29(2), 154–159 (2010).
7. Nishikawa, H. et al. Japan Society of Hepatology guidelines for sarcopenia in liver disease (1st edition): Recommendation from
the working group for creation of sarcopenia assessment criteria. Hepatol. Res. 46(10), 951–963 (2016).
8. Saito, R. et al. Validity of mid-arm muscular area measured by anthropometry in nonobese patients with increased muscle atrophy
and variation of subcutaneous fat thickness. Eur. J. Clin. Nutr. 64(8), 899–904 (2010).
9. Miller, M. D. et al. Corrected arm muscle area: an independent predictor of long-term mortality in community-dwelling older
adults?. J. Am. Geriatr. Soc. 50(7), 1272–1277 (2002).
Scientific Reports | (2020) 10:10795 | https://doi.org/10.1038/s41598-020-67847-0 7
Vol.:(0123456789)www.nature.com/scientificreports/
10. Cruz-Jentoft, A. J. et al. Sarcopenia: European consensus on definition and diagnosis: Report of the European Working Group on
Sarcopenia in Older People. Age Ageing. 39(4), 412–423 (2010).
11. Hamaguchi, Y. et al. Proposal for new diagnostic criteria for low skeletal muscle mass based on computed tomography imaging
in Asian adults. Nutrition. 32(11–12), 1200–1205 (2016).
12. Yuri, Y. et al. Implication of psoas muscle index on survival for hepatocellular carcinoma undergoing radiofrequency ablation
therapy. J. Cancer. 8(9), 1507–1516 (2017).
13. Shirai, H. et al. Preoperative low muscle mass and low muscle quality negatively impact on pulmonary function in patients under-
going hepatectomy for hepatocellular carcinoma. Liver Cancer. 7(1), 76–89 (2018).
14. Marr, K. J. et al. Nutritional status and the performance of multiple bedside tools for nutrition assessment among patients waiting
for liver transplantation: A Canadian experience. Clin. Nutr. ESPEN. 17, 68–74 (2017).
15. Kim, M., Jeong, M. J., Yoo, J., Song, D. Y. & Won, C. W. Calf circumference as a screening tool for cognitive frailty in community-
dwelling older adults: The Korean Frailty and Aging Cohort Study (KFACS). J. Clin. Med. 7, 10 (2018).
16. Ishii, S. et al. Development of a simple screening test for sarcopenia in older adults. Geriatr. Gerontol. Int. 14(Suppl 1), 93–101
(2014).
17. Tanaka, T., Takahashi, K., Akishita, M., Tsuji, T. & Iijima, K. “Yubi-wakka” (finger-ring) test: A practical self-screening method
for sarcopenia, and a predictor of disability and mortality among Japanese community-dwelling older adults. Geriatr. Gerontol.
Int. 18(2), 224–232 (2018).
18. Hiraoka, A. et al. Easy surveillance of muscle volume decline in chronic liver disease patients using finger-circle (yubi-wakka) test.
J. Cachexia Sarcopenia Muscle. 10(2), 347–354 (2019).
19. Onishi, S. et al. Prevalence of sarcopenia and its relationship with nutritional state and quality of life in patients with digestive
diseases. J. Nutr. Sci. Vitaminol. (Tokyo). 64(6), 445–453 (2018).
20. Yoshida, D. et al. Using two different algorithms to determine the prevalence of sarcopenia. Geriatr. Gerontol. Int. 14(Suppl 1),
46–51 (2014).
21. Yoshimura, N. et al. Is osteoporosis a predictor for future sarcopenia or vice versa? Four-year observations between the second
and third ROAD study surveys. Osteoporos. Int. 28(1), 189–199 (2017).
22. Hodari, A., Hammoud, Z. T., Borgi, J. F., Tsiouris, A. & Rubinfeld, I. S. Assessment of morbidity and mortality after esophagectomy
using a modified frailty index. Ann. Thorac. Surg. 96(4), 1240–1245 (2013).
23. Nishigori, T. et al. Sarcopenia as a predictor of pulmonary complications after esophagectomy for thoracic esophageal cancer. J.
Surg. Oncol. 113(6), 678–684 (2016).
24. Fukuda, Y. et al. Prevalence of malnutrition among gastric cancer patients undergoing gastrectomy and optimal preoperative
nutritional support for preventing surgical site infections. Ann. Surg. Oncol. 22(3), S778-85 (2015).
25. Huang, D. D. et al. Sarcopenia predicts 1-year mortality in elderly patients undergoing curative gastrectomy for gastric cancer: A
prospective study. J. Cancer Res. Clin. Oncol. 142(11), 2347–2356 (2016).
26. Huang, D. D. et al. Impact of different sarcopenia stages on the postoperative outcomes after radical gastrectomy for gastric cancer.
Surgery. 161(3), 680–693 (2017).
27. Lieffers, J. R., Bathe, O. F., Fassbender, K., Winget, M. & Baracos, V. E. Sarcopenia is associated with postoperative infection and
delayed recovery from colorectal cancer resection surgery. Br. J. Cancer. 107(6), 931–936 (2012).
28. Jung, H. W. et al. Effect of muscle mass on toxicity and survival in patients with colon cancer undergoing adjuvant chemotherapy.
Support Care Cancer. 23(3), 687–694 (2015).
29. Okumura, S. et al. Visceral adiposity and sarcopenic visceral obesity are associated with poor prognosis after resection of pancreatic
cancer. Ann. Surg. Oncol. 24(12), 3732–3740 (2017).
30. Peng, P. et al. Impact of sarcopenia on outcomes following resection of pancreatic adenocarcinoma. J. Gastrointest. Surg. 16(8),
1478–1486 (2012).
31. Hanai, T. et al. Sarcopenia impairs prognosis of patients with liver cirrhosis. Nutrition. 31(1), 193–199 (2015).
32. Takada, H. et al. Impact of pre-sarcopenia in sorafenib treatment for advanced hepatocellular carcinoma. PLoS ONE 13(6),
e0198812 (2018).
33. Harimoto, N. et al. Sarcopenia is a poor prognostic factor following hepatic resection in patients aged 70 years and older with
hepatocellular carcinoma. Hepatol. Res. 46(12), 1247–1255 (2016).
34. Iritani, S. et al. Skeletal muscle depletion is an independent prognostic factor for hepatocellular carcinoma. J. Gastroenterol. 50(3),
323–332 (2015).
35. Ebadi, M. et al. Poor performance of psoas muscle index for identification of patients with higher waitlist mortality risk in cirrhosis.
J. Cachexia Sarcopenia Muscle. 9(6), 1053–1062 (2018).
36. Kang, S. H., Jeong, W. K., Baik, S. K., Cha, S. H. & Kim, M. Y. Impact of sarcopenia on prognostic value of cirrhosis: going beyond
the hepatic venous pressure gradient and MELD score. J. Cachexia Sarcopenia Muscle. 9(5), 860–870 (2018).
37. Hiraoka, A. et al. Muscle volume loss as a prognostic marker in hepatocellular carcinoma patients treated with sorafenib. Hepatol.
Res. 1(10), 12780 (2016).
38. Peng, S. et al. Body composition, muscle function, and energy expenditure in patients with liver cirrhosis: A comprehensive study.
Am. J. Clin. Nutr. 85(5), 1257–1266 (2007).
39. Riggio, O. et al. Malnutrition is not related to alterations in energy balance in patients with stable liver cirrhosis. Clin. Nutr. 22(6),
553–559 (2003).
40. Merli, M., Giusto, M., Giannelli, V., Lucidi, C. & Riggio, O. Nutritional status and liver transplantation. J. Clin. Exp. Hepatol. 1(3),
190–198 (2011).
41. Alberino, F. et al. Nutrition and survival in patients with liver cirrhosis. Nutrition. 17(6), 445–450 (2001).
42. Merli, M., Riggio, O. & Dally, L. Does malnutrition affect survival in cirrhosis? PINC (Policentrica Italiana Nutrizione Cirrosi).
Hepatology 23(5), 1041–1046 (1996).
43. Wu, L. W. et al. Mid-arm muscle circumference as a significant predictor of all-cause mortality in male individuals. PLoS ONE
12(2), e0171707 (2017).
Author contributions
Study concept and design: H.T. Acquisition of data: H.T., F.A., Y.T., H.Y., T.O., K.T., M.K. Analysis and interpre-
tation of data: H.T. Drafting of the manuscript: H.T. Critical revision: F.A., M.K., N.E. Study supervision: F.A.,
M.K., N.E. All authors reviewed the manuscript.
Competing interests
The authors declare no competing interests.
Additional information
Correspondence and requests for materials should be addressed to H.T.
Scientific Reports | (2020) 10:10795 | https://doi.org/10.1038/s41598-020-67847-0 8
Vol:.(1234567890)www.nature.com/scientificreports/
Reprints and permissions information is available at www.nature.com/reprints.
Publisher’s note Springer Nature remains neutral with regard to jurisdictional claims in published maps and
institutional affiliations.
Open Access This article is licensed under a Creative Commons Attribution 4.0 International
License, which permits use, sharing, adaptation, distribution and reproduction in any medium or
format, as long as you give appropriate credit to the original author(s) and the source, provide a link to the
Creative Commons license, and indicate if changes were made. The images or other third party material in this
article are included in the article’s Creative Commons license, unless indicated otherwise in a credit line to the
material. If material is not included in the article’s Creative Commons license and your intended use is not
permitted by statutory regulation or exceeds the permitted use, you will need to obtain permission directly from
the copyright holder. To view a copy of this license, visit http://creativecommons.org/licenses/by/4.0/.
© The Author(s) 2020
Scientific Reports | (2020) 10:10795 | https://doi.org/10.1038/s41598-020-67847-0 9
Vol.:(0123456789)You can also read


