PROCEEDINGS OF SPIE Correlation wind Lidar with an array detector and photon counting
←
→
Page content transcription
If your browser does not render page correctly, please read the page content below
PROCEEDINGS OF SPIE
       SPIEDigitalLibrary.org/conference-proceedings-of-spie

                   Correlation wind Lidar with an array
                   detector and photon counting

                   Armandillo, Errico, Rees, David, Tzeremes, Y.

                                  Errico Armandillo, David Rees, Y. Tzeremes, "Correlation wind Lidar with an
                                  array detector and photon counting," Proc. SPIE 11852, International
                                  Conference on Space Optics — ICSO 2020, 1185228 (11 June 2021); doi:
                                  10.1117/12.2599360

                                  Event: International Conference on Space Optics — ICSO 2021, 2021, Online
                                  Only

Downloaded From: https://www.spiedigitallibrary.org/conference-proceedings-of-spie on 22 Oct 2021 Terms of Use: https://www.spiedigitallibrary.org/terms-of-use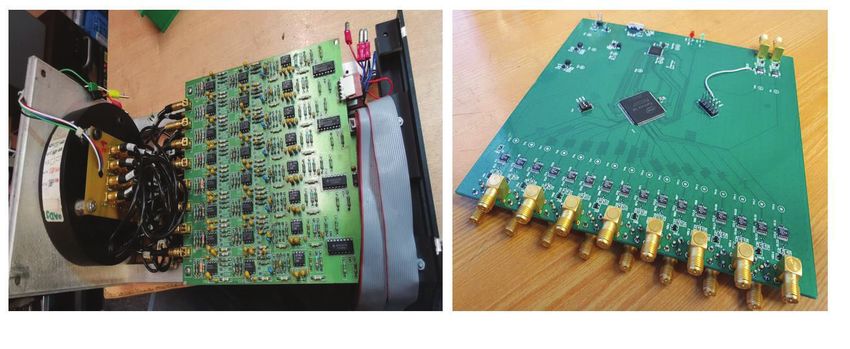
International Conference on Space Optics—ICSO 2020
                Virtual Conference
                30 March–2 April 2021

                                                                             Edited by Bruno Cugny, Zoran Sodnik, and Nikos Karafolas

              Correlation wind Lidar with an array detector and photon
              counting

                                      International Conference on Space Optics — ICSO 2020, edited by Bruno Cugny, Zoran Sodnik,
                                                Nikos Karafolas, Proc. of SPIE Vol. 11852, 1185228 · © 2021 ESA and CNES
                                                          CCC code: 0277-786X/21/$21 · doi: 10.1117/12.2599360

                                                                        Proc. of SPIE Vol. 11852 1185228-1
Downloaded From: https://www.spiedigitallibrary.org/conference-proceedings-of-spie on 22 Oct 2021
Terms of Use: https://www.spiedigitallibrary.org/terms-of-use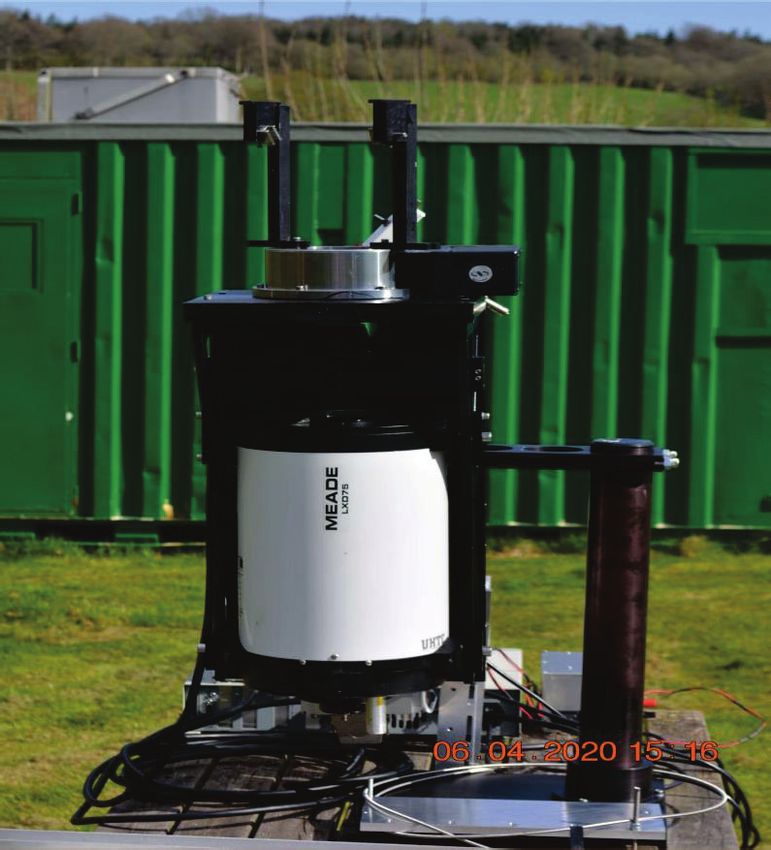
ICSO 2020                                                                                                   Virtual Conference
                   International Conference on Space Optics                                                                 30 March-2 April 2021

                             Correlation Wind Lidar with PMT Array Detector and Photon
                                                      Counting
                                                         E. Armandilloa, David Reesb , Y. Tzeremesc
                                                   a
                                                     Eventech Ltd., 14 Dzerbenes St., Riga, LV-1006 Latvia
                                                                   b
                                                                     The Paradigm Factor, UK
                                             c
                                               The European Space Agency, Estec, Noordwijk, The Netherlands

                                                                                   ABSTRACT

                     We present the initial tests of a novel correlation wind lidar (CWL). The instrument scans the atmosphere and detects
                     inhomogeneities in the aerosol content. Depending on whether it is being exploited from a ground-based, airborne or
                     space platform, the instrument scans the atmosphere and by cross-correlation determines the viable structures for
                     analysis and then determines wind from the motions of these viable structures. The current instrument exploits recent
                     advances in photon-counting array detectors, advanced high-resolution time-tagging and image processing techniques.
                     To improve the SNR of the system, a Rayleigh / Mie Spectral Separator is employed so that only the Mie signal from
                     Aerosols is measured. In situations that are frequently encountered with low to modest aerosol content, this enhances the
                     visibility of low-contrast aerosol structures, thus increasing the frequency and accuracy of wind determination. We are
                     investigating the possibility of exploiting this on future Space Missions aimed at global wind measurement. While
                     generally limited to the troposphere and tropopause regions, the technique does not require complex or sophisticated
                     transmitter or receiver systems. Extension beyond Tropopause is proposed by complementing the CWL lidar with a
                     Wind Doppler Interferometer operating in Limb Sounder on O2 lines. The CWL lidar concept can be extended to
                     different applications domains.
                     Keywords: Lidar, Photon Counting, Signal Processing

                                                                           1. INTRODUCTION
                     Knowledge of atmospheric winds is fundamental to Meteorology, Climatology, Atmospheric research as well as for
                     Navigation. The wind techniques relevant to the work described here can be summarized in:
                                                    -     Doppler lidar technique (DWL), as exploited by Aladin Doppler wind lidar on Aeolus
                                                          satellite1, launched by ESA August 2018. The first Satellite with a Payload of this kind
                                                          ever flown.
                                                    -     PBL (Planetary Boundary Layer) winds, where autocorrelation of local aerosols
                                                          inhomogeneities provides winds2,3
                                                    -     Of historic interest: Atmospheric winds via Cloud Motion, as exploited by NOAA
                                                          Satellites4, where correlation of Cloud images at different times provide wind.

                     The DWL technique of Aeolus is the most performant but also the most complex and challenging for both transmitter
                     and receiver specifications. The transmitter laser operates in the UV @ 355 nm adequate energy, of around 100mJ, to
                     ensure winds up the stratosphere. The requirements of spectral & thermomechanical stability are very stringent &
                     demanding as well as the underlying issues of optical contamination & damage are severe at such energy level in the UV
                     and in vacuum. The receiver focal plane itself, also relies on tightly specified optics & filtering components as well as
                     durability & stability in environment & UV light. Last but not least, the associate data processing & wind retrieval
                     algorithm is matching the system in complexity & susceptibility to errors & bias.
                     The need for a simpler system has motivated this work. A wind lidar based on simplicity but also flexibility for an agile
                     Lidar system whose basic concept can be adapted to a multitude of space applications: from a relatively larger system for
                     winds, to smaller & compact systems for altimetry, imaging, navigation, planetary mapping or landing assistance, etc.
                     Basically, the concept proposed is based upon a scaling Tx, an array detector in photon counting, and a matched Data
                     Processor whose Firmware, algorithm & software can be adapted to the multitude of applications.

                                                                        Proc. of SPIE Vol. 11852 1185228-2
Downloaded From: https://www.spiedigitallibrary.org/conference-proceedings-of-spie on 22 Oct 2021
Terms of Use: https://www.spiedigitallibrary.org/terms-of-use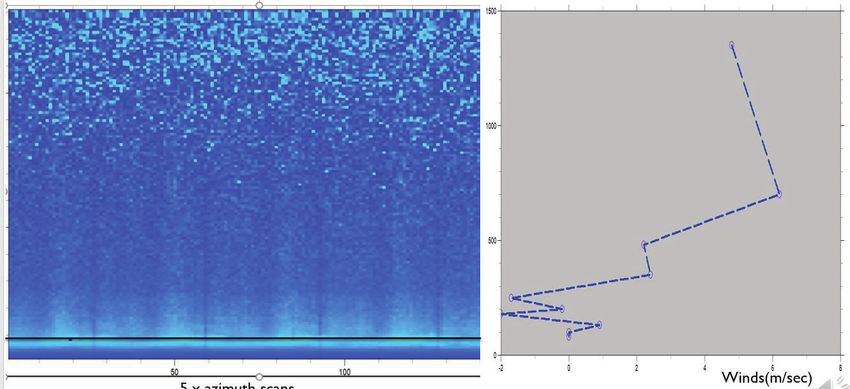
ICSO 2020                                                                                              Virtual Conference
                   International Conference on Space Optics                                                            30 March-2 April 2021

                     Here we present a wind lidar concept able to provide vectors wind in the troposphere. The winds are extracted via cross-
                     correlation of Point Cloud Images generated by a scanning (for a ground systems), or a multi-line-of-sight (LOS), elastic
                     backscattering lidar. For Space, such instrument can be complemented by a (passive) Doppler Wind Imager in Limb
                     Sounding Mode detecting O2 lines to cover the altitude range: 10 to 30 km5. The elastic lidar operates on Mie, Aerosol
                     scattering only while the uniformly distributed, molecular scattering is filtered out on the receiver by a Rayleigh filter.
                     Motion of atmospheric aerosol produced by winds are then translated into 3-D local wind information via cross-
                     correlation of density variability in sequentially scanned or satellite moving atmospheric pixels. Cross-correlating all
                     image pixels provide the required wind filed distribution. Hence Correlation Wind Lidar (CWL).

                                                   2. THE CORRELATION WIND LIDAR CONCEPT
                     The CWL lidar relies on a low-energy high repetition rate infrared or visible laser (but a UV laser is used in the
                     demonstrator here discussed) sending beams of ~ 0.1-1 mJ energy level @ 1-10 kHz repetition rate.
                     The receiver is based on a multichannel PMT detector array with single-photon-counting capabilities (in this study). The
                     generated data sets, organized in matrices with indexes corresponding to pixel range & time, are then fed into a
                     Processor performing cross-correlation between adjacent Matrices, A & B. In this work the DSP (Digital Signal
                     Processing) package of MATLAB is being used. In this case, maximizing the elements cross-correlation provides the
                     correlation coefficients whose indexes values provide the position of the pixel, in space & time, as it moves between A &
                     B. A formula does then provide the sought vector wind components.

                     Here the Transmitter requirements are very relaxed when compared to a DWL system: a multi-mode longitudinal laser
                     beam with no particular frequency stability requirements, of relatively low energy & high repetition rate is sufficient:
                     AKA microlidar. So it is with the Receiver & Processor: here photon counting capability of less than one photon per
                     pulse is required and for the Processor, an adequate Storage Capability is needed to handle the large data set generated
                     and needed for processing: storage capacity of approx. 1 GB is deemed adequate for the cases studies here.
                     Fig. 1 gives a schematic of the CWL here studied, while Fig. 2 shows the concept for a wind space system.

                                                                        Proc. of SPIE Vol. 11852 1185228-3
Downloaded From: https://www.spiedigitallibrary.org/conference-proceedings-of-spie on 22 Oct 2021
Terms of Use: https://www.spiedigitallibrary.org/terms-of-use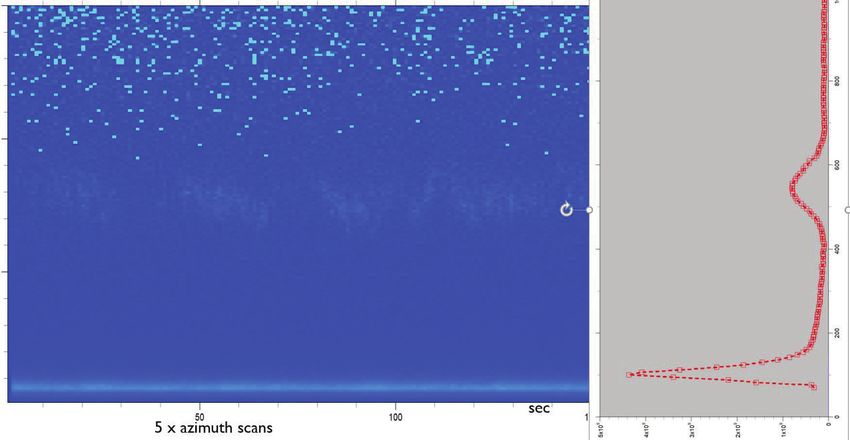
ICSO 2020 Virtual Conference
International Conference on Space Optics 30 March-2 April 2021
Figure 1. Schematics of the CWL instrument studied here: the transmitter laser scan the Atmosphere via an Azimuth
scanning mirror. The Received Photons, are filtered of the Rayleigh components and detected/processed for wind
acquisition.
Figure 2. Schematics of the Wind Space concept. The Combo-Instrument satellite includes : the Multi line-Sight (two here)
CWL + a Doppler Imager in Limb mode sounding the molecular Oxygen lines O2 in the altitude range 10-30 km (as HRDI
in NOAA UARS wind Satellite)
Subsequent Figures 3, 4 & 5 provide details of the actual CWL lidar system used in this work to demonstrate
the CWL concept. The lidar is operated at Park Cottage Observing Station, located South London, West Sussex
County. It is a rural area, subject to urban aerosols flowing out of London6.
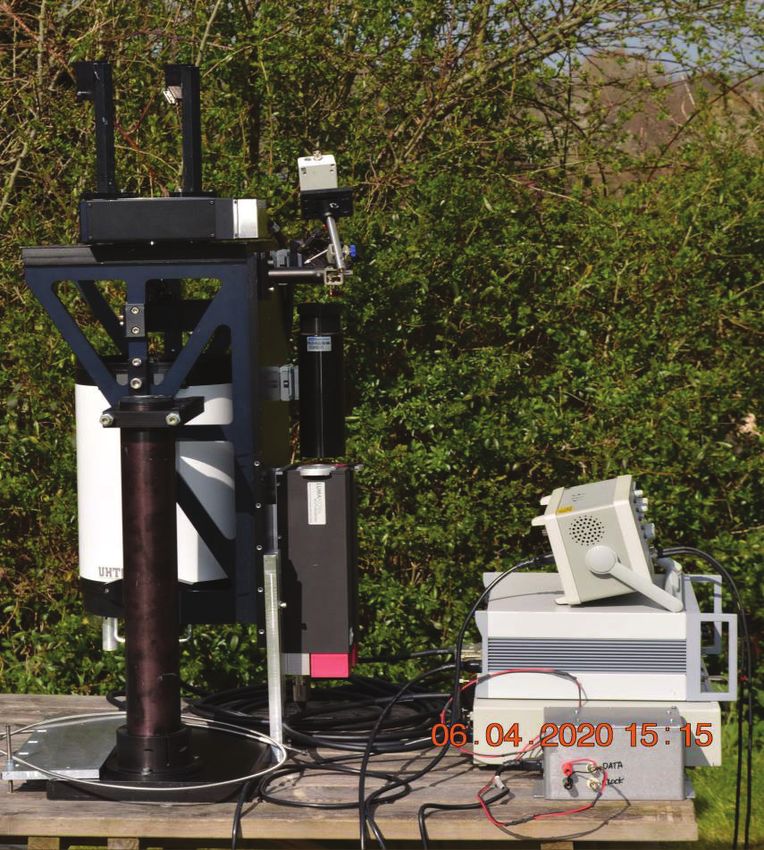
Figure 3. The CWL used in the experiments. It can be seen, n the left, the small transmitter attached to the lidar frame
together with the receiver telescope. To the right, it is visible part of the receiver electronics. The laser transmitter is a
commercial French-built TEEM laser , multi-mode, un-stabilized, providing o/p energy of ~ 20μJ @ 1 KHz @ 355 nm. On
top of the laser it can be seen beam expander with a Newport Scanner & mirror mount.
Proc. of SPIE Vol. 11852 1185228-4
Downloaded From: https://www.spiedigitallibrary.org/conference-proceedings-of-spie on 22 Oct 2021
Terms of Use: https://www.spiedigitallibrary.org/terms-of-use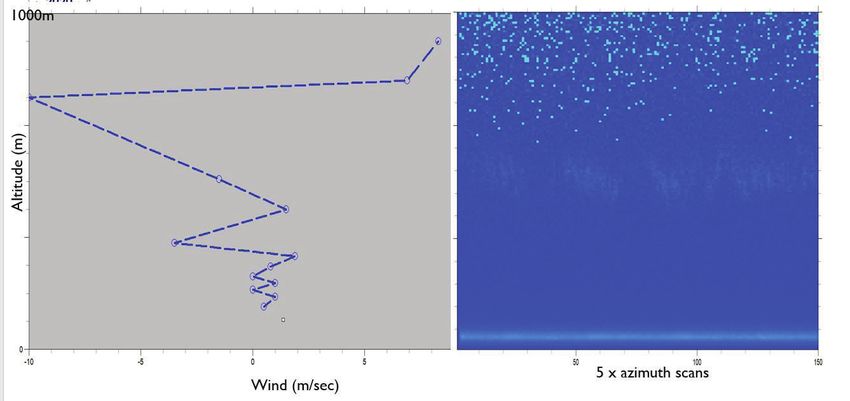
ICSO 2020                                                                                                       Virtual Conference
                   International Conference on Space Optics                                                                     30 March-2 April 2021

                          Figure 4. The figure shows the MEADE telescope, two 45 degree mirrors that turns the bistatic into a monostatic optical
                          lidar configuration, the elliptical scanning mirror. Not present in this configuration is the bandpass & Rayleigh filter.

                                                                        Proc. of SPIE Vol. 11852 1185228-5
Downloaded From: https://www.spiedigitallibrary.org/conference-proceedings-of-spie on 22 Oct 2021
Terms of Use: https://www.spiedigitallibrary.org/terms-of-use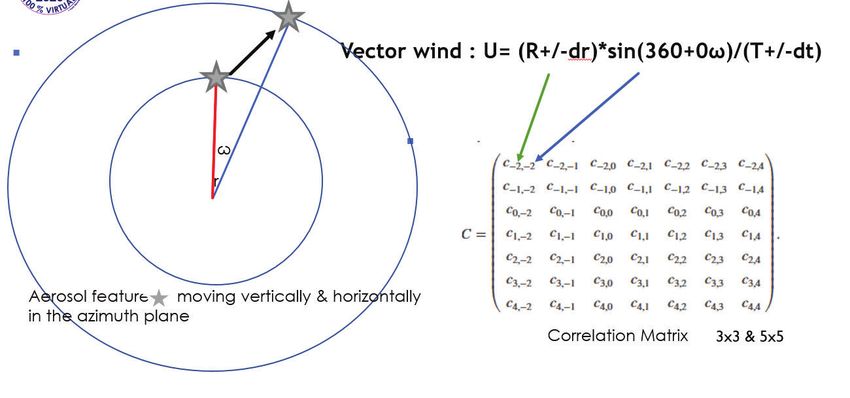
ICSO 2020                                                                                                       Virtual Conference
                   International Conference on Space Optics                                                                     30 March-2 April 2021

                          Figure 5. The figure shows on the left, a Photek 16 Channel array PMT-MCP array detector and electronics and, on the
                          right, the 16 Channel Eventech single-photon-counting board electronics & preprocessing

                                 3. CWL DATA SETS & WIND PROCESSING: PRELIMINARY RESULTS

                          The PMT-MCP detector output electronics provides signal intensity profiles versus height and azimuth angle
                          (equivalent to time in this configuration). Data on-board pre-processing is first carried out and consists in: a) data
                          acquisition from all laser pulses, b) pulse averaging, c) R2 multiplication & normalization, d) background calculation &
                          subtraction. These data so generated are then used for wind processing. This is performed via NORMXCORR2 routine
                          from MATLAB DSP package, but DSP also permits other functions, such as smoothing & filtering, etc. Figure 6.
                          shows an example of CWL data file as generated by the Point Cloud Data file and ready for processing.

                          Figure 6. The figure shows CWL data files: either as xls (as shown) or csv format

                                                                        Proc. of SPIE Vol. 11852 1185228-6
Downloaded From: https://www.spiedigitallibrary.org/conference-proceedings-of-spie on 22 Oct 2021
Terms of Use: https://www.spiedigitallibrary.org/terms-of-use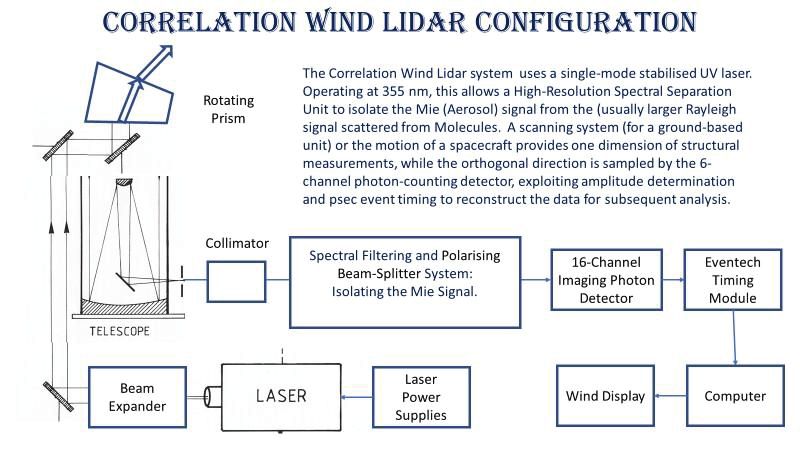
ICSO 2020                                                                                                       Virtual Conference
                   International Conference on Space Optics                                                                     30 March-2 April 2021

                     The CWL Lidar is typically operated at night to reduce solar background & noises. The scanner run continuously and
                     scan a complete rotation of 360 degrees in 33 seconds, at a constant elevation angle of 40 degrees.
                     For our Lidar system, Telescope overlap occurs at about 50 meters, so the data are being considered as from this height
                     range. The range bin can vary from 5 to 10 meters and 1000 pulses are being integrated in each lidar channel profile,
                     4096 range bins are generated corresponding to 20 km to 40 km Data sets. The first two bins, out of 4096, are not used
                     for the correlation, due to an artifact induced by the electronics. Fig. 7 below show pictorially the determination of the
                     wind in Polar coordinates together with the formula used for the determination of the three vector wind components. The
                     two concentric circles shown, correspond to two adjacent scans. In the example shown, the pixel (indicated as a star)
                     moves outwards to the right due to the wind, which is calculated once the maximum of the correlation coefficient is
                     known. The indexes i and j, provide in fact the new range & azimuth position due to wind. The arrows in Figure 7
                     indicate the correspondence between correlation matrix indexes and pixel displacement.

                          Figure 7. Pictorial view of wind vector calculation in CWL in polar coordinates. Left shown the motion of the aerosol
                          feature moving with the wind during the scan and on the right it is shown the cross-correlation resulting Matrix with
                          coefficient indexes providing the new coordinate position if the pixel.

                     Examples of wind calculations are now shown. Many Data sets were accumulated over the period May to November
                     2020. After this date the system went into refurbishment. In fact, after months of operation, the laser suffered UV optical
                     degradation of the harmonic crystals which needed to be replaced. The energy had dropped to below 10 μJ as from
                     September with the CWL still operating, but laser energy recovered to 25 μJ after repairs.
                     During the CWL runs over the May-November time frame, many data files were processed and atmospheric winds
                     generated. Two show cases, run A & run B, are presented as examples of CWL winds. Both cases refer to dry and clear
                     weather conditions on May and September 2020 runs. In both cases visibility was good for a suburban London location
                     with a clear sky and no apparent clouds.
                     In Figure 8, it can be seen that the max correlation coefficient follows exactly the lidar profile. After an initial saturation
                     the correlation coefficient drops then raises again in correspondence to probably a light cloud or urban aerosol coming
                     from London6. The saturation of the cross-correlation coefficient is associated also with a large scale azimuth invariance

                                                                        Proc. of SPIE Vol. 11852 1185228-7
Downloaded From: https://www.spiedigitallibrary.org/conference-proceedings-of-spie on 22 Oct 2021
Terms of Use: https://www.spiedigitallibrary.org/terms-of-use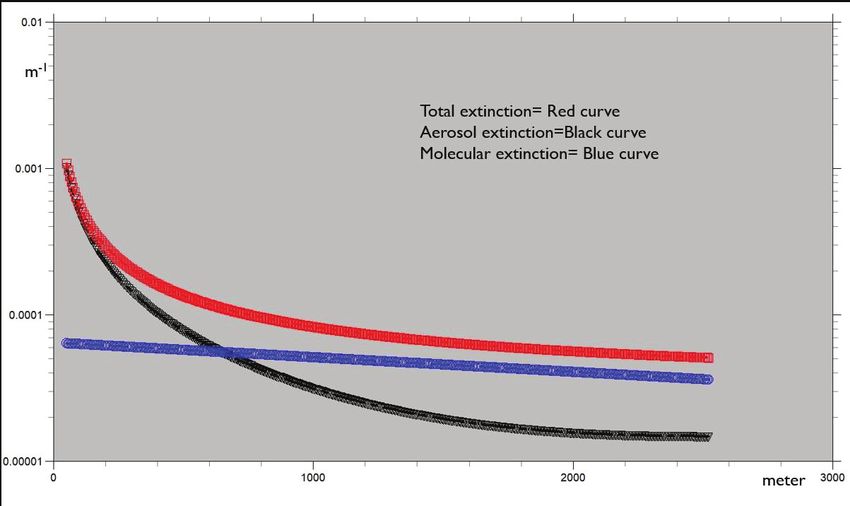
ICSO 2020                                                                                                         Virtual Conference
                   International Conference on Space Optics                                                                       30 March-2 April 2021

                     (> 100s meters), suggesting denser urban aerosols out from London. The Figure 9 gives the corresponding Point Cloud
                     Image while Figure 10, provides the wind calculated for this set.
                     The Figure 11 provides the wind calculated at September run. These two cases are given as example of wind blowing
                     with or opposite to the Scanner direction (positive or negative winds in the graphs).

                          Figure 8. Picture shows the magnitude of the correlation coefficient (blue curve) corresponding to the lidar profile (red
                          curve).

                          Figure 9. Picture shows the Point Cloud Image corresponding to above

                                                                        Proc. of SPIE Vol. 11852 1185228-8
Downloaded From: https://www.spiedigitallibrary.org/conference-proceedings-of-spie on 22 Oct 2021
Terms of Use: https://www.spiedigitallibrary.org/terms-of-use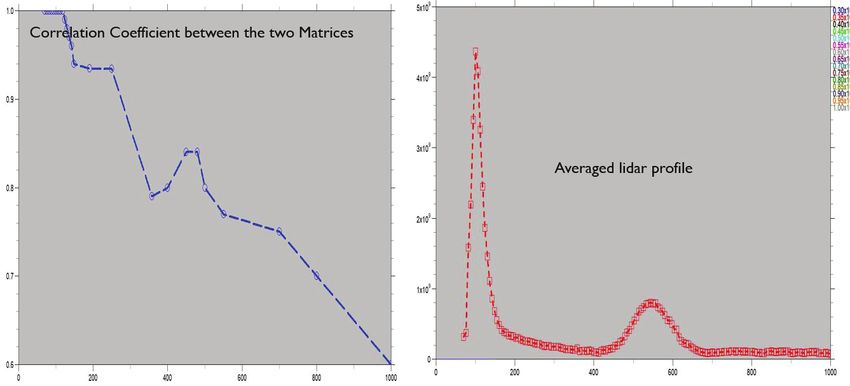
ICSO 2020                                                                                                       Virtual Conference
                   International Conference on Space Optics                                                                     30 March-2 April 2021

                          Figure 10. Picture shows the calculated vector magnitude of the vector wind, left with the corresponding atmosphere point
                          cloud image. From the picture it can be seen that the wind runs opposite direction of the scanner.

                          Figure 11. This run is shown for comparison to the wind in Figure 10, to show that in this case the wind blows in the same
                          direction as the scanner rotation.

                                                                        Proc. of SPIE Vol. 11852 1185228-9
Downloaded From: https://www.spiedigitallibrary.org/conference-proceedings-of-spie on 22 Oct 2021
Terms of Use: https://www.spiedigitallibrary.org/terms-of-use
ICSO 2020 Virtual Conference
International Conference on Space Optics 30 March-2 April 2021
To further understand the nature and the role of the scattering aerosols at low altitude and its relative azimuth
invariance, an empiric methodology has been developed, and is being used to solve the lidar equation and
calculate aerosol & molecular extinction and scattering coefficients. This empiric method, based on actual lidar
power profiles and local temperature & pressure, will be reported in a future publication. In Figure 12 below it
is plotted the calculated backscattering & extinction coefficients for the run A (units are for backscattering:
m.sr-1 and for extinction: m-1). From the plots shown it can be seen that the values of backscattering coefficients
versus height well match the values measured in Ref. 6 for this London sub-urban area.
Figure 12. Calculated scattering & extinction coefficients corresponding to Figure 8.
Proc. of SPIE Vol. 11852 1185228-10
Downloaded From: https://www.spiedigitallibrary.org/conference-proceedings-of-spie on 22 Oct 2021
Terms of Use: https://www.spiedigitallibrary.org/terms-of-useICSO 2020 Virtual Conference
International Conference on Space Optics 30 March-2 April 2021
4. PRELIMINARY CONCLUSIONS & ACKNOWLEDGMENT
The CWL lidar technique with DSP processing has demonstrated that it can provide atmospheric winds,
offering significant system simplifications in terms of Hardware, Software & Processing than a DWL.
These preliminary results show that further improvements on the present system concept can be obtained
using a Rayleigh filter, to suppress molecular scattering, and the use of IR or Vis laser wavelengths to
further reduce Molecular scattering. Although ~10 μJ @ 1kHz level has provided good result, energies in
the range of ~25 μJ and/or higher repetition rate can significantly increase SNR and range.
For Space, a system study for the combination of CWL with a passive Doppler Imager in limb sounding is
under consideration to fine tune a possible space wind instrument.
This work has been partially funded by ESA under PECS contract No. 4000130586/20/NL/SC.
REFERENCES
[1] https://earth.esa.int/web/eoportal/satellite-missions/a/adm-aeolus
[2] Kunkel, K.E., Eloranta, E.J., Weinman, A., "Remote Determination of Winds, Turbulence Spectra and Energy
Dissipation Rates in the Boundary Layer from Lidar Measurements" J. Atm. Sciences, Vol. 37, 978-985 (1980)
[3] Mylapore ,A, Schwemmer, G, et al., “Proceedings SPIE, Baltimore, United States 2014”
[4] Leese, J. A, Novak, C.S., Clark, B.B., “ J. Appl. Meteorology, Vol. 10, 118-125 (1971)
[5] Grass, H.J, Skinner, W.R, et al., “ Atmospheric Wind Measurements with the High-Resolution Dopler Imager”,
J. of Spacecraft and Rockets, Vol. 32, 169-176 (1995)
[6] Ricketts, H., Vaughan G., Wareing D., “ Lidar Observation of Pollution Transport from London to Rural
Areas”, ILRC27, 2016
Proc. of SPIE Vol. 11852 1185228-11
Downloaded From: https://www.spiedigitallibrary.org/conference-proceedings-of-spie on 22 Oct 2021
Terms of Use: https://www.spiedigitallibrary.org/terms-of-useYou can also read