Nitrogen Management Service
←
→
Page content transcription
If your browser does not render page correctly, please read the page content below
Nitrogen Management Service
                                                May 5, 2014
Summary
This white paper provides a description of a Nitrogen Management Service that DuPont Pioneer will soon
begin offering in targeted corn production geographies. Pioneer agronomists estimate that farmers in the
U.S. Corn Belt currently lose $50 to 60/acre as a result of nitrogen management inefficiencies - with
much greater loses occurring in extreme climatic years. This advanced solution will significantly narrow
the nitrogen profit loss gap by giving farmers a new ability to plan, monitor and adapt nitrogen
management practices to maximize profitability and improve environmental quality in the face of climatic
uncertainty. The technology behind this service was developed through strategic collaborations, and
combines next-generation crop and nitrogen models with high-resolution soil and weather data to
dynamically forecast soil nitrogen status. Pioneer will deliver industry-leading nitrogen service to the
market through a cloud-based software platform supported by a field team of specialized Pioneer Services
Agents who will work side-by-side with customers to operationalize improved nitrogen management
programs. The Pioneer Nitrogen Management Service will create value by giving customers access to
insights that explicitly account for financial risk and tools that allow them to monitor and manage soil
nitrogen in real-time at a finer spatial-scale than ever before.
Introduction
Nitrogen is a critical crop production input, second in importance only to water, and is the major mineral
nutrient that farmers must manage to achieve high yields. Nitrogen management, however, is among the
most complex and uncertain agronomic aspects of modern farming. Large quantities of organic nitrogen
are present in most soils, but only a small and highly variable fraction of this nitrogen is mineralized each
growing season into inorganic forms that are available for crop uptake. Inorganic nitrogen, originating
from the soil or from fertilizers, is readily available to crops, but is also highly susceptible to losses. To
add to this complexity, all of the processes that control nitrogen availability and loss vary by soil type,
moisture, temperature and other factors. Because of the multifaceted and dynamic nature of nitrogen,
farmers regularly over- and under-fertilize in any given field or year, reducing profitability (Lambert et
al., 2006) and in some cases leading to environmental contamination (Jaynes et al., 2001).
Today, decisions about nitrogen fertilizer application rates are generally based on yield goals (Hoeft et al,
2000) or generalized empirical relationships (Sawyer et al., 2006) that do not adequately account for
weather effects when estimating crop nitrogen requirements. Current nitrogen management practices also
emphasize field-uniform, pre-plant applications that ignore variation in landscape factors such as
topography, soil texture and organic matter (Cassman 2002; Mamo et al, 2003; Scharf et al., 2005).
Collectively, these current strategies result in inefficient use of nitrogen fertilizer (Raun and Johnson,
1999; Fageria and Baligar 2005). Additionally, farmers do not currently have access to intuitive, user-
friendly tools that allow them to compare competing nitrogen management strategies based on financial
risk, let alone to assess and manage soil nitrogen in real-time. Analysis conducted by Pioneer estimates
that, on average, farmers in the U.S. Corn Belt currently lose $50 to $60/acre due to inefficient nitrogen
management, with much greater loses occurring in extreme years (Appendix I). As a result, a large
opportunity exists to provide farmers with decision support tools that enable them to more effectively
manage nitrogen with reduced risk and increased profitability.
Based on strong agronomic expertise combined with strategic collaborations in the areas of weather data,
soils mapping and crop modeling, Pioneer will soon begin to offer a Nitrogen Management Service in
targeted geographies. The Pioneer Nitrogen Management Service is an advanced solution that will
provide real-time actionable insights with field-by-field specific recommendations from fall planning
through in-season application. This white paper describes three key aspects of the DuPont Pioneer
Nitrogen Management Service: 1) enabling technologies; 2) service delivery; and 3) opportunity for value
creation.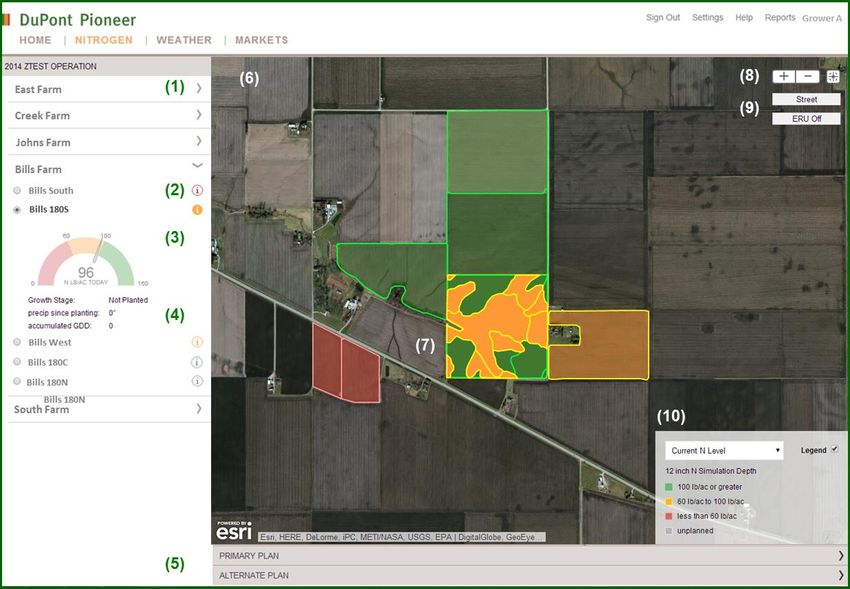
Enabling Technologies
Crop and Soil Nitrogen Model
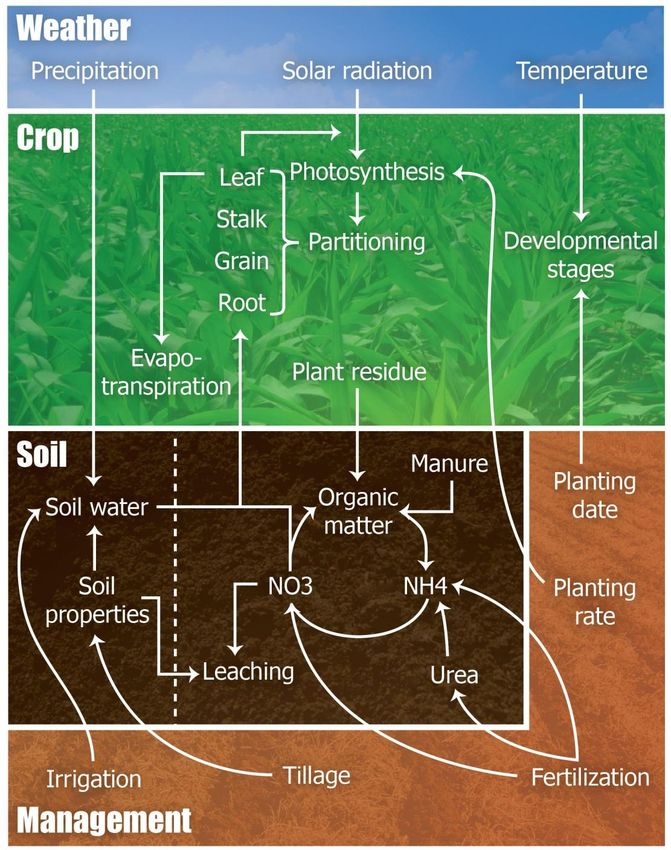
The core enabling technology of the Pioneer Nitrogen Management Service is a proprietary crop and soil
model that simulates all aspects of crop growth, development and yield for a specific set of soil
characteristics and under defined management and weather conditions. The model directly accounts for
changes in soil water and nitrogen that occur over time in response to crop growth, management and
weather (Figure 1).
Figure 1: Graphical representation of the factors affecting crop growth and
nitrogen availability in the crop and soil model underlying the Pioneer Nitrogen
Management Service.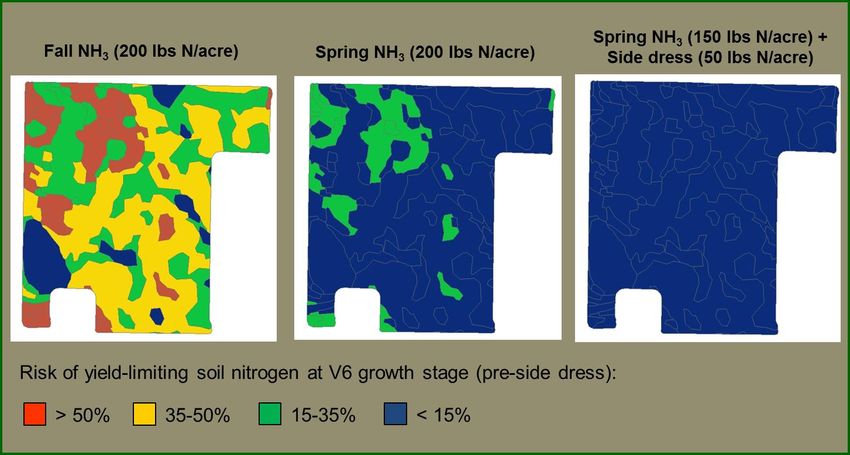
A key advantage of the Pioneer model-based service is that it is driven by high-density weather data,
updated on a daily basis, to reforecast soil nitrogen status. Through the collaboration with
DTN/Progressive Farmer, Pioneer will have access to an exclusive network of weather stations,
including those positioned on or near the farms where the Nitrogen Management Service is deployed.
The dynamic nature of the model, combined with high density weather data, will give customers the
ability to monitor changes in soil nitrogen status and assess the impacts of potential management actions
in real time. By developing the Nitrogen Management Service around a model-based platform, Pioneer
will be able to provide customers with a scalable solution that can be implemented across a broad
geographic range while incorporating soil, weather and management information for the specific fields
customers manage. Pioneer agronomists have tested the model extensively and are adapting it to predict
nitrogen availability across a wide range of soil, climatic and management conditions (Figure 2). In on-
farm trials conducted at 24 locations across the U.S. Corn Belt in 2013, the model generated variable rate
nitrogen prescriptions that were on par with those made by crop canopy sensors. Efforts to continuously
improve and validate the model will continue into the future to identify opportunities for additional
precision and functionality.

             Figure 2: Modeled and measured soil NO3- concentration to a 12” depth for three
             soils in fields where the Pioneer nitrogen model was evaluated in 2013.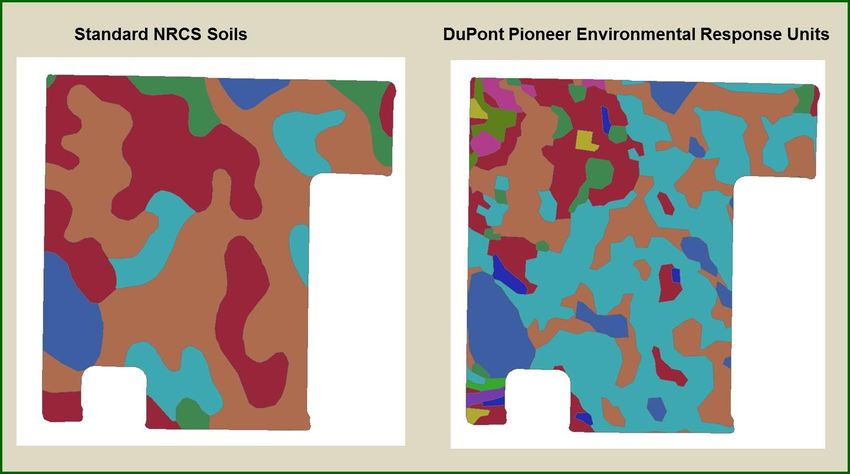
High Resolution Soil Maps
Existing soil maps include information that can be used to model crop growth and nitrogen availability,
but the resolution of current maps is limited by the tools that were available when they were created
decades ago. Pioneer has collaborated with scientists at the University of Missouri and the USDA-
Agricultural Research Service (ARS) to create a new generation of soil maps that will dramatically
improve the resolution of decision-making in agriculture. The improved soil maps are based on a
proprietary technology that creates new soil spatial definitions called Environmental Response Units
(ERUs). These ERUs are generated using a machine learning clustering algorithm that reclassifies the
spatial distribution of soil properties within fields based on high resolution digital elevation data. In
essence, the technology reverse-engineers the process that soil scientists used to create the original soil
map boundaries, using landscape information that was not available when the original maps were
produced. The result is a more precise soil map that better reflects field-scale hydrological attributes that
strongly influence crop growth and nitrogen availability (Figure 3).

 Figure 3: Standard NRCS soil map compared to Pioneer Environmental Response Unit (ERU) map.

Because the best models are only as good as their inputs, Pioneer will launch its Nitrogen Management
Service with the most advanced soil data inputs in the industry. Like the Pioneer crop and soil model,
ERU soil mapping technology has been developed with both flexibility and functionality in mind. The
ERU maps generated for customers are the only soils information required to make nitrogen forecasts for
growers’ fields. However, in situations where farmers or their advisors have additional soils information
obtained via remote sensing imagery or various commercial soil and crop sensors, these data can be
directly incorporated into the ERU framework, further improving the precision and accuracy of the soil
nitrogen forecasts.
Service Delivery
Software as a Service
The Pioneer Nitrogen Management Service will be a powerful, accessible and scalable nitrogen
management decision support tool. The service will use a cloud computing framework to manage
weather, soil and operational data for tens of thousands of fields on a daily basis, while also giving
customers instantaneous access to real-time soil nitrogen status updates via web browsers and mobile
applications (Figure 4). Farmers will also have the option to automatically share information and
prescriptions generated by the service with associates and trusted advisors. Because the Pioneer Nitrogen
Management Service operates from the cloud, innovations and updates made to the nitrogen model and
soil mapping software will be seamlessly delivered to customers when they access the service.

        Figure 4: Architecture and information exchanges underlying the Pioneer cloud-based
        Nitrogen Management Service. Pioneer places grower data privacy as a high priority.
        Pioneer abides by data privacy laws and does not sell any personal grower data to third-
        parties. Pioneer collects and use grower information as stated in the DuPont Global
        Information Privacy Policy and DuPont Pioneer Privacy Statement. These documents
        are available at: http://www2.dupont.com/Privacy/en_US/global_policy_english.html,
        and at: https://www.pioneer.com/home/site/us/privacy-statement

Certified Services Agents
A key differentiator in the Pioneer Nitrogen Management Service is how the service will be delivered to
customers. Software-based solutions will be coupled with direct, in-field support from the Pioneer
Services Agent force. This highly specialized and trained channel will work side-by-side with Nitrogen
Management Service customers to ensure that plans, prescriptions and management decisions are tailored
to the context of individual farming operations. With the service being supported by the expertise of the
Pioneer Services Agent, customers will be able to extract greater benefit from the nitrogen management
offering.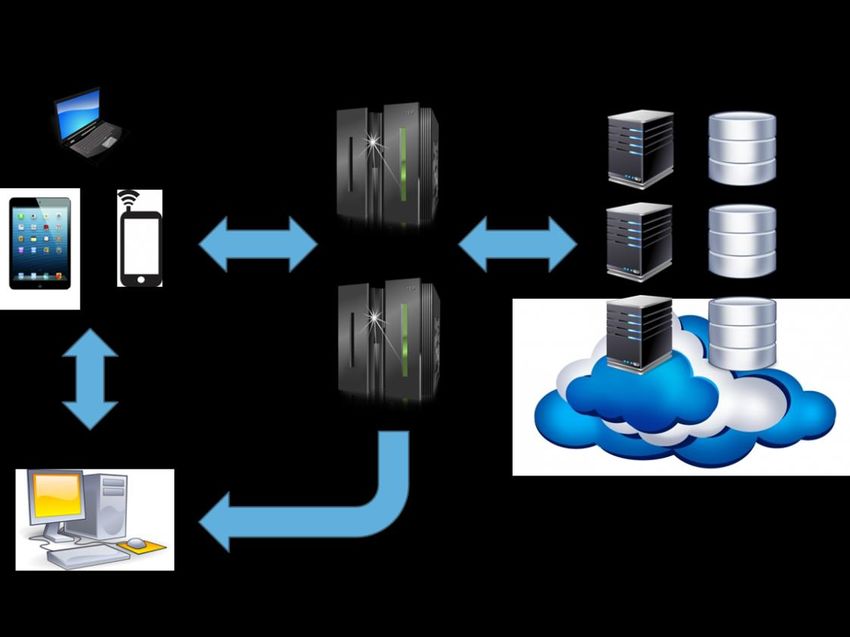
More than a Prescription: Planning, Monitoring and Adaptive Management

The Pioneer Nitrogen Management Service is differentiated from other offerings that only provide side-
dress recommendations and variable rate prescriptions. At its core, the Pioneer Nitrogen Management
Service is designed to help customers plan, monitor and adapt their nitrogen management practices to
help maximize profitability in the face of climatic uncertainty. From fall through spring Services Agents
will assist farmers in developing nitrogen management plans for their fields. These plans will include
guidance regarding the least-risk dates for targeting nitrogen applications, as well as the overall risk that
yields will be limited by nitrogen availability given historic weather conditions at the location. With just a
keystroke, customers will be able to access soil nitrogen forecasts for any plan they have created and
compare its current risk profile against alternative management scenarios (Figure 6), or generate a
variable rate prescription for in-season nitrogen application at any future date (Figure 7).

Modeling previous weather years is a key feature of the Pioneer service that enables dynamic and risk-
based nitrogen planning. Whenever a customer creates or accesses a nitrogen management plan, the
model will work from the cloud to simulate soil nitrogen availability from that date forward for each of
the previous 50 years of weather data. From this range of possible future weather outcomes, the model
estimates the risk of yield-limiting soil nitrogen levels, factoring in observed weather to the current date
(Figure 8). By simulating a wide range of possible weather outcomes, the service will give farmers the
ability to assess and compare the financial risks associated with different nitrogen management plans, and
to make quantitative, risk-based nitrogen management decisions in real-time.

Figure 6: Pre-season planning field maps showing risk of yield-limiting soil nitrogen at V6 (pre-side-
dress) corn growth stage for three different nitrogen management plans forecasted for the same field on
November 1, 2013.
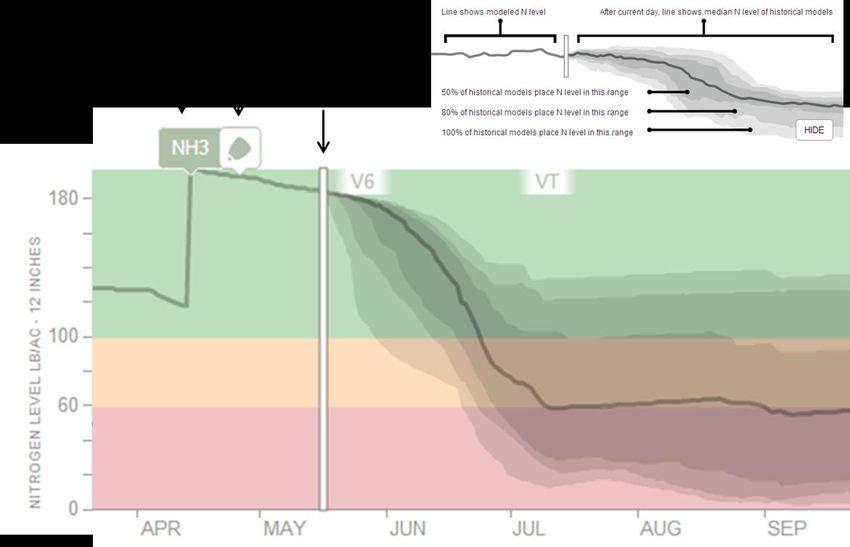
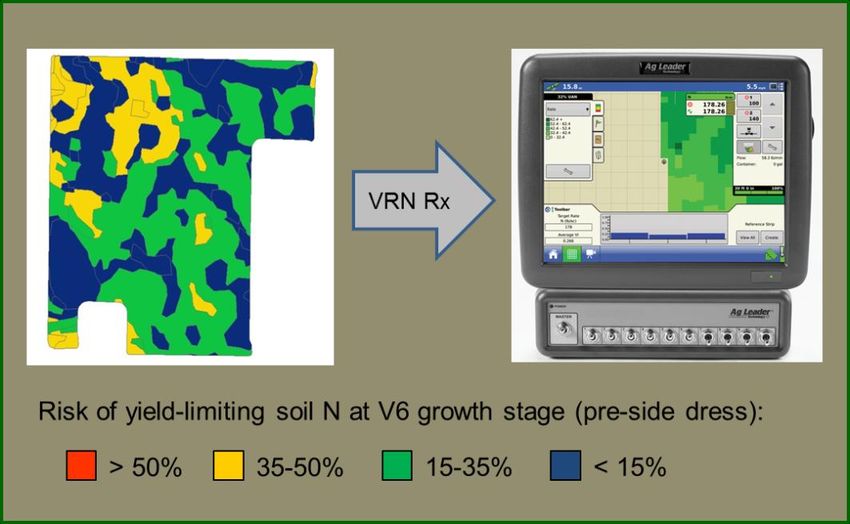
Figure 7: Pre-side-dress Environmental Response Unit field map showing
        the risk of yield-limiting soil nitrogen at V6 (pre-side-dress) corn growth
        stage, and ability to generate variable rate nitrogen prescriptions.

Figure 8: Soil nitrogen forecast for 50 years of historical weather. The shaded regions beginning
at the forecast date represent soil nitrogen levels for 50% (inner shaded region), 80% (middle
shaded region) and 100% (outer shaded region) of modeled historical weather years.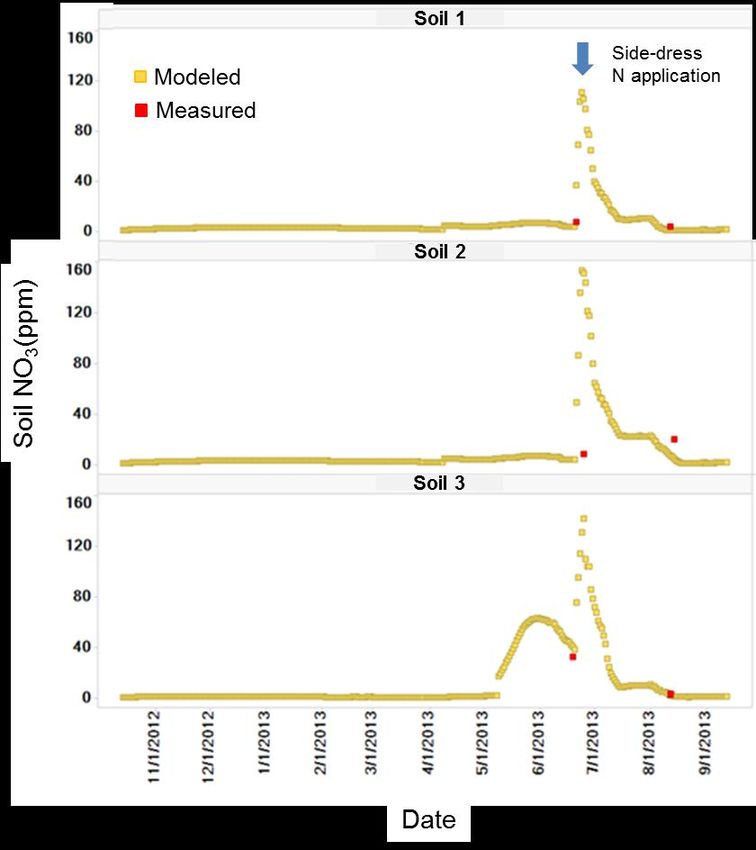
User Interface
Customers will be able to access the software components of the Pioneer Nitrogen Management Service
via an agile and intuitive web interface (Figure 9). The Nitrogen Management Interface will be connected
directly to other agronomic, business and logistical services offered by Pioneer, allowing customers to
navigate quickly between subscribed services.

From the user interface, customers will have access to a number of interactive decision support features:

    1) Expandable windows that allow for quick navigation between fields
    2) Nitrogen status indicators and zoom to feature for individual fields
    3) Real-time soil nitrogen levels and risk status for the currently selected field
    4) Planting date and real-time climatic information for the currently selected field
    5) Expandable windows that access nitrogen management plans for the currently selected field
    6) Map of all enrolled fields color-coded to indicate current nitrogen levels and risk status
    7) Map of the currently selected field with real-time soil nitrogen levels and risk displayed by ERU
    8) Zoom function to quickly scale between field, farm and operational levels
    9) Buttons that toggle between imagery and ERU layers
    10) Interactive map legend

 Figure 9: User interface for accessing software components of Pioneer’s Nitrogen Management Service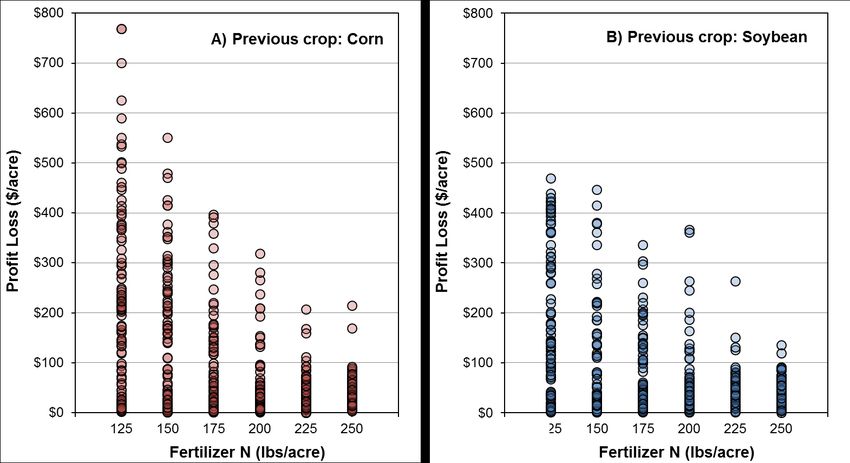
Opportunity for Value Creation
The Pioneer Nitrogen Management Service will create value for farmers by helping them to plan,
anticipate and execute improved nitrogen management strategies that minimize risk of profit loss and
improved environmental quality. Today, many farmers apply nitrogen at rates in excess of what is
required in years when climatic conditions support high levels of soil nitrogen mineralization. Farmers
often apply higher than minimally sufficient nitrogen rates because they do not know in advance how
much soil nitrogen mineralization will occur in any given year. While the economic penalty resulting
from inadequate fertilization is generally much greater than the cost of excess fertilizer, high fertilizer
application rates can be associated with air and water pollution. Given the limited information available to
make decisions today, extra nitrogen application is often the economically optimal nitrogen risk
management strategy at farmers’ disposal. The Pioneer Nitrogen Management Service will provide
farmers with new insights to help them make timelier and higher resolution nitrogen management
decisions that better protect profitability and environmental quality.
Based on an analysis of more than 1,000 university corn nitrogen response trials conducted across the
U.S. Corn Belt, it is estimated that farmers currently lose $50 to $60 per acre on average due to the
combined profit loss associated with under- and over-fertilization (Figure 10), with much greater losses in
extreme years (Appendix I). Because nitrogen mineralization varies among years and across fields, nearly
all farmers experience profit loss from applying both too much and too little nitrogen fertilizer at some
scale. Relative profit loss from inadequate and excess nitrogen fertilization varies for corn grown
following corn compared to corn grown following soybeans, but the net effect on profitability is similar.
The Pioneer Nitrogen Management Service will help farmers recapture a large fraction of the profit loss
they currently experience in two key ways. First, planning tools will help farmers develop field-specific
nitrogen management strategies that reduce environmental and cost risk exposure to over-fertilization.
Secondly, through real-time soil monitoring and best-in-class, in-season variable rate nitrogen
prescriptions, the service will reduce the risk that insufficient nitrogen limits yields.

 Figure 10: Average yield loss, over-fertilization and net profit loss for predominant nitrogen
 management practices in the U.S. Corn Belt for corn grown following (A) corn or (B) soybean.
 Estimates are based on Monte Carlo simulations* of economically optimum nitrogen rate response
 distributions derived from 680 and 488 nitrogen response trials for corn-soybean and corn-corn,
 respectively (Appendix I). Analysis assumed 200 lb./acre nitrogen fertilizer application rate with
 fertilizer and corn prices of $0.60/lb. and $4.00/bu, respectively. *Monte Carlo simulations are
 computational algorithms that rely on repeated random sampling to obtain a series of numerical results
 representing possible observations of a defined probability distribution.
Appendix I. Nitrogen Management Profit Loss Analysis
Soil nitrogen mineralization and loss vary across soils and over time. Because there is no way of knowing
the optimal nitrogen fertilizer rate in advance for any given location or year, corn farmers regularly over-
and under-apply nitrogen fertilizers at different times and places within their operations.
To assess the potential value of a service that allows farmers to make timelier and higher resolution
nitrogen management decisions, Monte Carlo simulations were conducted on normal distributions fit to
economic optimum nitrogen fertilizer rate (EONR) data compiled from a large number of corn nitrogen
response field trials (Figure AI-1). Nitrogen response frequency distributions were obtained from the Iowa
State University Corn Nitrogen Rate Calculator for 488 corn-corn and 680 corn-soybean trial locations
across the U.S. Corn Belt (Table AI-1). Economic optimum nitrogen rates were defined on the basis of
$0.60/lb. nitrogen and $4.00/bu corn.

                    Figure AI-1: Economically optimum nitrogen fertilizer rate
                    cumulative normal distributions for corn grown following corn or
                    soybean. Distributions are based on data from 1168 nitrogen
                    response observations from trials across the U.S. Corn Belt.

            Table AI-1: Data sources for parameterization of economic optimum nitrogen
            fertilizer rate (EONR) distributions for corn grown following soybean and corn.

                                           Nitrogen Response Trial Locations (#)
             Previous Crop
                               Minnesota       Iowa      Illinois   Indiana    Ohio     Total

             Soybean               48          212        273         67         80     680

             Corn                  48          120        284          0         36     488
Monte Carlo simulations were used to generate 100 EONRs for corn following corn and corn following
soybeans receiving six different nitrogen fertilizer rates: 125, 150, 175, 200, 225 or 250 lb./acre. Each of
the resulting 1,200 simulated values represented a possible EONR outcome across the locations and years
used to parameterize the underlying distributions. Three additional values were calculated for each
simulated EONR:
1) Yield loss due to insufficient nitrogen fertilizer was calculated as ((EONR – applied fertilizer rate)*1
bu/acre). Negative yield loss values were set to zero.
2) Excess nitrogen fertilizer was calculated as (applied fertilizer rate - EONR). Negative excess fertilizer
values were set to zero.
3) Profit loss was calculated as ((Yield loss * $4.00) + (excess nitrogen fertilizer * $0.60)). For any given
simulation, either yield loss or excess nitrogen fertilizer was zero, as the two phenomena are mutually
exclusive outcomes for any single observation.
Yield loss, excess nitrogen fertilizer, and profit loss values were averaged across the 100 simulations
representing each combination of previous crop and nitrogen fertilizer rate (Figures AI-2, AI-3 and AI-4).
The results of this analysis demonstrated that average yield loss declined to less than 10 bu/acre as
nitrogen fertilizer rates exceeded 200 lb./acre. At the same time, excess nitrogen fertilizer application rose
above 50 lb./acre. Because of the high corn to nitrogen price ratio (6.7), however, the least-risk nitrogen
application rate remained high at 200 lb./acre for corn following soybeans and 225 lb./acre for corn
following corn. At these “optimum” nitrogen input levels, a farmer would still hypothetically lose about
$50/acre on average (Figure AI-4). Results for all 100 nitrogen simulations demonstrate that losses to
inefficient nitrogen management can be much greater in extreme years, when economically optimum
nitrogen rates vary widely from applied rates (Figure A1-5).
Figure AI-2: Yield loss due to insufficient fertilizer nitrogen for
corn grown following corn or soybean managed with varying
nitrogen fertilizer rates. Results are the mean of 100 simulated
outcomes for each combination of previous crop and nitrogen
fertilizer rate.Figure AI-3: Excess nitrogen fertilization for corn grown following corn or soybean managed with varying nitrogen fertilizer rates. Results are the mean of 100 simulated outcomes for each combination of previous crop and nitrogen fertilizer rate. Figure AI-4: Profit loss resulting from the combined effects of inadequate and excess nitrogen fertilization for corn grown following corn or soybean managed with varying nitrogen fertilizer rates. Results are the mean of 100 simulated outcomes for each combination of previous crop and nitrogen fertilizer rate.
Figure AI-4: One hundred simulated nitrogen management profit loss outcomes for corn grown following corn or soybean
managed with varying nitrogen fertilizer rates. Each point is the result of a single simulation and represents a possible
outcome at one location or year.
References

Hoeft , R.G., E.D. Nafziger, R.R. Johnson, and S.R. Aldrich. 2000. Modern corn and soybean production.
MCSP Publ., Champaign, IL.

Lambert, D.M., J. Lowenberg-DeBoer, and G.L. Malzer. 2006. Economic analysis of spatial–temporal
patterns in corn and soybean response to nitrogen and phosphorus. Agronomy Journal. 98: 43–54.

Fageria, N.K., and V.C. Baligar. 2005. Enhancing nitrogen use efficiency in crop plants. Advances in
Agronomy. 88: 97–185.

Jaynes, D.B., T. S. Colvin, D. L. Karlen, C. A. Cambardella, and D. W. Meek. 2001. Nitrate loss in
subsurface drainage as affected by nitrogen fertilizer rate. Agronomy Journal. 30:1305-1314.

Mamo, M., G.L. Malzer, D.J. Mulla, D.R. Huggins, and J. Strock. 2003. Spatial and temporal variation in
economically optimum nitrogen rate for corn. Agronomy Journal. 95: 958–964.

Raun, W.R., and G.V. Johnson. 1999. Improving nitrogen use efficiency for cereal production. Agronomy
Journal. 91: 57–351.

Sawyer, J., E. Nafziger, G. Randall, L. Bundy, G. Rehm, and B. Joern. 2006. Concept and rationale for
regional nitrogen rate guidelines for corn. PM 2015. Iowa State Univ. Ext., Ames.
www.extension.iastate.edu/Publications/Pm2015.pdf (accessed 2 Feb. 2014).

Scharf, P.C., N.R. Kitchen, K.A. Sudduth, J.G. Davis, V.C. Hubbard, and J.A Lory. 2005. Field-scale
variability in optimal nitrogen fertilizer rate for corn. Agronomy Journal. 97: 452–461.

                                                            ®, ™, SM
The DuPont Oval Logo is a registered trademark of DuPont.              Trademarks and service marks of Pioneer. © 2014 PHII.
You can also read