Balance of State Continuum of Care Sheltered & Unsheltered Point in Time Report - Arizona Department ...
←
→
Page content transcription
If your browser does not render page correctly, please read the page content below
2020
Balance of State Continuum of Care
Sheltered & Unsheltered
Point in Time Report
Date Issued: July 2020
Karia Lee Basta, Special Needs Administrator
Ryan Vernick, CoC Coordinator
1110 West Washington Street, Suite 310 | Phoenix, AZ 85007
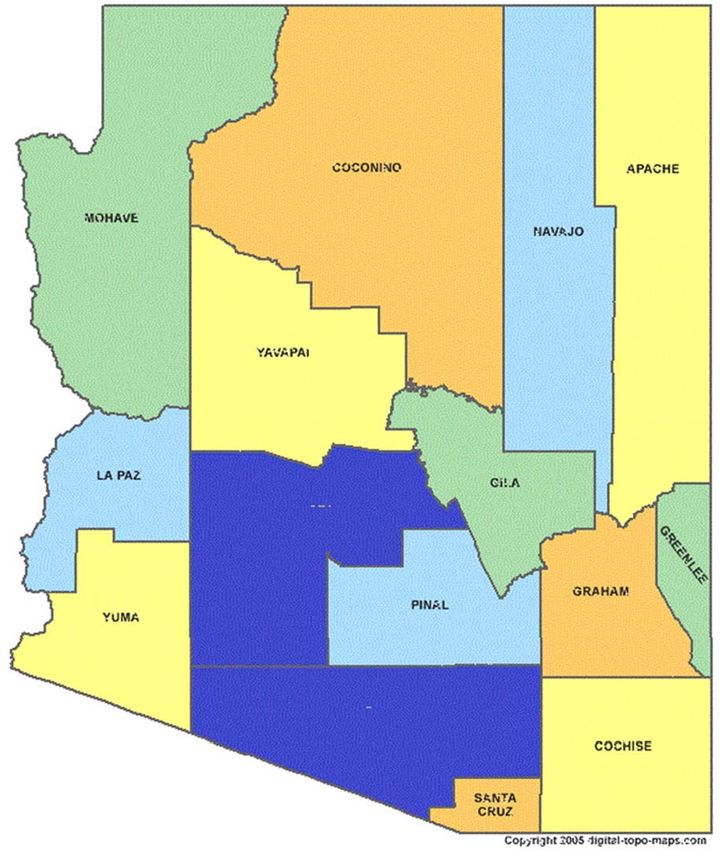
Telephone: (602) 771-1000 | Facsimile: (602) 771-1002 | TTY: (602) 771-1001The Arizona Balance of State Continuum of Care includes thirteen counties—Apache, Cochise, Coconino, Gila, Graham, Greenlee, La Paz, Mohave, Navajo, Pinal, Santa Cruz, Yavapai, and Yuma. ARIZONA BALANCE OF STATE CONTINUUM OF CARE 1
ARIZONA DEPARTMENT OF HOUSING
        ARIZONA BALANCE OF STATE CONTINUUM OF CARE
           2020 UNSHELTERED AND SHELTERED COUNT

ACKNOWLEDGMENTS

   •    Special Thanks to all the individuals who were willing to provide information for the point
        in time count. Without your cooperation, there would not be information to build upon in
        order to implement community solutions to end homelessness in our communities.

   •    Special thanks to 350 plus volunteers who contributed their time to travel to locations
        throughout their counties and interview individuals. Without your contribution, the Point in
        Time Count could not take place and provide information about homelessness throughout the
        counties in the Arizona Balance of State Continuum of Care.

   •    Special thanks to the following agencies and community organization that contributed staff
        time, support and resources, office space for planning and training activities to help make this
        2020 PIT a success:

County                                                     Agencies
Apache         Old Concho Community Assistance Center, Community Volunteers
Cochise        Good Neighbor Alliance, Police Departments of Benson, Huachuca City, Sierra Vista, Tombstone
               and Willcox, City of Sierra Vista Code Enforcement, Cochise County Sheriff's Dept., Mod Pizza,
               Native Grill, Pizza Hut, Schlotzsky's Deli, Street Tacos, and Subway Restaurants, and Douglas
               Tabernacle Church.
Coconino       AZ Community Foundation, Catholic Charities, City of Flagstaff
               Coconino County, East and West Flagstaff Libraries, Flagstaff Police Department, Flagstaff
               Shelter Services, Joe C. Montoya Senior Center
               Northland Family Help Center, Shadow Foundation, Sharon Manor
               Sunshine Rescue Mission, United Way, Veterans Resource Center
Gila           Gila County, Community Members
Graham         CPSA, Community Partners Integrated Health Care
Greenlee       CPSA, Community Partners Integrated Health Care
La Paz         CPSA, Big River Baptist Church, DES, One Seedling, Regional Center for Border Health, VA
               (Prescott Office), WACOG
Mohave         Mohave County Housing Authority (MCHC), Catholic Charities, Cornerstone Mission,
               Guardian, Jerry Ambrose Veterans Center, VA, Veteran Resource Center, WACOG
Navajo         Old Concho Community Assistance Center, Community Volunteers, White Mountain Apache
               Tribal Community
Pinal          CAHRA, Casa Grande Police Department, CBI, City of Apache Junction
               City of Casa Grande, Community volunteers, Empowerment Systems
               Horizon Health and Wellness, NCHP, Pinal County Housing Department, Apache Junction Food
               Bank, City of Apache Junction
               Empowerment Systems, Genesis Project, Horizon Health and Wellness,
               La Frontera, and St George Catholic Church.
Santa Cruz     CBI
Yavapai        VA, VRC, NACOG, U.S. Vets, Arizona Department of Economic Security

ARIZONA BALANCE OF STATE CONTINUUM OF CARE                                                                      2
County Agencies
Verde Homeless Coalition, The Cottonwood Mission, Terros Health, West Yavapai Guidance
Center, Coalition for Compassion and Justice
Yuma Arizona Complete Health, Community volunteers, DES, NAU, NCHP
Special thanks to our consultant, Candee Stanton, for her expertise and guidance through the entire
Point in Time Count and Survey. Her planning coordination and guidance plus production of the final
report is invaluable in our efforts to end homelessness for all Arizonans.
NOTE: The Arizona Balance of State Continuum of Care data report and individual county data
reports can be found at the Arizona Department of Housing website. These reports provide
additional detail about the information provided in summary form in this report.
https://housing.az.gov/documents-links/forms/special-needs-continuum (scroll down to Point In Time
Reports)
Archived reports for prior years are located at:
https://housing.az.gov/documents-links/forms/special-needs-archives
Individual Counties’ Data Reports
• Each county has its own data report that provides information specific to the community.
• For the tables that provide data about conditions, the total number of conditions named may be
larger than the number of individuals counted. The reason for this is that individuals were able
to choose multiple conditions in each category.
• Demographic data provides the total of individuals interviewed and the household members
they identified.
• The final table in the report provides a summary of housing units included in the HUD Housing
inventory including the number of projects, types of projects, number of persons housed and the
capacity. Projects include those that report through HMIS and those pocket and domestic
violence shelters that completed the survey distributed as a part of the point in time process.
ARIZONA BALANCE OF STATE CONTINUUM OF CARE 3OVERVIEW
The Arizona Department of Housing (ADOH) is the Collaborative Applicant for the Arizona Balance of
State Continuum of Care (AZBOSCOC). The U. S. Housing and Urban Development Department (HUD)
requires that communities that provide services to persons who are experiencing homelessness and
receive HUD funding for housing projects must convene a continuum of care. The AZBOSCOC has
many responsibilities including:
• Planning and implementing services for persons who are experiencing homelessness in thirteen
counties in Arizona including Apache, Cochise, Coconino, Gila, Graham, Greenlee, La Paz, Mohave,
Navajo, Pinal, Santa Cruz, Yavapai, and Yuma.
• Through the Arizona Department of Housing as fiscal agent, the AZBOSCOC makes permanent
supportive housing, transitional housing, and rapid re-housing services available to persons who
are experiencing homelessness in the counties identified above.
• Coordinated Entry and Case Conferencing activities to provide individuals access to services and
ensure that resources are allocated equitably and in response to the highest need.
• The Yearly Sheltered Count – As required by HUD, the number of
persons who are in emergency shelter, transitional housing and
permanent housing must be counted in a single point of Agencies that do not input data
into HMIS but share aggregate
time count that takes place annually during the last
data for the PIT:
weeks in January. This count includes all agencies
Domestic Violence Shelters
that enter data in the Homeless Management Pocket Shelters
Information System (HMIS). Although HUD considers PHA’s with VASH
only those in emergency shelter and transitional housing as
“homeless” for the purposes of the count, those in permanent
housing are also counted to give an overall picture of persons housed
by service providers that serve those who experience homelessness.
• The Yearly Unsheltered Count – In addition to the sheltered count, HUD also requires continuums
of care to count persons who are unsheltered as a part of the point in time count. This count takes
place during the last two weeks in January. ADOH provides coordination for this effort statewide,
but Local Coalitions to End Homelessness’ (LCEH) provide administration and logistics planning at
the local level. In 2020, this count occurred during the last 10 days in January.
• Volunteers are the key resource for completing the point in time count. In 2020, 355 volunteers
contributed time and energy to complete the count.
IMPROVEMENTS:
Over the years, the LCEH have developed a standing PIT Committee that facilitates logistics in
local communities
The survey tool has evolved.
Additional training of volunteers takes place in person at the local level in addition to the ADOH
training webinars.
Crisis Response Network (CRN) has worked with providers to enhance the accuracy of
information entered in HMIS.
ARIZONA BALANCE OF STATE CONTINUUM OF CARE 4KEY CONSIDERATIONS
• Occupancy in emergency shelters (including domestic violence shelters) increased to 91.81% in 2020
from 85.4% in 2019. Increased utilization of shelters is key to engaging individuals into services
and options for housing.
The overall occupancy rate for all types of housing (i.e.
emergency shelter, permanent housing, rapid rehousing,
Utilization rates and transitional housing was 99.57%, an increase from
increased across all 92.01% in 2019. This is an indication that coordinated
types of housing entry is effective in connecting individuals with
housing. Non Continuum of Care resources funded by
the Arizona Department of Housing, ESG funds administered
by the Arizona Department of Economic Security, and Veteran
specific resources are fully utilized and have been effective in
contributing to ending homelessness in the Balance of State
Continuum of Care geographic area.
• The AZBOSCOC experienced an increase in the number of unsheltered households. The following
graph provides an overview of the number of households and the number of individuals in those
households from 2017 to 2020. From 2019 to 2020, there was a 19.5% increase in the number of
individuals counted during the Point in Time Count
2017-2020 Unsheltered PIT Count
1400
1175
1200 1085
983
1000 902 860
786
800 722
631
600
400
200
0
2017 2018 2019 2020
# of Persons interviewed (Households)
Total # of persons counted (includes person interviewed and additional
HH Members)
• The number of people counted is impacted by a variety of factors including weather conditions and
the number of volunteers available in each community. The structure of the AZBOSCOC has evolved
with the establishment of the Local Coalitions to End Homelessness (LCEH). As the LCEHs have
solidified the structure and engagement process from 2017 to the present, the structure of how the
counts have been conducted have been positively impacted.
• The AZBOSCOC in partnership with CRN, the HMIS Administrator, is finalizing mechanisms that
will provide current System Performance (SPM) information (through data dashboards) to the
ARIZONA BALANCE OF STATE CONTINUUM OF CARE 5LCEHs so that strategies to end homelessness in local communities will be responsive to current
conditions.
• For 2020, 138 (16%) of the individuals interviewed indicated that they had served in the Armed
Forces. This is in comparison to 123 (15.65%) in 2019, 162
(17.9%) in 2018, and 125 (19.8%) in 2017. The reduction of The number of
unsheltered Veterans as a percentage of all individuals Veterans that were
interviewed over time, is the direct result of increasing unsheltered
housing resources in programs that serve Veterans remained stable and
was lower than 2017
specifically including VASH, GPD, and SSVF.
and 2018.
• Survivors of domestic violence were 25.4% of all individuals
interviewed in 2020. The AZBOSCOC as a part of the 2019 NOFA, was awarded two new rapid
rehousing programs that will house survivors. The programs are located in Mohave and Pinal
Counties.
• In 2020, 46.8% of individuals and household members counted met the definition of chronically
homeless. This was essentially unchanged from 46.7% in 2019.
Persons and HH members who meet defintiion of chronically homeless
600 551 48%
478 460
500 431 46.80% 47%
388 374 398
400 46.70% 46%
300 45%
200 44% 153 44%
86
100 47 43%
0
0 42%
2017 2018 2019 2020
# of Persons Interviewed who meet the chronically homeless definition
# of Household Members
Total
% of total persons counted
Those who meet the definition of chronically homeless have been homeless for 12 months or more or
have experienced several periods of homelessness over a three-year period of time. In addition, the
individual has a significant condition that impacts daily functioning. The AZBOSCOC has
implemented several strategies to prioritize households who meet the definition. They include:
implementation of Housing First, designation of all permanent supportive units as dedicated plus
indicating that the unit is prioritized for households who meet the definition.
• LCEHs continue to refine the use of coordinated entry to match individuals who are experiencing
homelessness with housing resources. Based on System Performance Measures, from 2015 through
2018, the AZBOSCOC, (except for 2015) was lower than the national average of returns to
ARIZONA BALANCE OF STATE CONTINUUM OF CARE 6homelessness at 24 months 1. (Returns are based on individuals documented in HMIS without regard
for the funding source of the housing that the individual occupied)
Returns to Homelessness at 24 months
25%
22%
20.10% 20.40% 19.60% 19.40%
20% 18% 18%
16%
15%
10%
5%
0%
2015 2016 2017 2018
AZBOSCOC Average National Average
IMPACTS TO THE COUNT
• The AZBOSCOC has conducted unsheltered point in time counts since 2008. Originally, unsheltered
counts were completed every other year and sheltered counts every year. In 2015 the AZBOSCOC
made the commitment to conduct unsheltered counts every year. This decision aligned the
AZBOSCOC with HUD’s increasing use of data related to program and funding decisions.
Completing the unsheltered count every year provides the AZBOSCOC with timely information for
decision making and improves the ability to be competitive in the HUD Notice of Funding
Availability (NOFA) process.
• The survey and methodology for the unsheltered count has improved yearly based on ongoing
feedback from LCEHs and local Point in Time Coordinators. In 2019 and continuing in 2020, a
Spanish version of the survey was available.
• Local Coordinators have helped develop consistent methodologies related to volunteer recruitment
and training. All LCEHs now conduct local training for the unsheltered count.
• Beginning in 2014, HUD refined the count and added sub-populations beyond the general count
including households that met the definition of chronically homeless, veterans, survivors of domestic
violence, and unaccompanied youth.
• The weather conditions can dramatically impact a count. When there are severe winter storms and
below freezing weather, which does occur in the northern counties, it can be difficult to conduct a
robust count. For 2020, the weather in northern counties was mild, thus more volunteers were able
to cover broader areas of the counties resulting in increased face to face interviews.
METHODOLOGY
Arizona conducted the unsheltered count from January 21st thru Sunday, January 26th , 2020 with the 21st
being the night in question for “Where did you sleep?” Persons were interviewed for the count from all
thirteen counties in the CoC geographic area. Individuals were identified as experiencing homelessness
1 https://icalliances.org/spm-compare
ARIZONA BALANCE OF STATE CONTINUUM OF CARE 7in all counties except Greenlee. Volunteers and the LCEH Count Coordinators are the critical
components of the count. Safety for the both the individuals being surveyed and volunteers is always
stressed. We always cover in a training to beware of surroundings and there must always be teams of at
least two, three is best.
Persons who came to locations such as feeding programs were asked if they would participate in a brief
survey. Volunteers and agency staff also outreached to locations where individuals have gathered
including encampments in the desert, forests, or mountains. Persons who participated were offered a
small token of thanks such as socks and/or hygiene items for participating. Only persons who slept in a
place not meant for human habitation, such as a car, on the street, in a riverbed, in the forest or some
similar location were counted. In 2020, persons were counted in 12 of the 13 counties in the AZBOSCOC
geographic region. The following provides an overview of the surveys collected by county:
# of persons
County interviewed # of HH members Total # of Persons %
Apache 4 1 5 0.43%
Cochise 58 14 72 6.13%
Coconino 51 14 65 5.53%
Gila 36 8 44 3.74%
Greenlee 0 0 0 0
Graham 7 0 7 0.60%
La Paz 178 135 313 26.64%
Mohave 162 39 201 17.11%
Navajo 32 5 37 3.15%
Pinal 159 52 211 17.96%
Santa Cruz 12 0 12 1.02%
Yavapai 70 23 93 7.91%
Yuma 91 24 115 9.79%
Totals 860 315 1175 100.00%
As in past years, the majority of the persons interviewed are
living solo. Of those that were interviewed 663 (77%) were
Most Individuals solitary and 162 (18.8%) were in households with other adults.
Counted Only 35 (4%) of the individuals were in households that
included children under 18.
• Over the age of 35
• Male The majority of individuals were between the ages of 35 and
• Caucasian 75+ (64.34%). The individuals identify primarily as male
(64.77%). In addition, the majority of individuals are White
(73.02%). Of all individuals counted, 144 (12.26%) identified
as Hispanic/Latino/Chicano. Demographics of individuals
interviewed, and their household members are as follows:
ARIZONA BALANCE OF STATE CONTINUUM OF CARE 8GENDER
# of persons # of HH Total # of
Gender interviewed members Persons %
1-female 236 159 395 33.62%
2-male 616 145 761 64.77%
3-transgender 4 6 10 0.85%
4-non-conforming 4 5 9 0.77%
860 315 1175 100.00%
AGE
# of persons # of HH Total # of
Age Range interviewed members Persons %
1-under 18 0 62 62 5.28%
2 18-24 72 52 124 10.55%
3 25-34 153 80 233 19.83%
4 35-44 170 41 211 17.96%
5 45-54 175 46 221 18.81%
6 55-64 201 29 230 19.57%
7 65-74 76 5 81 6.89%
8 75+ 13 0 13 1.11%
860 315 1175 100.00%
RACE
# of persons # of HH Total # of
Race interviewed members Persons %
1-White 645 213 858 73.02%
2-African American 36 35 71 6.04%
3-Asian 2 0 2 0.17%
4-Hawaiian 2 0 2 0.17%
5-Native American 102 38 140 11.91%
6-Many (Multiple) 73 29 102 8.68%
860 315 1175 100.00%
ETHNICITY
Ethnicity (Latino, # of persons # of HH Total # of
Hispanic, Chicano) interviewed members Persons %
Yes 111 33 144 12.26%
HOMELESSNESS STATUS
Of the individuals interviewed, 47.33% indicated that they had spent the night camping. The second
highest response was sleeping in a vehicle at 19.65%. Of those interviewed, 31.16% reported being
homeless less than one year, 27.91% reported being homeless one to three years, and 37.21% reported
themselves as being homeless more than three years. Those experiencing homelessness for the first time
was 41.05%.
ARIZONA BALANCE OF STATE CONTINUUM OF CARE 9REASONS FOR HOMELESSNESS
Individuals were asked about their circumstances, which resulted in their current situation in three major
areas—economic, domestic, and medical. Individuals could choose multiple conditions in each area.
The most common conditions for each major area included:
Economic: 15.40%-loss of job; 14.67%-unable to pay rent or Reasons for Homelessness
mortgage, 9.64%-eviction.
Domestic: 11.93%--overcrowding; 10.88%--divorce/separation;
Economic
8.34%--housing situation not safe.
Domestic
Medical: 18.71%--medical condition; 17.54%--physical
Medical
disability; 15.59%--mental disability. Of all individuals
interviewed, 27.33% indicated they had health care coverage.
In addition, to the areas described above, specific questions were asked about the conditions that
contribute to a person meeting the definition of chronically homeless. (Individuals were able to have
multiple answers).
Conditions Individuals Reported
350 311 30.00%
27.57%
300 25.00%
250
190 20.00%
200 180 169
16.84% 15.96% 135 14.98% 15.00%
150 11.97%
79 10.00%
100 59 7.00%
50 5.23% 5.00%
5
0 0.44% 0.00%
# %
Of the persons interviewed, 254 (29.53%) did not report any of these conditions. Of those who did report
a condition, 54.62% only reported having one of the conditions identified in the table above.
Employment/Income
Only 17.44% of individuals interviewed, indicated some sort of employment.
ARIZONA BALANCE OF STATE CONTINUUM OF CARE 10Employment Status
800 90.00%
710
82.56% 80.00%
700
600 70.00%
60.00%
500
50.00%
400
40.00%
300
30.00%
200 20.00%
100 67 43 40 10.00%
7.79% 5.00% 4.65%
0 0.00%
1-yes 2- yes per diem day labor 3- yes seasonal 4-no
# %
Individuals were also asked about sources of income. For those that had income, the primary source was
panhandling (20.23%), followed by Social Security (17.74%). The table below provides a summary of all
responses.
Sources of Income
300 267 30.00%
27.70%
250 195 25.00%
200 171 20.23% 20.00%
17.74% 134
150 13.90% 15.00%
100 69 55 10.00%
7.16% 42
50 5.71% 4.36% 4 18 9 5.00%
0 0.41% 1.87% 0.93% 0.00%
# %
SHELTERED COUNT
In addition to the unsheltered count, HUD requires a point in time count related to individuals that were
sheltered in temporary housing such as emergency shelter and transitional housing. For 2020, there
were 830 emergency shelter beds and 231 transitional housing beds that were occupied at the Point in
Time Count. This represents a utilization rate of 93.40%. The following chart provides detail.
% of Total
# occupied % of Total # of beds available Utilization
Project Type Beds-
beds Occupied Beds (capacity) Rate
Capacity
Emergency Shelter 830 78.23% 904 79.58% 91.81%
Transitional
231 21.77% 232 20.42% 99.57%
Housing
1061 100.00% 1136 100.00% 93.40%
ARIZONA BALANCE OF STATE CONTINUUM OF CARE 11Within the project types, some beds are dedicated to a specific population:
• 282 (33.97%) of the occupied ES beds were dedicated to survivors of domestic violence. For
capacity 357 (39.49%) were dedicated to survivors of domestic violence
• 88 (38.09%) of the occupied TH beds were dedicated to survivors of domestic violence. For
capacity, 89 (38.36%) were dedicated to survivors of domestic violence.
HOUSED COUNT
HUD also requires a count of individuals and beds available in permanent housing projects including
rapid rehousing, permanent supportive housing, and other permanent housing. The following chart
provides detail related to the permanent housing projects:
% of Total
# occupied % of Total # of beds available Utilization
Project Type Beds-
beds Occupied Beds (capacity) Rate
Capacity
Rapid Re-Housing 840 43.41% 840 43.41% 100.00%
Permanent
1087 56.18% 1087 56.18% 100.00%
Supportive Housing
Other Permanent
8 0.41% 8 0.41% 100.00%
Housing
Totals 1935 100.00% 1935 100.00% 100.00%
Similar to dedicated beds for temporary housing some beds in permanent housing projects are dedicated
to specific populations. Of all the permanent housing beds counted, 35.40% were dedicated to Veteran
Households. The following chart provides a summary of beds dedicated to housing Veteran households:
Total Beds
% of Beds Occupied by
Occupied by Total PIT Count by
Project Type Veteran Households
Veteran Project Type
of Total PIT Count
Households
Rapid Rehousing 141 840 16.79%
Permanent Supportive Housing 536 1087 49.31%
Other Permanent Housing 8 8 100%
Totals 685 1935 35.40%
Dedicated beds for households/individuals who met the definition of chronically homeless)
Most households that meet the definition of chronically homeless (CH) are housed in permanent housing
particularly permanent supportive housing. The following chart indicates the number of beds that were
dedicated to households that met the definition.
Beds Occupied by Beds Occupied by
CH Households CH Households PIT Total
Project Type # of Projects with Children without Children Count Beds
Permanent
Supportive
Housing 32 244 284 528 528
In 2017, HUD through the NOFA added the category of dedicated plus. This allowed additional beds to
be dedicated to chronically homeless even if they had not initially been when the contract was first
ARIZONA BALANCE OF STATE CONTINUUM OF CARE 12executed. As a contract requirement, the implementation of Housing First and the use of the VI-SPDAT,
the priority is to place households that are considered chronically homeless first. In 2020, 528 (48.5%) of
all PSH beds were occupied by households that met the definition of chronically homeless.
INVENTORY OF ALL PROJECTS (BOTH SHELTER AND PERMANENT HOUSING
In addition to the point in time count for unsheltered and sheltered persons, HUD also requires a
submittal of a housing inventory inclusive of all temporary and permanent housing projects. The
following chart provides an overview from 2017-2020 of the number of projects (inclusive of emergency
shelter, permanent housing, rapid rehousing, and transitional housing), the capacity of the projects and
how many beds were occupied for the point in time count.
2017 2018 2019 2020
Number of Projects 100 108 119 127
Number of available beds in those 2536 2945 3004 3071
projects
Number of beds occupied the night 2372 2741 2764 2996
of the count
Bed utilization rate 93.5% 93.07% 92.01% 97.55
Considerations:
• The number of projects fluctuates from year to year as new projects were added or consolidated. In
addition, projects that do not participate in HMIS fluctuate as well. Projects may not provide
information each year. As an example, HUD required that the Veterans’ Domiciliary (in Prescott) be
included in prior year counts but excluded it for the count in 2016 and future years.
• The number of beds available may fluctuate due to Fair Market Rents.
• Total number of beds may include beds that were added to accommodate seasonal needs (i.e.
winter/summer specific beds, overflow).
• Arizona Department of Housing, The Arizona Department of Economic Security and Veteran
programs have funded additional units during this time resulting in an increase of available units.
• From 2017 through 2020, there has been a 27% increase in the number of projects in the Balance of
State geographic area. In addition, the number of beds available increased by 18.45%.
ARIZONA BALANCE OF STATE CONTINUUM OF CARE 13CONCLUSION The Point in Time Count continues to be a critical component in ending homelessness in the communities in the AZBOSCOC. It paints a picture so that local stakeholders can implement strategies to ensure the individuals and families have access to needed services and housing in order that they may regain self-sufficiency. ARIZONA BALANCE OF STATE CONTINUUM OF CARE 14
You can also read