Investor Presentation - Full Year 2019 Results April 2020 - GPI
←
→
Page content transcription
If your browser does not render page correctly, please read the page content below
Investor Presentation
Full Year 2019 Results
April 2020
The Health Care Background
 HEALTH CARE:                          A CHANGING MARKET                           HEALTH CARE EXPENDITURE
 A LINCHPIN MARKET                     •   aging and life expectancy               Italy 2017
 able to influence the economic        •   chronic diseases                        155 B€
 growth of a Country, to keep          •   urbanization
                                                                                   (73% public- 27% private)
 grip on public finances and           •   shortage of MD and of
 social cohesion                           economic resources                      9.1% GDP
                                                                                   (16.9% USA – 11.1% Germany – 9.8% UK)

                                                                                   20% squander
                                                                                            40% of which inefficient
                                                                                            care coordination

INCREASED               THE CHALLENGE: make the                        OPPORTUNITY
DEMAND OF               health care systems more                       ORGANISATIONAL AND
HEALTHCARE              sustainable, containing costs and              TECHNOLOGICAL RENEWAL (digital
                        improving quality.                             health) Re-design the processes and the
                                                                       organisational models of the health care
                                                                       institutions                                    2
GPI                                            A History of Growth
                                               30 + years of experience, organic and M&A growth with an
The Healthcare Partner                         excellent track-record of management.

                                               Leadership
MISSION                                        1° player in Italy: Access to Care services
We are an international group, partnering up   3° player in Italy: software solutions for health- and social-care
with the Healthcare Institutions
to ensure the continuous improvement of        International Footprint
internal processes to provide accurate and     offering solutions in more than 60 countries.
efficient care pathways through bespoke
software, services and technologies
                                               Uniqueness
                                               integrated software, technology and service solutions to
VISION                                         optimise clinical, care and administrative and pathways.
We aim at being the leading partner in the
route to innovation for care, therapy and
                                               Quality of Life
preventive models to ensure health and well-   Our competencies implement solutions and services that help
being.                                         improve the quality of life.

                                                                                                       3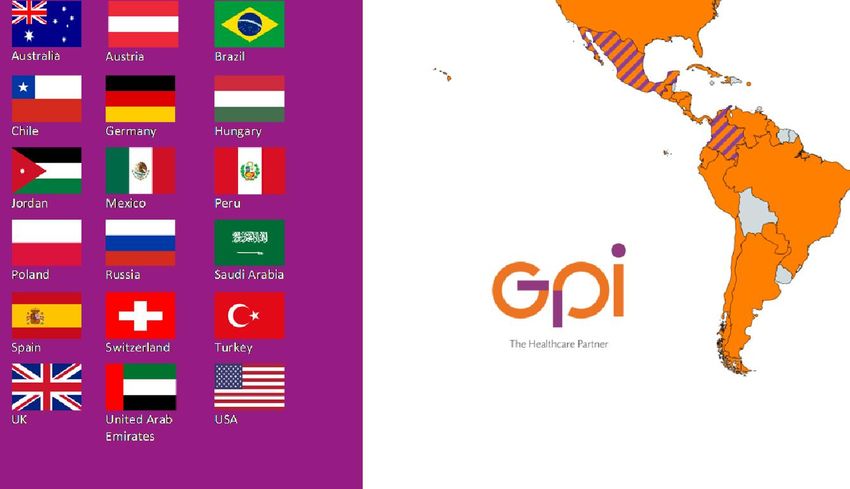
STRATEGIC BUSINESS UNITS
                                                     Total Revenue Share

TECHNOLOGIES
50.6%
  Software 38.1%

  ICT 4.9%                                         SERVICES
  Automation 4.8%
                                                   49.4%
  Pay 2.8%
                                                          Care

                        Notice: % SBU’s revenue to total FY 2019 revenue   4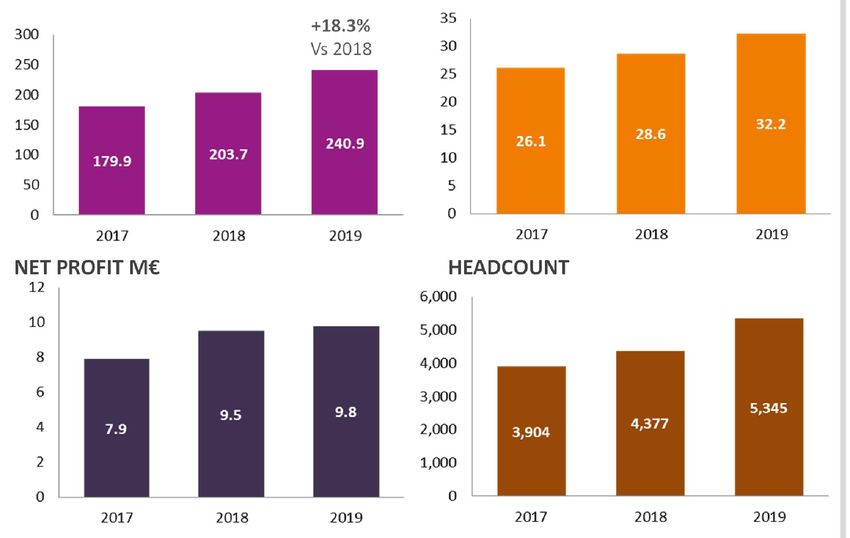
GPI in figures                              A History of
                                            Steady Growth
REVENUE M€                EBITDA M€ *
                +18.3%                      •    2013 Orizzonte equity fund
                Vs 2018                          invested in GPI - First
                                                 minibond issued.

                                            •    2016 merger between GPI
                                        *        and the SPAC CFP1.
                                                 Start of trading in the stock
                                                 market AIM Italia.

                                            •    2018 graduated from AIM
                                                 to MTA main market of
                                                 Borsa Italiana.
NET PROFIT M€             HEADCOUNT
                                            •    > 75 mln M&A deals

                                            Revenue 2016-2019
                                            + 20.9% CAGR
                                            + 27.6% CAGR Organic

                                            * EBITDA 2017 and 2018 one-time costs
                                            removed; 2019 IFRS 16 effect included

                                                                          5
Segmentation

         REVENUE                                        EBITDA                                      REVENUE                                    REVENUE
          BY SBU                                        BY SBU                                   BY GEOGRAPHY                            BY CLIENT SEGMENT *

         Other                                         Other                                        Overseas                                       NH-Pri
         12.5%       Software                                                                                                                       8.8%
                                                       11.5%                                         8.3%                                    NH-Pub
                      38.1%
                                                                                                                                              6.8%
                                                Care        2019                                                                           H-Pri
            2019                               20.4%        adj.                                        2019                               9.0%        2019
           Revenue                                         EBITDA                                      Revenue                                     Revenue

          Care
                                                        Software                                                                                         H-Pub
         49.4%                                                                                            Italy 91.7%
                                                         68.1%                                                                                           74.5%

*Customers profiles -- H-pub: Health care Public ; H-Pri: Health care Private, NH-Pub: non-Health care Public; NH-Pri: non-Healt hcare Private
                                                                                                                                                                 6
Tenders’ Win Ratio**
               SBU Software                                                                            •      35%
                                                                                                       Predictable Revenue
      adj. REVENUE M€
                                                                                                       • 50%
                                                               Product Lines
                                                                                                       Client Retention
                                                       Other
                                                       30%
                                                                                                       • 91%
           90.3              90.8                                               Clinical
                                                                                System                 Contract Duration
                                                                                 35%
                                                                                                       •      1-3 years

           2018             2019
                                                                                                       Awarded contracts value
                                                                                                       (annual average of the last 3 years)
                                                      HR
                                                     10%                                               •     6-7 M€/year
         EBITDA M€                                         Blood           Health
           24.7%           24.2%                           Bank            Admin                       Company ranking
                                                            10%             15%                        •     3rd player in Italy
           22.3 *           21.9

                                                                                           ** Win ratio as a % of wins to n° of bids.
          2018             2019                                                            Conversion win ratio is 6.8% (won contracts value to tenders value 2017-2019)
* adj. EBITDA net of listing on MTA one-time costs
                                                                                                                                                             7
SBU Care Tenders’ Win Ratio**
• 40%
adj. REVENUE +30% Predictable Revenue
M€ • 95%
Client Retention
Product Lines • 97%
102.5
Other 2%
78,7 Contract Duration
• 4-6 years
Awarded contracts value
2018 2019 (annual average of the last 3 years)
• 10-15 M€/year
EBITDA M€* Access
to Care
6.4%
95%
Ranking
4.7% • 1st player in Italy
6.6
3.7 *
** Win ratio as a % of wins to n° of bids.
2018 2019 Conversion win ratio is 16.4% (won contracts value to tenders value 2017-2019)
* adj. EBITDA net of listing on MTA one-time costs
8
Other SBUs Automat.
Pay 38.3%
Automation
22.3%
An integrated hardware and software
REVENUE M€ +21% solution for the automation of the logistic
2019 of drugs in health care facilities and retail
Revenue pharmacies.
30.0
24.8
ICT
ICT A turnkey service to maintain our
39.4%
2018 2019 customers’ software and hardware to
Automat. their peak condition.
42.9%
EBITDA M€
Pay PAY
37.8%
12.3%
Innovative technologies and integrated
2019
10.5% EBITDA services making easy for large scale
3.7 retailers, public service and banking to
2.6
managing of electronic payments.
2018 2019
ICT
19.3%
9Remarkable Growth in 2019
Revenue +18.3%, Net Profit +3.1%
• Revenue 240.9 M€, +18.3% M€ 2019 2018
• Care +35.0 %
• Other +21.2 % Revenue & other income 240.9 203.7
• Sw +1.2 %
Adjusted Revenue (1) 223.3 192.9
• 2019 characterized by EBITDA 32.2 28.6
(2)
o 3 acquisitions
o the incorporation of 2 NewCos EBITDA % of adj. Revenue 14.4% 14.8%
o the merger of 1 subsidiary
Profit Before Tax 12.8 12.8
• EBITDA : 32.2 M€ (14.4% of adj. Revenue) Net Profit 9.8 9.5
• Net Profit: 9.8 M€ +3.1%
(1) measurement removes the shares of temporary groups of
firms.
(2) Net of one-time costs for MTA listing fees
10Financial Highlights 2019
GPI maintains CERVED A3.1 Rating
A- S&P |A3 Moody’s | A-1 Fitch
• Net Working Capital
91.3 M€ (75.6 M€ in 2018): M€ 2019 2018
• increase due to the growth of revenue and to the important orders
attracted at the end of the fiscal year; correspondingly, trade
Net Working Capital 91.3 75.6
payables increases (37.8 M€ vs 32.2 M€)
Non-current assets 119.4 (1) 105.2
• warehouse: increased due to SBU Automation (4,8 M€ vs 3,9 M€)
Other operating
(55.8) (50.7)
• Shareholders’ Equity assets/(liabilities)
72.1 M€ (68.6 M€ in 2018 ) NET CAPITAL INVESTED 154.9 130.1
• distribution of 2018 dividends
• profit generated in 2019 Equity 72.1 68.6
• shares repurchase
Net Financial Position 82.8 61.5 (2)
• Net Financial Position
82.8 M€ (69.2 M€ in 2018, IFRS 16 impact included) TOTAL SOURCES 154.9 130.1
• Investments: M&A 1.8 M€ | R&D 7.1 M€ (1) 11.8 M€ included as an effect of applying IFRS 16
(2) Net of 7.7 M€ due to IFRS 16.
11• M&A
Highlights • France
Guyot Walser Informatique Blood
Bank 360 health facilities
• Lazio contract start - 18 batches:
72 M€ in 2 years + 1 year extension (Care: AtC) • Italy
6 million more citizens reached Accura
Chronic disease management
• Veneto tender awarded: Business Process Engineering
79 M€ in 5 + 2 years Data Protection
27.5 M€ GPI’s share (Software: HIS)
8 thousand hospital beds • Overseas + 16.4 % : orders
Automated warehouse (> 2 M€):
• Marche 4 tenders awarded:
• Austria
4 M€ GPI’s share (Software: EPR, AtC, SISTE, DOC)
• China
5 thousand hospital beds • Qatar
• Saudi Arabia
• Minibond 30 M€ • Switzerland
several underwriters, supported by Cassa Depositi e Prestiti (Deposits • Hungary
and Loans Fund) as anchor investor
• Ireland
12COVID-19 AND FORWARD LOOKING STATEMENTS
COVID-19 emergency, our priority issues
• measures to protecting the health of all employees, customers and suppliers
• managing the economics and financials, not losing focus on the longer term
Two possible scenarios
• emergency to end in the short run: revenue and EBITDA increase in 2020
• prolonged emergency: activity and growth plan to be reviewed
To date, orders confirmed and increasing demand
• 24/7 information services on COVID-19
• web solutions, apps and contact centre services to regulate the access to pharmacies, blood test labs and
supermarkets
• software and screening solutions to manage the broad use of oropharyngeal swabs
• apps to drive infected patients into the health care facilities
• …
13Target Market
Competitive
Environment
14Market Analysis | Software
MARKET VALUE
60 B$ -> Global market value of software & services - IT Healthcare (2018)
CAGR 2018-2022 6.2 %
47 % North America CAGR 18 – 22: 6.1%
28 % Western Europe CAGR 18 – 22: 5.4%
10% Mature APAC CAGR 18 – 22: 4.3% || Source: Gartner (2019)
5% Latin America CAGR 18 – 22: 5.3%
4% Greater China CAGR 18 – 22: 13.3%
0.8 B$* -> Italian market value of software & services - IT Healthcare (2018)
1.4% vs the global market CAGR 2018 – 2022: 3,5% || Source: Gartner (2019)
1.7 B€ IT HealthCare addressable market
1.1 B€ software & services - IT HealthCare available market || Source : Netics (2019)
* the different evaluation between the two sources Gartner and Netics arised from different taxonomy: Gartner only counted the healthcare institutions in, while omitted Regions, Ministries
and pharmacies.
15Market Analysis | Software
MARKET TOP PLAYER
Market: SW and svc. - Italy 2018 7.5% GPI’s market share
Focus on Rankin
Company Description
Healthcare g
ICT system and related services for 1st
public & private Healthcare
institutions
ICT services for finance, industry, Through its
telco&utilities, and PA dedicated
healthcare
2nd
34% = 5 Top Players
division
ICT solutions & Care services for 3rd
public & private Healthcare
institutions
Software for hospital processes, 4th
order & risk mgmt. Part of Reply
Group
Digital transformation & ICT Through its 5°
services for industries, energy, dedicated
aerospace, Healthcare, PA, … healthcare
division
|| Source: Netics (2019)
16Market Analysis | Care
ADMINISTRATIVE SERVICES - MARKET VALUE & PLAYERS
n.a. -> Global market value 28+ M citizens reached
not available because of its
heterogeneous nature - international Company Description Ranking
comparison impossible ICT solutions, administrative, health- and social- 1st
care services for public and private healthcare
institutions.
Maintenance services for medical devices, n.a.
footprint in 17 countries.
BPO services (cleaning, safety, logistics, n.a.
healthcare services).
155 M€ -> Italian market value 2017
Local provider of services for healthcare and n.a.
education, operations in Region Veneto.
underestimated market size – a share
of the market is still insourced Local provider of services for healthcare, n.a.
operations in Region Lazio.
|| Source: Netics (2018)
17Customers
+2.200
Public and private customers
Hpub Hpri NHpub NHpri
2019 74.5% 9.0% 6.8% 8.8%
2018 74.0% 13.4% 6.3% 6.3%
• Health Authorities • Private Clinics, • Regions • Large-Scale Distributors
• Hospitals Nursing Homes, ... • Provinces • Banking Institutions
• Public Providers (in-house) • Analytics, Providers • Municipalities • Managers of meal vouchers
• Regions, Provinces (HC) • Trade Associations, • Regional Bodies • No-Food Retailers
Insurance Companies • Universities • Local Organizations (ACI,…)
• Cooperatives • Consortia
• Private Users
• Pharmacies 18Main Customers
LOCAL AUTHORITIES REGIONAL AUTHORITIES PRIVATE ENTITIES
INTERNATIONAL AUTHORITIES
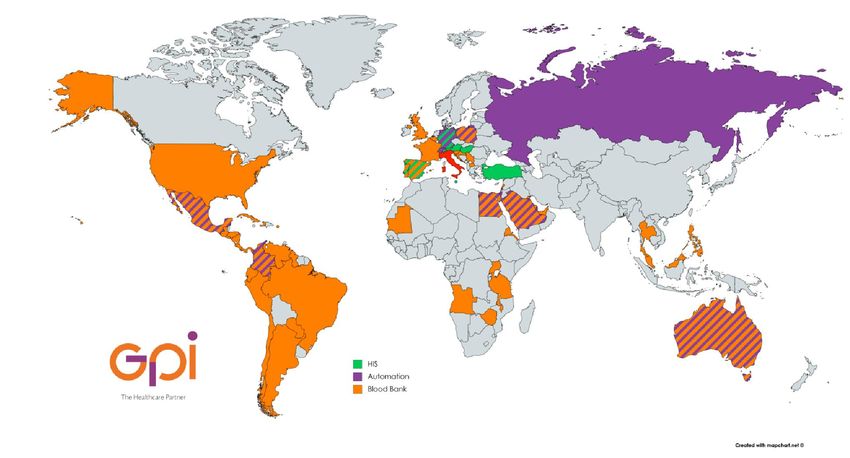
19ITALY
+ 40 Branches
WORLDWIDE
+ 60 Countries
20Strategic
Guidelines
21Strategic Guidelines 2020-2022
01 02 03 04 05
MORE GLOBAL PRIVATE HC LEADERSHIP FROM FROM PROVIDER
GROWTH HEALTHCARE SW PRODUCTS/SERVICES TO TO PARTNER
• +300% in the triennium • doubling in ITALY INTEGRATED SOLUTIONS
(M&A Software company with the % size • big regional/ • Higher integration • Multi-business
20-30 M€ revenues) of this nature
national services | sw |
client contracts tecnological • Structured and complete
segment offer of each SBU, backing
• Geographic targets:
components to respond to the shift from from
• M&A the evolution of the care models and of provider to partner.
DACH, Russia, China, the demand for healthcare. • .
Middle Est, America
• Focus R&D on
Machine
Learning and on digital
transformation
22VISION MISSION
MA
&
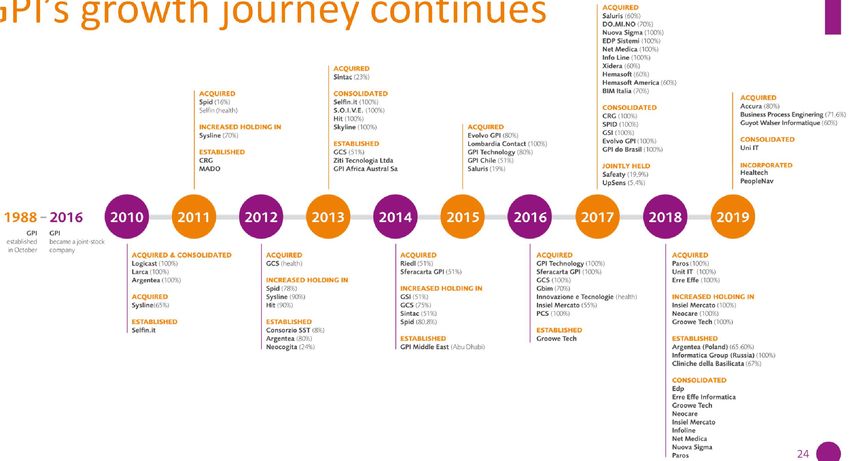
23GPI’s growth journey continues
24M&A Guidelines
TARGET
ITALY
1. Software / Services / Area
Completion (1-10 M€)
2. Big Player
OVERSEAS
1. Structured companies
Software (20-30 M€)
2. Software complement
25Investment Attractiveness
GPI IN THE STOCK MARKET
Leadership and Uniqueness Bloomberg: GPI:IM
15,909,539 Ordinary Shares (ISIN: IT0005221517)
Price: 6.76 € (27 March 2020)
Growth and Visibility Capitalisation: 107.6 M€ (27 March 2020)
ANALYST COVERAGE – Target price
Intermonte SIM (10/10/2019): 11.40 €
Technology and Service Banca Akros (10/10/2019): 12.60 €
UBI Banca (10/10/2019): 11.20 €
IR TOP Research (24/10/2019): 12.35 €
Evolution of market/client
SHAREHOLDING STRUCTURE
M&A Opportunities Float
34.91%
FM SRL
64.37%
Treasury
shares
0.72%
26IR Contacts
Fabrizio Redavid Lorenzo Giollo Maria Antonietta Pireddu
C. +39 335 1035499 C. +39 340 8223333 Via C. Cantù, 1 - 20123 Milan
fabrizio.redavid@gpi.it lorenzo.giollo@gpi.it Tel. +39 02 45473883/4
m.pireddu@irtop.com
Via Ragazzi del '99, 13 - 38123 Trento
T +39 0461 381515
investor. relations@gpi.it
27
- Maggio 2018DISCLAIMER
The material in this presentation has been prepared by GPI S.p.A. (“GPI” or “the Company”) without independent verification and it is general background information
about GPI’s activities current as at the date of this presentation. This information is given in summary form and does not purport to be complete. This presentation is for
information only and shall not constitute an offer or solicitation of an offer to buy or sell securities, nor shall there be any sale or purchase of securities in any
jurisdiction in which such offer, solicitation or sale would be unlawful prior to registration or qualification under the securities laws of any such jurisdiction. It is solely for
use at an investor presentation and is provided as information only. This presentation does not contain all of the information that is material to an investor.
Information in this presentation, including forecast financial information, should not be considered as advice or a recommendation to investors or potential investors in
relation to holding, purchasing or selling securities or other financial products or instruments and does not take into account your particular investment objectives,
financial situation or needs. Before acting on any information you should consider the appropriateness of the information having regard to these matters, any relevant
offer document and in particular, you should seek independent financial advice. All securities and financial product or instrument transactions involve risks, which
include (among others) the risk of adverse or unanticipated market, financial or political developments and, in international transactions, currency risk. The information
in this presentation is confidential and is being provided to you solely for your information and may not be reproduced, retransmitted or further distributed to any other
person or published, in whole or in part, for any purpose. This presentation is only being distributed to and is only directed at (A) persons in member states of the
European Economic Area (other than the United Kingdom) who are “qualified investors” within the meaning of Article 2(1)(e) of Directive 2003/71/EC (as amended and
together with any applicable implementing measures in that member state, the “Prospectus Directive”) (“Qualified Investors”); (B) in the United Kingdom, Qualified
Investors who are investment professionals falling within Article 19(5) of the Financial Services and Markets Act 2000 (Financial Promotion) Order 2005 (the “Order”)
and/or high net worth companies, and other persons to whom it may lawfully be communicated, falling within Article 49(2)(a) to (d) of the Order; and (C) such other
persons as to whom this presentation may be lawfully distributed and directed under applicable laws (all such persons in (A) to (C) above together being referred to as
“relevant persons”).
The information in this presentation may include forward-looking statements. While the Company believes that it has a reasonable basis for making forward-looking
statements in this presentation, GPI cautions you that forward-looking statements are not guarantees of future performance and that its actual results of operations,
financial condition and liquidity and the development of the industry in which GPI operates may differ materially from those made in or suggested by the forward
looking statements contained in this presentation or in oral statements of the management of GPI. Past performance is not a reliable indication of future performance.
GPI assumes no obligation to publicly update or revise any forward-looking statements, whether as a result of new information or for any other reason. The information
and opinions contained in this presentation or in oral statements of the management of GPI are provided as at the date of this presentation or as at the other date if
indicated and are subject to change without notice. No reliance may be placed for any purpose whatsoever on the information contained in this presentation or oral
statements of the management of GPI or on assumptions made as to its completeness. No representation or warranty, express or implied, is given by GPI, its subsidiaries
or any of their respective advisers, officers, employees or agents, as to the accuracy of the information or opinions or for any loss howsoever arising, directly or
indirectly, from any use of this presentation or its contents. This presentation is not directed to, or intended for distribution to or use by, any person or entity that is a
citizen or resident or located in any locality, state, country or other jurisdiction where such distribution, publication, availability or use would be contrary to law or
regulation or which would require any registration or licensing within such jurisdiction.
28
By attending or reviewing this presentation, you acknowledge and agree to be bound by the foregoing.You can also read