A study on the effect of grain morphology on shear strength in granular ma- terials - EPJ Web of Conferences
←
→
Page content transcription
If your browser does not render page correctly, please read the page content below
EPJ Web of Conferences 249, 06013 (2021)                                                                https://doi.org/10.1051/epjconf/202124906013
Powders and Grains 2021

      A study on the effect of grain morphology on shear strength in granular ma-
      terials

      Nicolin Govender1,2,∗ and Patrick Pizette3,∗∗
      1
        University of Johannesburg, Department of Mechanical Engineering Science, South Africa
      2
        Research Center Pharmaceutical Engineering GmbH, Inffeldgasse 13, 8010 Graz, Austria
      3
        IMT Lille Douai, Institut Mines-Telecom, Centre for Materials and Processes, F-59000 Lille, France

                     Abstract. The Discrete Element Method (DEM) has been successfully used to further understand GM be-
                     haviour where experimental means are not possible or limited. However, the vast majority of DEM publications
                     use simplified spheres with rolling friction to account for particle shape, with a few using clumped spheres and
                     super quadratics to better capture grain geometric detail. In this study, we compare the shear strength of packed
                     polyhedral assemblies to spheres with rolling resistance to account for shape. Spheres were found to have the
                     highest shear resistance as the limited rolling friction model could not capture the geometric of rotation grains
                     which caused reordering and dilation. This geometric arrangement causes polyhedra to align faces in the shear
                     direction, reducing the resistance to motion. Conversely, geometric interlocking can cause jamming resulting in
                     a dramatic increase in shear resistance. Particle aspect ratio (elongation and fatness) was found to significantly
                     lower shear resistance, while more uniform aspect ratio’s increased shear resistance with shape non-convexity
                     showing extremes of massive slip or jamming. Thus, while spheres with rolling friction may yield bulk shear
                     strength similar to some polyhedra with a mild aspect ratio, the grain scale effect that leads to compaction
                     and jamming from rotation and interlocking is missed. These results shed light on the complex impact that
                     individual grain shape has on bulk behaviour and its importance.

      1 Introduction                                                            tially developed for geotechnical applications is the most
                                                                                widely used method for the simulation of granular mate-
      The granular materials used in geotechnical applications                  rial. DEM simulations provide detailed metrics on parti-
      are either found in nature, such as sand, rocks, stones or                cle behaviour at the grain scale that allows for the macro-
      created by industrial processing using quarrying, grinding                scopic behaviour to be manipulated or the microscopic be-
      and crushing. The former often have more considerable                     haviour of a given macro response to be determined.
      variability in shape and size, while the latter aims to cre-
      ate a uniform size and shape. While the uniformity of
      processed granular materials is a desired aspect, it is an                2 Particle shape
      energy-intensive task resulting in increased financial and
                                                                                Detailed grain-scale modelling comes at a high computa-
      environmental costs. Therefore, an understanding of how
                                                                                tional cost, with DEM simulations often taking weeks to
      particle shape effects the strength of granular material is
                                                                                months to complete making it unfeasible for most applica-
      critical to enable the use of natural/recycled materials as
                                                                                tions. Thus, to alleviate the computational cost of DEM,
      well virgin material in applications such as railroad bal-
                                                                                grain shape is most often simplified as a sphere. The use
      last, building foundations, and understanding natural phe-
                                                                                of contact models with non-physical parameters such as
      nomena such as landslides. Characteristics such as the
                                                                                rolling resistance with extensive tuning may correctly cap-
      strength, density, and wear of the solid material making up
                                                                                ture the kinematic behaviour of materials with mild devi-
      each grain are often well known with extensive data avail-
                                                                                ations from the spherical shape. However, the majority
      able in various conditions. However, the observed macro
                                                                                of materials used in geotechnical applications are highly
      behavior of granular material due to interactions between
                                                                                non-spherical in stress dominated states. This is the abil-
      the individual grains ( micro-scale) is far less understood.
                                                                                ity of grains to rotate and pack in different configurations
      This is because the ability of experimental devices to mea-
                                                                                that forms the corner-stone of the practical uses of granular
      sure forces between particles is minimal and often intru-
                                                                                material in numerous applications. Thus low fidelity shape
      sive. Thus numerical simulation is the most viable option
                                                                                approximations significantly diminish the real-world value
      to gain insight into the microscopic behaviour of granular
                                                                                of the information extracted from such simulations.
      material. The Discrete Element Method (DEM) [1] ini-
                                                                                    Figure 1(a) depicts a typical gravel particle with Figure
           ∗ e-mail: govender.nicolin@gmail.com                                 1 (b-c) representing linear curve shapes with the common
          ∗∗ e-mail: patrick.pizette@imt-lille-douai.fr                         feature of single point contact between individual grains.
       A video is available at https://doi.org/10.48448/e78f-z126
© The Authors, published by EDP Sciences. This is an open access article distributed under the terms of the Creative Commons Attribution License 4.0
(http://creativecommons.org/licenses/by/4.0/).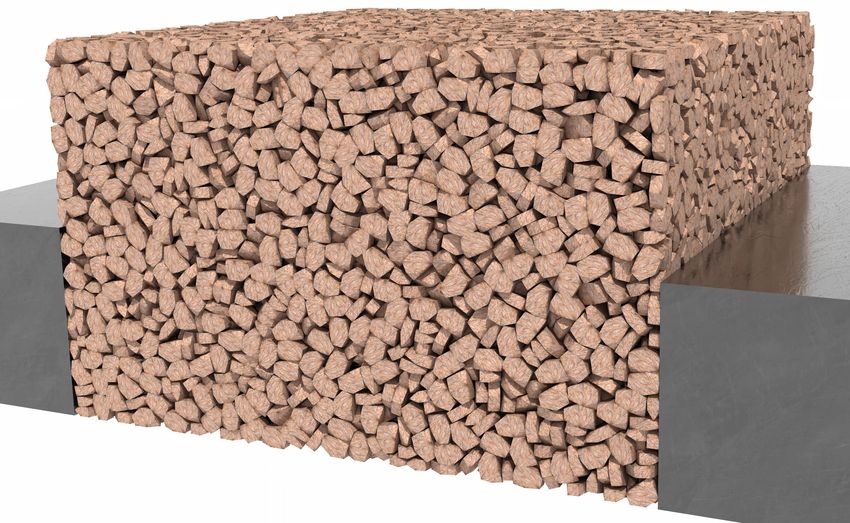
EPJ Web of Conferences 249, 06013 (2021) https://doi.org/10.1051/epjconf/202124906013
Powders and Grains 2021
The clumped sphere approach Figure 1 (d) is the most history having half the normal stiffness and bound by the
common complex shape abstraction; however, the num- Coulomb limit. In the case of spheres a Type B rolling
ber of sub spheres required to achieve the at faces that are model which employs a restive torque that is proportional
typical of gravel is very high. Thus the bumpy surface ar- to both the contact normal force and the relative velocity
tifacts is a caveat of this approach [2]. Figure 1 (e) depicts at the contact point is used with rolling friction coefficient
a polyhedral shape which approximates real gravel shapes of 0.05.
to a high level of accuracy due to faces and sharp edges.
Finally grains can be laser scanned and digitized as trian-
gular meshes which is the most accurate generalized shape
representation which can also be considered as a polyhe-
dral representation of multiple tetrahedrons.
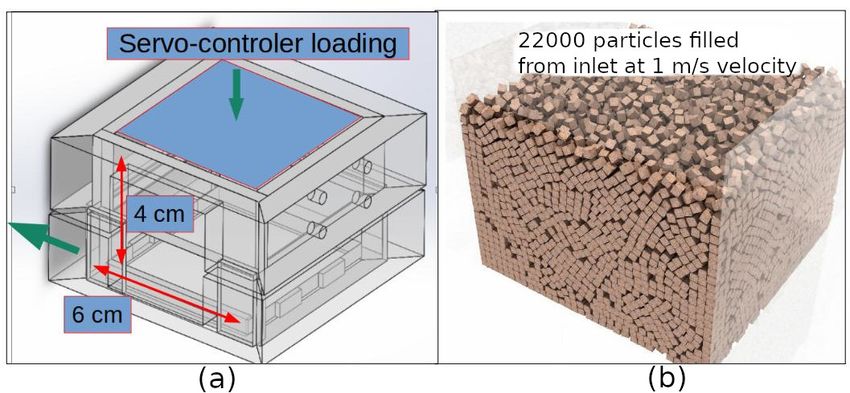
Figure 1. (a) Gravel shape, (b) spherical, (c) super-ellipsoidal, Figure 2. (a) System size and shearing conditions (b) initial un-
(d) clumped sphere and (e) polyhedral shape abstractions. consolidated simulation state.
Particle shape studies in general for large scale dis- Figure 3 (a) shows captured images of the starting and
crete element simulations have received little attention, Figure 3 (b) the end configuration for DEM simulation.
although the industrial importance is well known [2–4]. There is a qualitative match with the shearing of the col-
Large scale industrial discrete element simulations can of- ored bands of simulation in agreement to that of typical ex-
ten only afford abstract particle shapes like spheres or periment from [10] given for sand particles (average size
multi-spheres with few particles. In the past decade, arround 4 mm).
the progress of computing driven by graphical processing
units (GPUs) has seen computational methods suited to
parallel implementations achieve significant performance
increases over traditional CPU implementations. Recently,
it has been demonstrated that convex polyhedral shape ab-
stractions can be computed efficiently and for millions of
particles on GPUs [5–7] compared to the tens of thousands
in the same time-frame on CPU computing architectures
[2, 8, 9]. In this paper, the GPU based code Blaze-DEM
developed by the author is used. While only a modest
number of particles (22,000) is required for this study, the
simulations take only a few hours with cases of a few hun-
dreds of thousands running in a matter of days, making it (a) (b)
possible to study effects in finer materials such as sand and
Figure 3. Front view of (a) initial and (b) final DEM states (Top:
crystalline powders. Qualitative illustration of typical shearing behavior experiment
from [10])(Pcon f 100 kPa).
3 Simulation of direct shear box tests
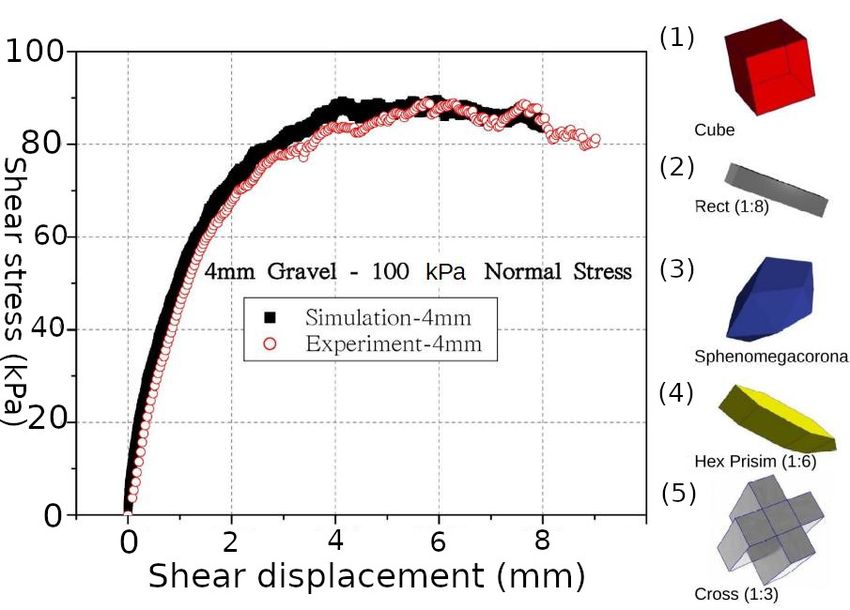
DEM simulations were performed to model the direct Figure 4 (a) shows the shear stress as function of dis-
shear tests to highlight the shape effect. The system size placement for experiment [10] on sand particles (aver-
are similar to the experimental works of [10]. Figure 2 (a) age size arround 4mm) and DEM simulations. There is
shows typical shear-box modeled, the bottom is sheared a good match between both curves with a rapid increase
at a velocity of 0.1 mm/s while the top plate is held at a in stress during the first 25% of motion there after reach-
constant confining pressure Pcon f . Figure 2 (b) shows the ing a plateau. The simulation reaches a slightly higher
DEM simulation with particles in an initial unconsolidated plateau with less fluctuation as result of the perfect geom-
state after filling from a square inlet in a “rain” fashion. etry compared to the imperfect grains. There is a slight
Each particle has a mass of 7.36 × 10⁻⁵ kg with a friction over-prediction of stress in the numerical simulation lead-
coefficient of 0.312 determined from a static repose angle ing to the peak occurring a bit earlier however with the ran-
test and a restitution coefficient of 0.40. A numerical stiff- dom nature of granular material packing such differences
ness of 2E4 (linear spring dashpot) was chosen based on are well within expected deviations as found by O Sullivan
the bulk behavior by matching the height of the gravel bed et al. [11]. It can therefore be concluded that the choice of
in a uni-axial compression test up to confining pressure. numerical parameters as well as the contact method in the
The tangential model is a linear spring with incremental Blaze-DEM software is indeed sufficient. The five polyhe-
2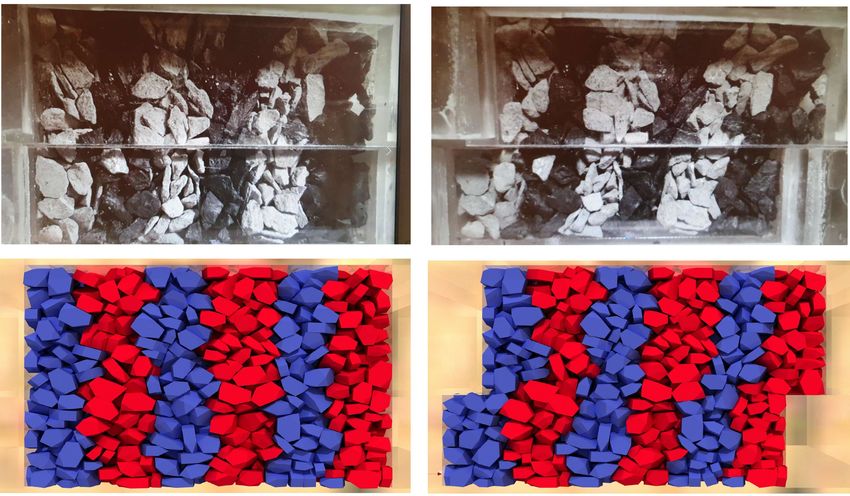
EPJ Web of Conferences 249, 06013 (2021) https://doi.org/10.1051/epjconf/202124906013
Powders and Grains 2021
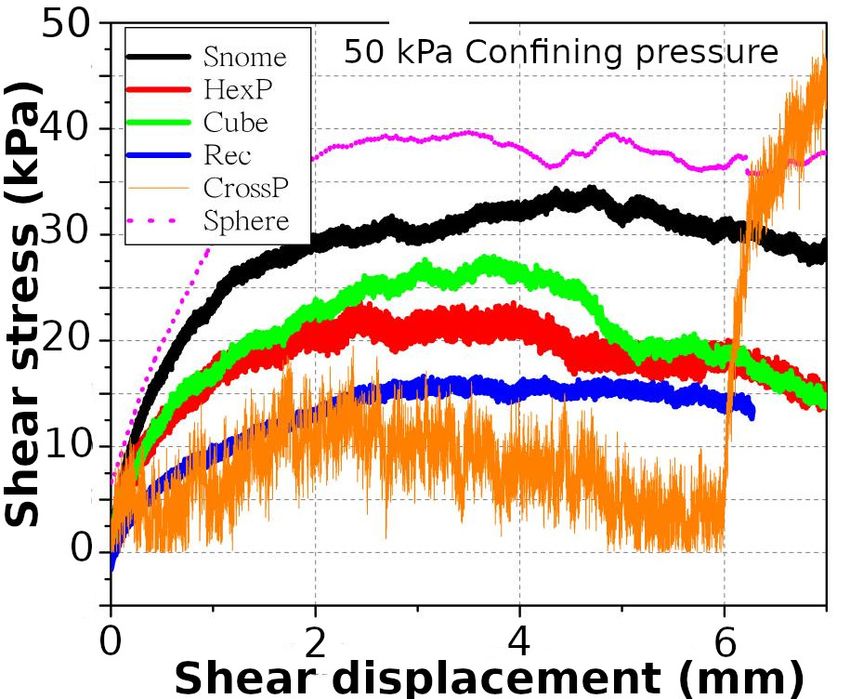
dral particle shapes considered in subsequent simulations kPa. In the case of spheres, a high rolling friction co-
are shown in Figure 4 (b). efficient (0,1) was chosen in this section in order to re-
produce repose angle of the polyhedra. The result shows
that the peak shear stress is the highest despite having the
lowest solid fraction, the peak is also reached the quickest
compared to the polyhedral shapes with the solid fraction
reaching a plateau. The convex polyhedra on the other
hand all reach the peak stress slower and then remain at
a plateau before smoothly decreasing with no major slip
events. There is also no correlation with the solid frac-
tion as the Snome shape has the highest shear stress but
not the highest solid fraction with the Rec shape having
a very similar solid fraction to the Snome shape but half
the peak shear stress. The HexP and Rec shapes which are
(a) (b) “plate like” and in aspect ratio have similar shear stresses
and solid fraction behaviors. The striking difference here
Figure 4. (a) Simulation and experimental [10] stress-strain is with the non-convex CrossP shape jamming after 5.8
curve for 4mm sand and (b) particle shapes used for simulations mm of displacement with an corresponding to an increase
in section 4 (Pcon f 100 kPa). of the solid packing fraction resulting a steep rise in the
shear resistance. The evolution of solid packing fraction
in Figure 6 (b) shows that generally a decrease in solid
Table 3 lists the geometric shapes properties for the
fraction indicates a slip event while a plateau results in a
particles used in the subsequent numerical study. All par-
stable shear behavior. Conversely an increase in solid frac-
ticles have the same mass/volume to ensure a point of sim-
tion as in the case of the CrossP shape indicates a higher
ilarity between the them with the bounding radius differing
shear resistance. The solid fraction also increases through-
to account for this.
out the motion for the CrossP shape illustrating that there
Table 1. Shape properties of 0.1 cm radius volume equivalent is re-arrangement as a result of in-homogeneity.
polyhedra.
Shape SA(cm2) #Faces #Edges Radius (cm)
Cube (a) 0.1633 6 12 0.1428
Rec (b) 0.1840 6 12 0.2126
Snome (c) 0.1532 18 28 0.17208
HexP (d) 0.1652 11 22 0.16636
CrossP (e) 0.2138 14 36 0.16636
Sphere (f) 0.1210 - - 1
(a) (b)
4 Numerical study on shape Figure 6. (a) Stress-displacement curve and (b) solid fraction vs
strain for all shapes at 50 kPa.
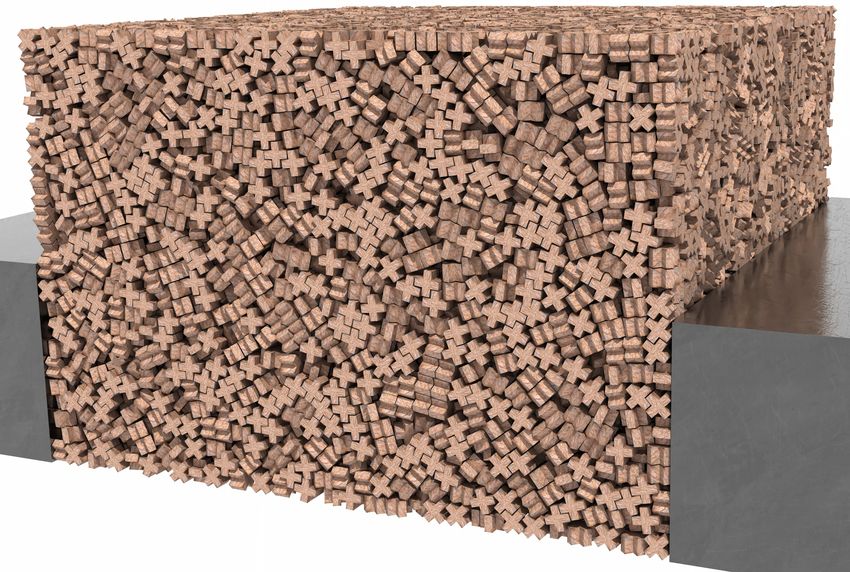
Figure 5 shows a three dimensional view of the packed
states at 50 kPa for the Hex and Cross shapes. They illus-
trate the in-homogeneity in the packing structure of poly- Figure 7 depicts the unbound and final states for se-
hedra as well as the stability of the energy conserving vol- lected shapes. The blocky (cube), elongated (Rec) and
ume contact algorithm used in Blaze-DEM ensuring under non-convex (CrossP) have the sparest packing exhibiting
pressure. in-homogeneity with areas of high packing density as well
as noticeable voids. The CrossP shape has the most in-
homogeneity with a number of preferred orientations re-
sulting in regions where shapes interlock as a solid while
also having areas with very sparse packing. Under load
the cubes orientate to form the most dense packing, while
the spheres have a similar packing to their unbound state.
(a) (b) The Snome shape on the other hand has a more homoge-
Figure 5. Initial packed state at 50 kPa for (a) HexP and (b)
neous packing. Post shearing the cubes under go a fairly
Cross shapes. uniform shearing with the three middle stripes having a
similar shape with the end bands have little shear resis-
tance due to the ordered packing. All polyhedra have a
Figure 6 (a) shows the shear resistance stress as a func- similar symmetric deformation from the middle band to
tion of shear displacement for various shapes with Fig- the end while the spheres show more shear either side of
ure 6 (b) showing the corresponding solid fraction at 50 the middle band. This coupled with the longer plateau of
3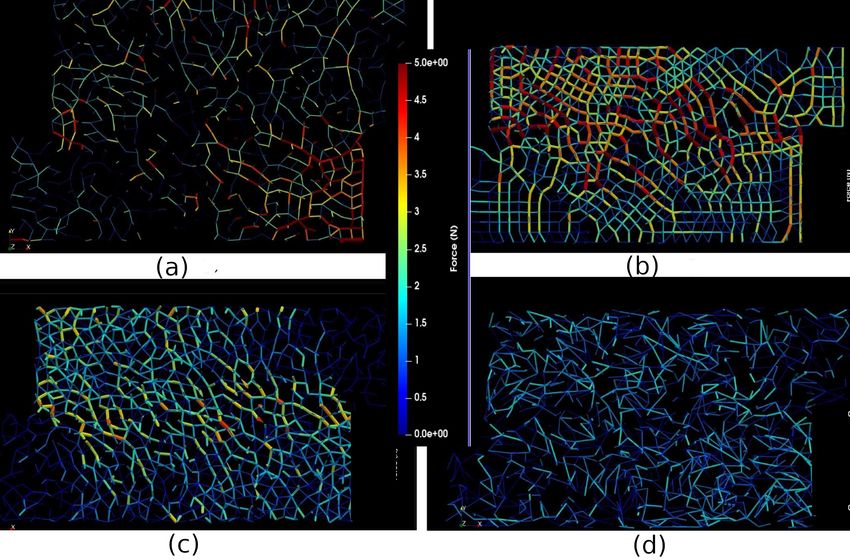
EPJ Web of Conferences 249, 06013 (2021)                                                           https://doi.org/10.1051/epjconf/202124906013
Powders and Grains 2021

      the shear stress and no significant stick/slip indicates that           tribution that covers the width of the shear zone. This
      the ability of polyhedra to rotate changing the geometric               combination of long force chains and uniform contact
      packing and interlocking allows for force to be dissipated              gives the Snome shape the highest shear resistance. Con-
      in a more homogeneous manner.                                           versely the non-convex CrossP shape Figure 8 (d) has short
                                                                              force chains that do not extend past the immediate contact
                                                                              neighbors resulting in a diminished shear response due to
                                                                              localized force transmission. The Rec and HexP shapes
                                                                              are both similar to the Snome shape with the HexP having
                                                                              a more ordered and uniform contact network. This dif-
                                                                              ference in packing homogeneity explains the noisier force
                                                                              curve for the HexP and Rec shapes compared to the Snome
                                                                              due to micro-slip and in the case of cubes and spheres
                                                                              full slip events. Conversely the extremely noisy stress
                                                                              curve for the CrossP particle is a result of its very weak
                                                                              and chaotic contact network. The in-homogeneity of the
                                                                              contact network further asserts the notion that the solid-
                                                                              fraction which is a single metric for the bulk does not pro-
                                                                              vide a meaningful measure between relative systems with
                                                                              the same solid fraction.

                                                                              5 Conclusion
                                                                              The effect of physically considering grain geometry has
                                                                              been demonstrated to be important when assembly shear
                                                                              strength is of interest. Grain irregularity had a signifi-
                                                                              cant effect with shapes that packed such that the result-
      Figure 7. Cross sectional front view image at of unbound and            ing contact angles were isotropic having the highest shear
      final states (Pcon f 50 kPa) (a) sphere, (b) cube , (c) Snome and
                                                                              strength. Shape non-convexity resulted in a system with
      (d) CrossP particle shapes.
                                                                              islands of high and low packing density resulting in a very
                                                                              low shear resistance with slip stick behavior due to grain
          In order to understand the micro-structure the contact              reordering with jamming occurring due to shape interlock-
      force network is plotted in Figure 8. There is a stark                  ing. These results shed light on the complex effect that
      contrast between spheres (a) and the polyhedra with the                 individual grain shape has on bulk behavior and the limi-
      spheres having the least dense network with shorter high                tations of rolling friction with spheres.
      load bearing chains. These shorter chains result in a trans-
      mission of force that is very short ranged occurring mainly             References
      at the moving boundary on the bottom right which is in
      contrast to Figure 8 (b) where the cubes have a long range               [1] P. Cundall, Strack, Geotechnique 29, 47 (1979)
      order network resulting in the force been transmitted from               [2] G. Lu, J. Third, C. Müller, Chem. Eng. Sci. 127, 425
      the bottom right to the top left.                                            (2015)
                                                                               [3] P.W. Cleary, Particuology 8, 106 (2010)
                                                                               [4] C.R.K. Windows-Yule, D.R. Tunuguntla, D.J.
                                                                                   Parker, Comput. Part. Mech. 3, 311 (2016)
                                                                               [5] N. Govender, D.N. Wilke, S. Kok, R. Els, J. Comput.
                                                                                   Appl. Math. 270, 386 (2014)
                                                                               [6] N. Govender, D.N. Wilke, S. Kok, Appl. Math. Com-
                                                                                   put. 267, 810 (2015)
                                                                               [7] N. Govender, D.N. Wilke, P. Pizette, N.E. Abriak,
                                                                                   Appl. Math. Comput. 319, 318 (2018)
                                                                               [8] E. Nezami, Y. Hashash, D. Zhao, J. Ghaboussi, Com-
                                                                                   put. Geotech. 31, 575 (2004)
                                                                               [9] A. Podlozhnyuk, S. Pirker, C. Kloss, Comput. Part.
                                                                                   Mech. 4, 101 (2017)
                                                                              [10] S. Ben-Turkia, in An exp. num. study on the mech.
      Figure 8. Force chain network of the final states (Pcon f 50 kPa)
      (a) sphere, (b) cube, (c) Snome and (d) CrossP particles.
                                                                                   behavior of gran. mat. (PhD Thesis, Univ. Lille,
                                                                                   2020)
                                                                              [11] M.L. Bernhardt, G. Biscontin, C.O. Sullivan, Soils
         The Snome shape shown in Figure 8 (c) has the same                        Found. 56, 336 (2016)
      long chains like cubes but with a symmetric force dis-

                                                                          4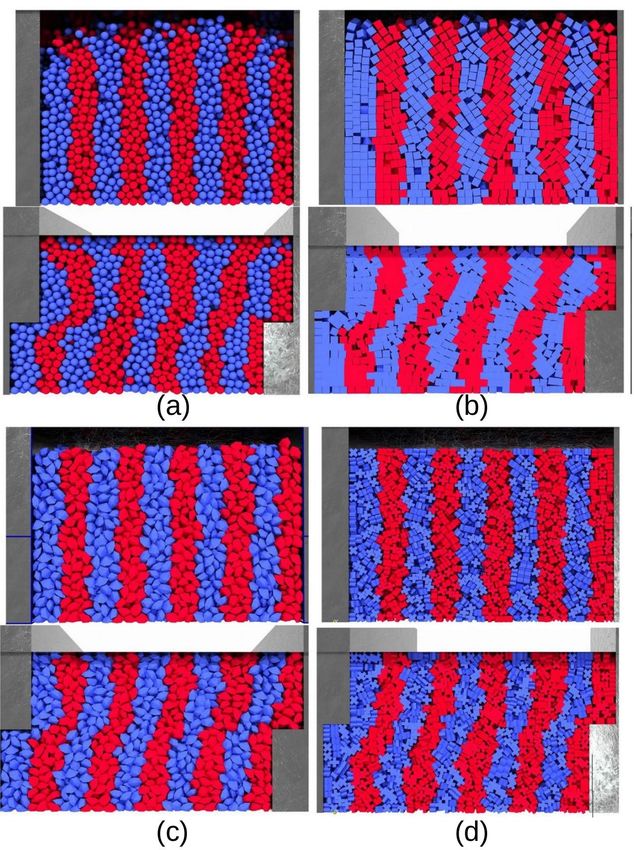
You can also read