Regeneration of Retinotectal Projections After Optic Tectum Removal in Adult Newts - eCommons
←
→
Page content transcription
If your browser does not render page correctly, please read the page content below
University of Dayton
eCommons
Biology Faculty Publications                                                                                             Department of Biology

11-15-2007

Regeneration of Retinotectal Projections After
Optic Tectum Removal in Adult Newts
Mitsumasa Okamoto

Hatsuki Ohsawa

Toshinori Hayashi

Katsushi Owaribe

Panagiotis A. Tsonis
University of Dayton, ptsonis1@udayton.edu

Follow this and additional works at: https://ecommons.udayton.edu/bio_fac_pub
     Part of the Biology Commons

eCommons Citation
Okamoto, Mitsumasa; Ohsawa, Hatsuki; Hayashi, Toshinori; Owaribe, Katsushi; and Tsonis, Panagiotis A., "Regeneration of
Retinotectal Projections After Optic Tectum Removal in Adult Newts" (2007). Biology Faculty Publications. 3.
https://ecommons.udayton.edu/bio_fac_pub/3

This Article is brought to you for free and open access by the Department of Biology at eCommons. It has been accepted for inclusion in Biology
Faculty Publications by an authorized administrator of eCommons. For more information, please contact frice1@udayton.edu,
mschlangen1@udayton.edu.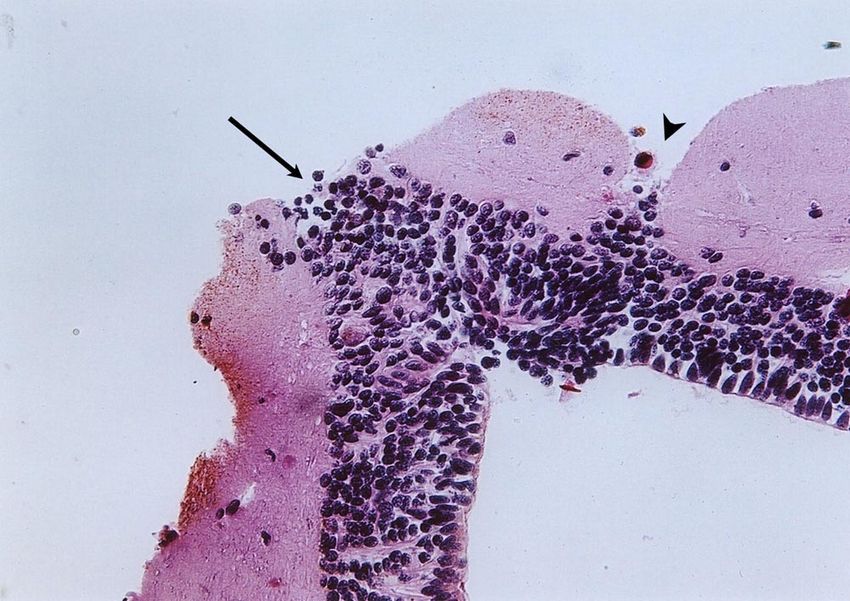
Molecular Vision 2007; 13:2112-8                                                    ©2007 Molecular Vision
        Received 20 July 2007 | Accepted 31 October 2007 | Published 15 November 2007

Regeneration of retinotectal projections after optic tectum removal
in adult newts
    Mitsumasa Okamoto,1 Hatsuki Ohsawa,1 Toshinori Hayashi,1 Katsushi Owaribe,1 Panagiotis A. Tsonis2

    1
    Division of Biological Science, Graduate School of Science, Nagoya University, Chikusa-ku, Nagoya, Japan; 2Center for Tissue
    Regeneration and Engineering and Department of Biology, University of Dayton, Dayton, OH

          Purpose: When injured, the adult newt possesses the remarkable capability to regenerate tissues and organs with return of
          function and physiology. One example is the newt eye, in which regeneration can restore normal vision if the retina or lens
          has been removed. We wanted to examine how the retinotectal projections regenerate after removal of the brain’s optic
          tectum and establish this animal as a model for retinal projection as well as a central nervous system regeneration model.
          Methods: A major portion of the left optic tectum was removed in several adult newts, and the animals were monitored
          postoperatively for eight months to observe regeneration and innervation. Cell proliferation was examined by histological
          methods and by BrdU incorporation.
          Results: We observed that adult newts have the capability to the excised optic tectum. As indicated by horseradish peroxi-
          dase staining, 80% of the retinotectal projection area was regenerated eight months after the operation, even though the
          wound closed much earlier. Our study provides the first quantitation of regeneration of the retinotectal projections. The
          ependymal cells that line the ventricle were the most likely source of the regenerated tectum. After removal, cell prolifera-
          tion was detected only in the ependymal cells layer. Double staining of proliferating cells and neurons was limited,
          indicating that direct transition of ependymal cells is a possibility.
          Conclusions: The retinotectal projections after removal of the adult newt optic tectum can be readily re-established. Thus,
          this model can become indispensable for the study of vision restoration and neurogenesis.

      Regeneration of the central nervous system is quite lim-                          pan) and fed frozen porcine liver pieces. The average size was
ited among vertebrates. Studies have indicated neurogenesis                             11-12 cm long from head to tail.
is possible in the mammalian brain [1-4]. The mammalian brain                                Excision of the midbrain of the newt: Figure 1 presents
does not show any regenerative ability when parts of it are                             newt brain anatomy and histological sections taken from the
removed. Some fish and amphibians, including the newt,                                  different areas of the newt brain. Newts were anesthetized by
though, show quite remarkable regeneration of the brain [5].                            placing them for 20 min in a solution of 0.1% MS222 (Sigma,
Of all the vertebrates, the adult newt is considered the cham-                          St. Louis, MO), and held in a special apparatus that we de-
pion of regeneration. It can readily replace lost limbs, retina,                        signed and built, which has a head holder so that the newt’s
lens, heart, tail (with spinal cord), and other tissues [6,7]. We                       head can be held tight. that we designed and built. A 2x6-mm
wanted to establish the newt as a brain and central nervous                             region of the scalp and skull just above the whole brain was
system regeneration system model. We were especially inter-                             cut out with a wheel cutter. After the meninges above the mid-
ested in examining the re-establishment of the retinotectal pro-                        brain were peeled off with fine forceps, a portion of the optic
jections after part of the optic tectum was removed. Previous                           tectum of the left midbrain was aspirated with a glass capil-
studies have investigated regeneration in the newt brain, but                           lary (inside diameter, 0.7 mm) using a vacuum pump. The
there has not been a detailed quantitative study of regenera-                           midbrain was excised with fine scissors, and the scalp and
tion of the retinotectal projections [8-12]. We employed horse-                         skull (previously removed and preserved in the newt saline
radish peroxidase staining and developed a quantitative method                          solution that consists of 115 mM NaCl, 3.7 mM KCl, 3 mM
to evaluate and correlate regeneration of the retinotectal pro-                         CaCl2, 1 mM MgCl2, 18 mM D-glucose, 5 mM HEPES, pH
jections with regeneration of the wounded (removed) optic                               7.5 adjusted with 0.3 N NaOH) were re-attached. Each oper-
tectum.                                                                                 ated animal was placed on wet paper towels. Under these con-
                                                                                        ditions newts were virtually inactive for more than one month.
                     METHODS                                                            The wound was heal closed naturally. To avoid bacterial in-
Animals: Adult Japanese newts, Cynops pyrrogaster, were                                 fection during the operation, we included 500 µg/ml kanamy-
purchased from Hamamatsu Seibutsu Kyouzai (Shizuoka, Ja-                                cin sulfate and 50 µg/ml tetracycline (Invitrogen, Carlsbad,
                                                                                        CA) into the anesthetized solutions. After complete wound
Correspondence to: Panagiotis A. Tsonis, Center for Tissue Regen-                       closure, the newts were returned to the tap water.
eration and Engineering and Department of Biology, University of                             Detection of retinotectal projection pattern with horse-
Dayton, Dayton, OH 45469-2320; Phone: (937) 229-2579; FAX:                              radish peroxidase: As depicted in Figure 2 we injected horse-
(937) 229-2021; email: panagiotis.tsonis@notes.udayton.edu                              radish peroxidase (HRP) on the ventral side of both eyes. Such
                                                                               2112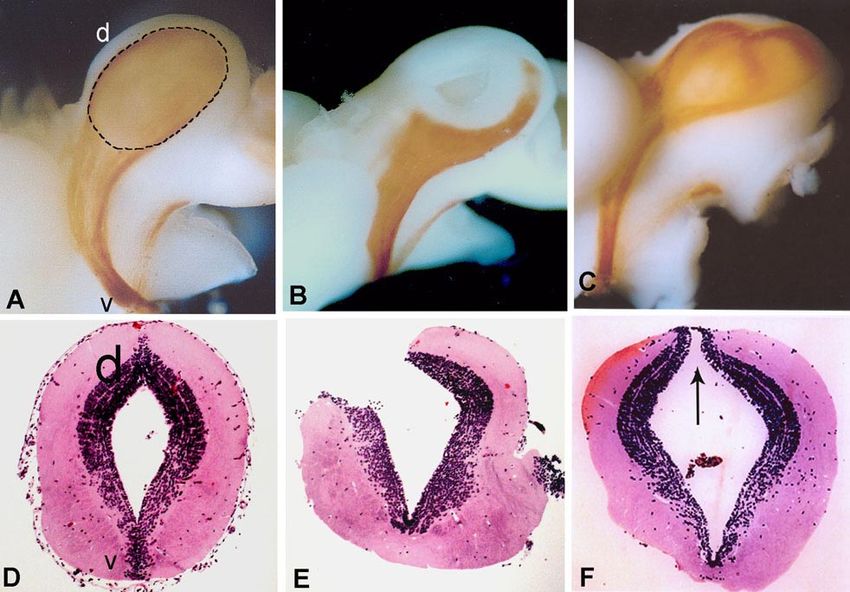
Molecular Vision 2007; 13:2112-8                                ©2007 Molecular Vision

                                                                                            Figure 1. Histological sections
                                                                                            and anatomy of the newt brain.
                                                                                            This figure shows the basic
                                                                                            anatomy of the newt brain and
                                                                                            aims to orient the reader in the
                                                                                            sections of the brain that were
                                                                                            analyzed. In the middle of the
                                                                                            panel we can see the overall
                                                                                            anatomy of the newt brain. On
                                                                                            the top there are cross sections
                                                                                            (A-E), which correspond to the
                                                                                            different parts of the brain (cor-
                                                                                            responding to lines A-E in the
                                                                                            middle of the panel). On the
                                                                                            bottom there is a sagittal sec-
                                                                                            tion showing also the corre-
                                                                                            sponding parts. A: endbrain, B:
                                                                                            interbrain, C: midbrain, D:
                                                                                            hindbrain, E: marrowbrain.

                                                                                   Figure 2. Method for detecting regen-
                                                                                   eration of the retinotectal projections.
                                                                                   The top panel shows the method we
                                                                                   devised for quantitation of regeneration
                                                                                   of the retinotectal projections. The area
                                                                                   that contains the regenerated tectum was
                                                                                   excised from the brain. The brain was
                                                                                   then divided in two parts by a slit in the
                                                                                   ventral side. The right part was the un-
                                                                                   injured part, while the left part was the
                                                                                   injured and regenerating part. The flat-
                                                                                   tened sides were placed on a glass slide
                                                                                   and the photo prints were used to mea-
                                                                                   sure the area of the optic tectum that
                                                                                   was innervated by the axons (see Meth-
                                                                                   ods). The lower panel on the left shows
                                                                                   the injection of horseradish peroxidase
                                                                                   (HRP) on the ventral site and on the
                                                                                   right it shows how the HRP has been
                                                                                   taken by the nerve fibers to indicate in-
                                                                                   nervation in the regenerated optic tec-
                                                                                   tum.

                                                                            2113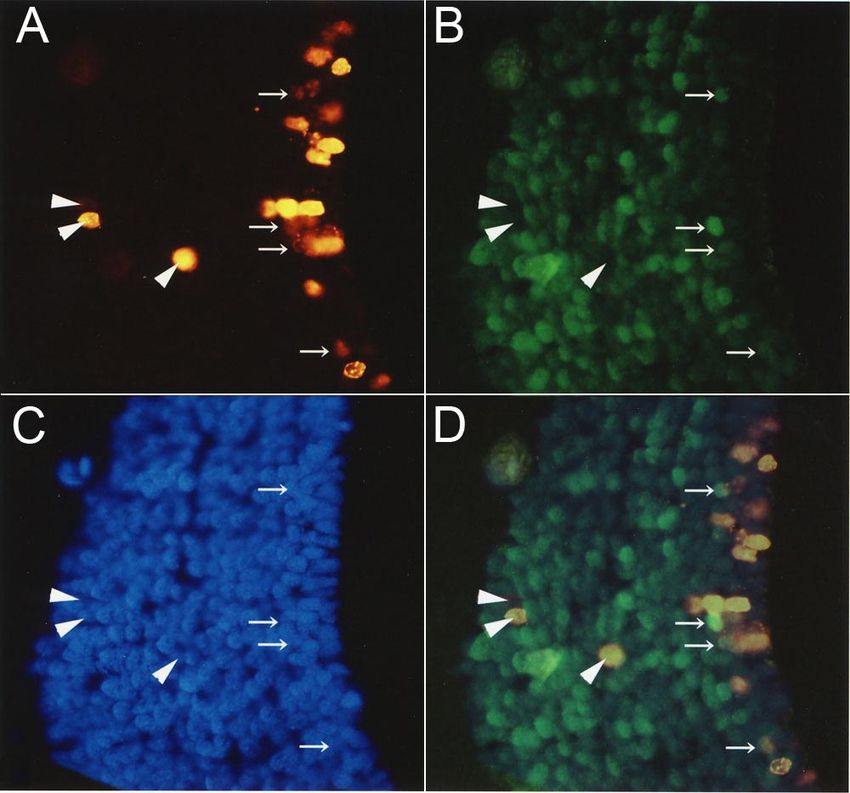
Molecular Vision 2007; 13:2112-8                                                       ©2007 Molecular Vision

an injection labels all the nerve fibers extending from the retina          tions from the midbrain were stained with H&E and exam-
ganglion cells. To measure and quantitate the retinotectal pro-             ined for mitosis. Cell proliferation was also detected by BrdU
jection area, we developed a new method. For this purpose,                  incorporation. BrdU was injected intraperitoneally, starting at
mid and inter brain were isolated from the whole brain, and a               day 8 after excision of the optic tectum. We injected BrdU
slit was made in the ventral side dividing the brain in the right           every other day for five times. After 1-2 months, the operated
part (uninjured) and the left part (injured and regenerating).              brains were isolated and examined for BrdU incorporation.
Then both flattened sides were placed on a glass slide with the             Deparaffinized sections were treated with mouse anti-NeuN
dorsal sides up (Figure 2). The photo prints of the flattened               (1:300; Ab Cam, Cambridge, MA) for 1 h at room tempera-
samples were treated with computer software to measure the                  ture (RT). After rinsing, the sections were treated with sec-
area of the optic tectum that was innervated by the axons.                  ondary antibody Alexa at 1:100 dilution (Molecular Probes,
      Detection of cell proliferation and immunofluorescence:               Carlsbad, CA) for 1 h at RT. After rinsing, 1:10 diluted BrdU
Brain samples were collected at different times from 5-40 days              antibody was added for 1 h at RT. Then sections were treated
post operation, fixed and embedded in paraffin. Paraffin sec-               with 1:500 diluted anti-rat Cy3 secondary antibody for 1 h at

Figure 3. Regeneration of the retinotectal projections. Regeneration of the retinotectal projections pattern after excision of the left optic
tectum (OT) of the midbrain (mesencephalon). A-C: Visualization of the retinotectal pattern in the midbrain and interbrain (diencephalon) by
horseradish peroxidase staining of optic nerve fibers. A, Un-operated left OT showing the normal patterns of labeled retinotectal projections.
Dotted line defines the OT. B, Left OT just after excision with apparent loss of the retinotectal projections due to the operation. C: Regenerat-
ing left OT six months after operation, with recovery of the retinotectal projections, as indicated by the staining with HRP. Compare the
similarity in the staining patterns with A. D-F: Shown are hematoxylin and eosin-stained transverse sections of the midbrain that correspond
to figures in A-C, respectively. D: Unoperated midbrain. E: A cross section through the excised tectum (corresponding to B) showing a
missing large area due to the removal of the tectum tissue. F: A cross section through a regenerating tectum (corresponding to C) six months
after excision. Note that the tissue has been regenerated and that it looks considerably similar to un-operated brain shown in D. Arrow indicates
the remnant of the wound in this sample. The top part of the tissue in A-C and of the sections in D-F is the dorsal (d) and the bottom is the
ventral (v) side of the midbrain. The minor tract of labeled axons outside the left optic tectum is the tractus opticus accessory [15]. These tracts
are located at the interbrain region. According to the orientation of the specimens in A-C the endbrain is located on the left of the stained tracts
and the hindbrain on the right (see also illustration in Figure 1).
                                                                        2114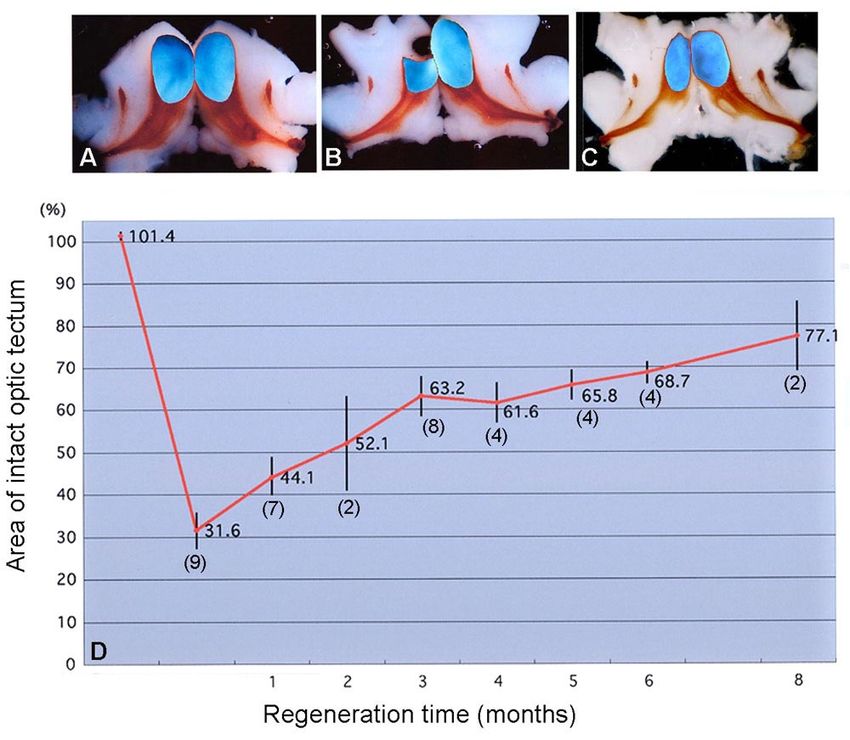
Molecular Vision 2007; 13:2112-8                                                    ©2007 Molecular Vision

RT. After rinsing, the sections were stained with DAPI, cov-
ered with Permflow medium and observed.

                RESULTS & DISCUSSION
We followed the process of the retinotectal projection recov-
ery patterns for eight months following excision of the left
optic tectum. Figure 3A shows the projection pattern of the

Figure 5. The coronal section of the optic tectum at one-month post
surgery. This figure shows histological features of wound healing in
the brain. This sample was taken one month after excision of the left
tectum. The arrowhead indicates the joint of the left and the right
optic tectum (OT), and the arrow indicates the wound closure. Wound
closure of the lesion seemed to occur earlier than brain tissue regen-
eration.

Figure 4. Rate of regeneration of the retinotectal projections during a period of eight months after optic tectum excision. A-C: The blue
colored areas indicate the left and right optic tectum in the brain samples processed for quantitation as described in the Methods. A: Unoperated
control. B: A sample taken immediately after the excision of the left tectum. Almost 70% of the left OT was excised. C: The OT after eight
months. The structure of the original midbrain appeared to have recovered at this stage. D: The recovery rate during eight months. The
unoperated right OT, which served as the standard, was compared to the operated left OT, and the recovery rate was observed. The rate
gradually increased to about 80% by eight months. Numbers in parentheses indicate the number of newts for each time point, and bars
represent mean±SE. The value 101.4% for the un-operated left OT is because we assume as 100% the mean value of the un-operated right OT.
Evidently the right OT was slightly smaller.
                                                                        2115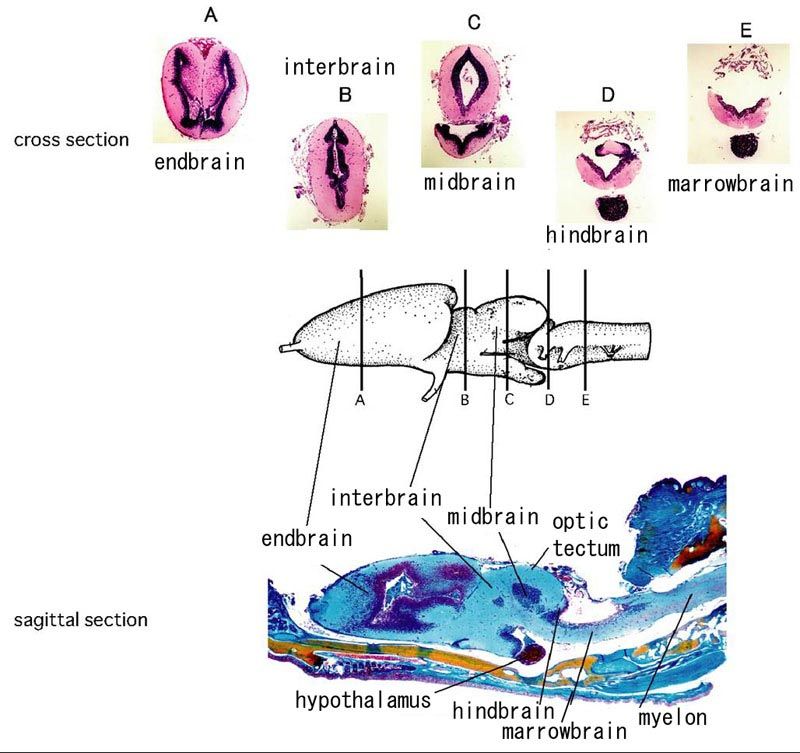
Molecular Vision 2007; 13:2112-8 ©2007 Molecular Vision
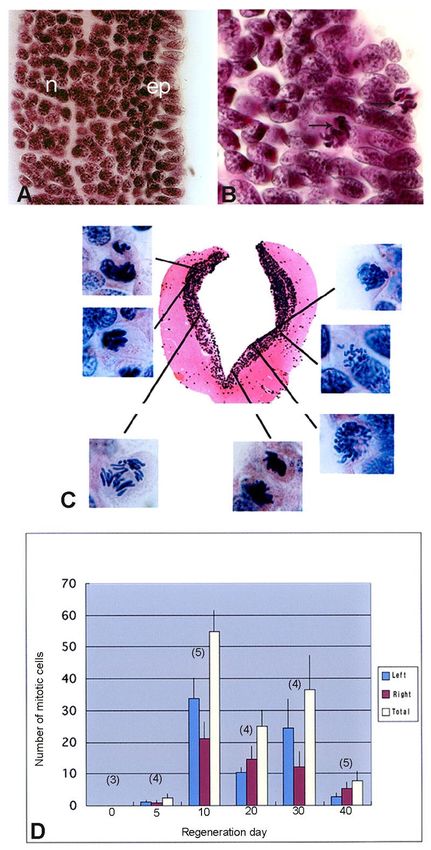
Figure 6. Cell proliferation in the mid-
brain during early regeneration stages.
A: A normal midbrain coronal section.
The marker n indicates the neuronal cell
layer and ep marks the ependymal cell
layer. The layer of nerve fibers is to the
left of the neuronal cell layer and the
ventricle is on the right side of the
ependymal cell layer. B: At ten days
postoperative, mitotic figures can be
seen only in the ependymal cell layer.
Unoperated control ependymal cells are
composed of a single layer of cells.
However, probably due to cellular
growth, they form a multilayer by ten
days post surgery (compare with A). C:
A typical section of the midbrain at ten
days post surgery. Many mitotic figures
can be seen in the ependymal cell layer
facing the ventricle. The pink stained
area is the nerve fiber region. The neu-
ronal cell layer and ependyma are
stained violet. D: The change of the mi-
totic cell numbers counted in serial sec-
tions of the midbrain during early stage
of regeneration. Blue represent cells in
the left part of the brain, red represent
cells on the right portion and white is
the total number. Mitotic cells peak at
day postoperative 10 and gradually de-
crease by postoperative day 40. Day 0
is un-operated control. Numbers in pa-
rentheses indicate the number of newts
for each time point, and bars mark
mean±SE.
2116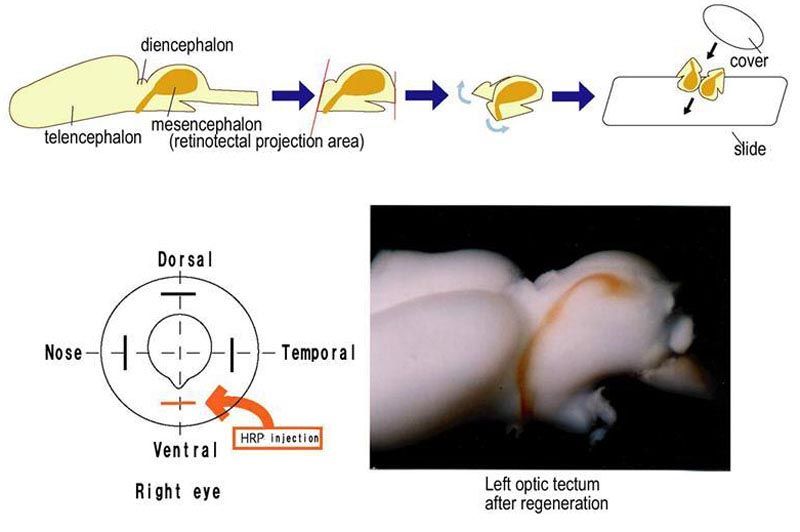
Molecular Vision 2007; 13:2112-8                                                  ©2007 Molecular Vision

right optic nerves on the left optic tectum of the normal mid-              the left optic tectum was surgically removed. By postopera-
brain. In the newt, all optic nerves derive from a right eye                tive eight months (the last time point in our experiments) nearly
projection to the left optic tectum through the optic chiasm                80% of the projection area had been recovered, and it appeared
and vice versa for the optic nerves from the left eye. Figure               it would take several more months for regeneration to com-
3B presents the projection pattern just after excision of the               plete.
left optic tectum of the midbrain. In the transverse sections,                    We must stress here that the wound recovered much
the control and the excised portion of the left optic tectum are            sooner. A large wound such as the one shown in Figure 3B,E
clearly evident (Figure 3D,E). Six months after the operation,              usually within 1 month (Figure 5). However, as seen in Figure
the retinotectal projection pattern had recovered considerably              4D, the projection area was only recovered by 10%. So it seems
Figure 3C,F. As mentioned in the Methods section, we quan-                  that regeneration of the retinotectal projections follows with a
titated the innervation of the tectum by following the process              considerable delay when compared to wound closure.
for eight months (Figure 4). As shown in Figure 4D, 70% of

Figure 7. BrdU incorporation in cells of the regenerating brain two months after surgery. A: Cells staining positive for BrdU were mainly
present in the ependymal cell layer. B, C: NeuN (neuronal marker) staining and DAPI staining, respectively. D: Shown is an overlay of A, B
and C. Arrows point to NeuN-positive cells, and arrowheads mark NeuN-negative cells. NeuN-negative and BrdU-positive cells could be
another cells type, such as astrocytes.
                                                                   2117
Molecular Vision 2007; 13:2112-8 ©2007 Molecular Vision
We also examined cell proliferation in the brain after re- ACKNOWLEDGEMENTS
moval of the tectum. For this we counted mitotic figures in We thank Dr. Masami Watanabe for valuable discussions and
histological serial sections of the midbrain. The results are reading of the manuscript, and we thank Kazuji Suzuki and
shown in Figure 6. The newt midbrain is mainly composed of Tadashi Masuda for their contribution in developing the head
three parts: the innermost ependymal cell layer lining the ven- holder apparatus. This work was partially supported by the
tricular wall, the neuronal cell layer composed of neurons and Center for Tissue Regeneration and Engineering at the Uni-
glia cells, and the outermost nerve fiber layer (Figure 6A). versity of Dayton.
Figure 6B shows mitotic figures in the transverse sections of
the midbrain at postoperative day 10. The mitotic figures were REFERENCES
present at the ependymal cell layer. There were a few mitotic 1. Doetsch F, Caille I, Lim DA, Garcia-Verdugo JM, Alvarez-Buylla
cells evident at postoperative day 5, but they dramatically in- A. Subventricular zone astrocytes are neural stem cells in the
creased around postoperative day 10. The numbers peaked adult mammalian brain. Cell 1999; 97:703-16.
around postoperative month 1, then dropped around postop- 2. Johansson CB, Momma S, Clarke DL, Risling M, Lendahl U, Frisen
J. Identification of a neural stem cell in the adult mammalian
erative day 40 (Figure 6C). In a comparison with other brain
central nervous system. Cell 1999; 96:25-34.
regeneration models [5,11,12], we observed that mitotic fig- 3. Gage FH. Neurogenesis in the adult brain. J Neurosci 2002; 22:612-
ures in our model were not limited to the lesion area, but could 3.
be observed in the unoperated right portion of the midbrain. 4. Stocum DL. Regenerative Biology and Medicine. Academic Press
In addition, we observed mitosis in neighboring regions, such (2006). San Diego, CA.
as diencephalons and metencephalon. It is not known at the 5. Goss RJ. Principles of Regeneration. Academic Press (1969). New
present time if ependymal cells from the un-operated area con- York, NY
tribute to regeneration. Special labeling techniques are required 6. Tsonis PA. Regeneration in vertebrates. Dev Biol 2000; 221:273-
to answer this question. We also confirmed such proliferation 84.
7. Alvarado AS, Tsonis PA. Bridging the regeneration gap: genetic
patterns with BrdU incorporation (Figure 7). However, we were
insights from diverse animal models. Nat Rev Genet 2006;
unable to detect many BrdU-positive cells in the neuronal layer. 7:873-84.
One explanation for this might be that dividing ependymal 8. Endo T, Yoshino J, Kado K, Tochinai S. Brain regeneration in
cells replenish the ependymal cell layer, while non-dividing anuran amphibians. Dev Growth Differ 2007; 49:121-9.
ones differentiate to neurons and the other cells of the brain. 9. Minelli G, Del Grande P. Localization and quantitative analysis of
Another explanation could be that one daughter cell (of the the elements leading to the regeneration of the optic tectum in
labeled ependymal cell) migrates out, but most of them die. It the adult Triturus cristatus carnifex. Z Mikrosk Anat Forsch 1974;
is possible these cells represent differentiated cells that origi- 88:209-24.
nated from ependymal cells, which, however stain weakly for 10. Minelli G, Franceschini V, Del Grande P, Ciani F. Newly-formed
neurons in the regenerating optic tectum of Triturus cristatus
BrdU because they have gone through many cell divisions
carnifex. Basic Appl Histochem 1987; 31:43-52.
and weakly for NeuN because they are just beginning to dif- 11. Del Grande P, Franceschini V, Minelli G, Ciani F. Mitotic activ-
ferentiate into neurons. Such possibilities remain to be exam- ity of the telencephalic matrix areas following optic tectum or
ined when newt markers and more sophisticated labeling tech- pallial cortex lesion in newt. Z Mikrosk Anat Forsch 1990;
nology become readily available. Also, it could be that sus- 104:617-24.
tained presence for longer times might be necessary for BrdU 12. Minelli G, del Grande P, Franceschini V, Ciani F. Proliferative
uptaking by the newt cells [14]. However, this line of research response of the mesencephalic matrix areas in the reparation of
was beyond the scope of the present work. In the present study, the optic tectum of Triturus cristatus carnifex. Z Mikrosk Anat
we wanted to follow and quantitate for the first time (and over Forsch 1990; 104:17-25.
13. Fujisawa H, Watanabe K, Tani N, Ibata Y. Retinotopic analysis
long periods of time) regeneration of the retinotectal projec-
of fiber pathways is amphibians. I. The adult newt Cynops
tions during brain regeneration in the adult newt. Our results pyrrhogaster. Brain Res 1981; 206:9-20.
clearly show considerable regeneration of the visual projec- 14. Parish CL, Beljajeva A, Arenas E, Simon A. Midbrain dopamin-
tions, demonstrating the adult newt system can be an indis- ergic neurogenesis and behavioural recovery in a salamander
pensable model for research in this area. lesion-induced regeneration model. Development 2007;
134:2881-7.
15. Herrick CJ. The brain of the tiger salamander. The University of
Chicago Press, Chicago, IL, 1948.
The print version of this article was created on 15 Nov 2007. This reflects all typographical corrections and errata to the article through that
date. Details of any changes may be found in the online version of the article. α
2118You can also read